Do people respond to air pollution forecasts?

In 2010, the House of Commons Environmental Audit Committee published a report on air quality in which they concluded that “poor air quality probably causes more mortality and morbidity than passive smoking, road traffic accidents or obesity”. Concerned that the Government was still not giving air quality a high enough priority, the Committee published another report in 2011. To date, the Committee’s main recommendations have not been implemented. Amidst new evidence on the negative effects of air pollution on health and a court case that found the UK Government guilty of failing to meet EU air quality targets, the Committee published a third report on air quality last week.

One of the Committee’s recommendations is that the Government works more closely with the Met Office, the BBC and other broadcasters to ensure that forecasts of high air pollution episodes are disseminated widely together with advice on what action should be taken. The Committee’s rationale is that information about air pollution allows individuals to take action that reduces exposure. However, avoidance behaviour, such as staying indoors, imposes a cost on individuals that might exceed the perceived gains.

A BBC weather forecast for Bristol showing the commonly
encountered “green” air pollution forecast.

In a paper published this month in the Journal of Health Economics (Link with free access until 22 January 2015) I investigate responses to air pollution warnings in England. I obtained data on the air pollution forecasts issued by Defra from 2002 to 2008. During this period the daily air pollution forecast was freely available via the internet, a Freephone telephone service, Teletext and with the weather forecast on the BBC website. The forecast was disseminated using traffic light colour-coding, with green indicating low levels of air pollution, amber moderate and red high levels. “Red” forecasts were extremely rare (3% of forecasts) and “green” forecasts very common (70% of forecasts), so a change from “green” to “amber” (27% of forecasts) was akin to an air pollution warning. Hence, I define an “amber” or “red” forecast as an air pollution warning.

Air pollution warnings and hospital emergency admissions

First, I looked at indirect evidence of avoidance behaviour by estimating the relationship between air pollution warnings and hospital emergency admissions for respiratory diseases in children aged 5 to 19 years. I controlled for actual air pollution levels and therefore essentially compared days with a certain level of air pollution for which an air pollution warning was issued with days with the same level of air pollution for which no air pollution warning was issued. If parents and children do respond to air pollution warnings by reducing their exposure or taking other preventive measures, we expect fewer emergency hospital admissions on days for which an air pollution warning was issued compared to days with the same level of air pollution but no warning.

Looking at all respiratory admissions I found no effect. Looking at a subset of respiratory admissions – admissions for acute respiratory infections such as pneumonia and bronchitis – I also found no effect. Only when I examined another subset of respiratory admissions, namely admissions for asthma, did I find that air pollution warnings reduce hospital emergency admissions, by about 8%.

Presumably, it is less costly for asthmatics to respond to an air pollution warning. Standard advice for asthmatics is to adjust the dose of their reliever medicine and to make sure they carry their inhaler with them. Other types of respiratory disease require far more disruptive preventive measures such as staying indoors, making the cost of responding to air pollution warnings larger than the perceived gains.

Direct evidence of avoidance behaviour: visitors to Bristol Zoo

To find direct evidence of avoidance behaviour, I examined daily visitor counts to Bristol Zoo Gardens. Zoos are attractive destinations for families with children. Even with some animal houses under cover, most people will consider a zoo visit to be an outdoor activity and therefore susceptible individuals might adjust their plans to the air pollution forecast.  I found that lower temperature, more rain and higher wind speed reduced visitor numbers but found no effect of air pollution warnings on visitor numbers. Only when I looked at members – visitors who have an annual membership that entitles them to unlimited visits for a year – did I find that air pollution warnings reduce visits by about 6%. For members it is less costly to respond to air pollution warnings as they tend to be local residents who can just drop in for a quick visit. Thus, the perceived gains from postponing a visit are more likely to exceed the cost of postponing than for day visitors.

This graph shows monthly means of visitors to Bristol Zoo Gardens, daily maximum temperature and monthly total of air pollution warnings. Day visitors (grey bars) are far more responsive to temperature (yellow line) than to air pollution warnings (purple bars). Members’ visits (green bars) seem to be fewer in months with more air pollution warnings (purple bars).

Overall, my results show that whether individuals respond to air quality information depends on the costs and benefits of doing so: where costs are low and the benefits clear, responses are higher. This finding suggests, that wider dissemination of high air pollution forecasts as recommended by the Commons Environmental Audit Committee may not bring about the desired prevention of adverse health effects from air pollution. The Committee’s other recommendations aimed at lowering air pollution levels are more likely to succeed in preventing ill health.

——————-
This blog is written by Cabot Institute member Katharina Janke, Research Associate in Applied Microeconomics and Health Economics at the Centre for Market and Public Organisation at the University of Bristol.
Katharina Janke

Uncertainties about the effects of fracking in the UK

I’m a bit of an energy agnostic. This week I attended a talk at UWE about fracking and its impact on the environment in the hope of making a better informed decision on the controversial topic.

What is fracking?

Jenna Brown, a first year PhD student, started off with an introduction to fracking, or hydraulic fracturing.

Gas molecules trapped in dense shale rocks are almost impossible to obtain by normal drilling. Fracking involves drilling vertically down and then horizontally into the rock. Fracking fluid, a mixture of water, sand and other chemicals, is injected into the rock at high pressure, expanding the tiny cracks and allowing the gas trapped within to escape and travel back up the pipe for collection.

Taken from BBC News


Natural gas is viewed as a transition energy source from dirty fossil fuels to greener renewable energies in the future. It produces almost half the amount of carbon dioxide per unit of energy than coal, which could help us meet the national target of reducing CO2 emissions by 80% by 2050.


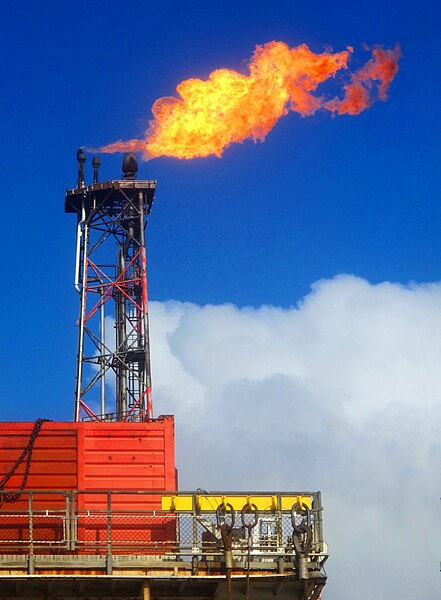
Image by Varodrig
Jenna explained that the government see shale gas as a way to improve our national energy security. The British Geological Survey estimates that the Bowland Shale reserve in central England holds 1329 trillion cubic feet of shale gas, although across the entire UK estimates vary wildly because they are mainly based on data from other countries. Jenna highlighted the fact that whilst this is a huge amount of fuel, much if not most of it will not be technically recoverable. Still, it could provide greater energy security in the UK, which imported one trillion cubic feet of natural gas in the first six months of this year.

Water use
Dr. Chad Staddon, associate professor of resource geographies at UWE, spoke about the possible problems that UK water security faces with fracking. As well as the potential to pollute ground water (explained here), Chad was concerned that fracking could pose a problem to UK water security but even more worried that this had not yet been assessed in detail.
Fracking requires a huge volume of water; around 4 – 20 million litres per well in the USA according to the International Energy Agency. This amounts to just 0.3% of US national water usage, however Chad highlighted two important problems with this figure. First, US shale reserves are only around 750m deep. In the UK, our reserves may reach down as far as 3km, meaning we could layer six or more horizontal fracking pipes in a single well. The increased depth and number of fracking pipes means that significantly more water may be required in UK sites.
The second issue is one of local resources. Even in relatively rainy countries there can be pockets of water scarcity, which can be intensified by local demand. Unfortunately, there is little guidance in the published scientific literature to aid the UK in avoiding over-committing our water to fracking at the cost of food production and water security. Parts of the UK, such as the south east, are already at water capacity. Adding the water demands of fracking may lead to local droughts or the costly transport of water from other parts of the country. A 2013 report for the Department of Energy and Climate Change stated that if waste water is recycled where possible, water requirements for fracking could be managed sustainably.

Air quality
Dr. Enda Hayes, a UWE research fellow, spoke about the effect fracking could have on air quality management. He was trying to learn more about the emissions from a shale gas well, however the findings in scientific reports varied enormously because no two wells are the same. Different geographies, demands and outputs greatly affect the results, which means that it is very difficult to use US data to try and predict the effect of fracking on UK air quality. Fracking could contribute to particulates and toxic compounds in the air, as well as increased CO2 emissions and methane leaks.  
Less CO2 is produced per unit of energy when burning shale gas compared to coal and oil. However Enda spoke about recent reports stating that the net effect of shale gas on greenhouse gases is likely to be small, and could actually increase emissions if the displaced coal and other fossil fuels are used elsewhere. Another major player in climate change is methane. In the USA, 11% of methanee missions are produced from coal mining, mainly by methane leaking from the mines. Shale gas is mostly comprised of methane, which must be properly contained to prevent even greater emissions from leaks.


Big questions
The panelists agreed that there is simply not enough relevant information to decide whether the benefits outweigh the negatives of fracking in the UK. There are several big questions that I think need to be answered. Just how much water would a UK shale gas well need? Do we have the technology to prevent water and air pollution? Do viable alternatives to fracking exist, and can we afford them?
Is there a perfect energy source? Should we stick to cheap-but-dirty coal or switch to inefficient bird-killing windmills? Are you more scared of nuclear meltdowns or global warming? As David Shukman concluded in his excellent BBC article,whichever type of power you choose, it is going to make someone angry“.
This blog is written by Sarah Jose, Biological Sciences, University of Bristol
You can follow Sarah on Twitter @JoseSci
Sarah Jose