Time for policymakers to make policies (and to learn from those who are)

From a social scientist’s point of view, the recent IPCC report and the reception it has received are a bit odd. The report certainly reflects a huge amount of work, its message is vital, and it’s great so many people are hearing it. But not much in the report updates how we think about climate change. We’ve known for a while that people are changing the climate, and that how much more the climate changes will depend on the decisions we make.

What decisions? The Summary for Policymakers— the scientists’ memo to the people who will make the really important choices—doesn’t say. The words “fossil fuel”, “oil”, and “coal” never even appear. Nor “regulation”, “ban”, “subsidy”, or “tax”. The last five pages of the 42-page Summary are entitled “Limiting Future Climate Change”; but while “policymakers” appear, “policies” do not.

This is not the fault of the authors; Working Group I’s remit does not include policy recommendations. Even Working Group III (focused on mitigation) is not allowed to advocate for specific choices. Yet every IPCC contributor knows the most important question is which emission pathway we take, and that will depend on what policies we choose.

Which is why it’s so odd that big policy issues and announcements get comparatively little airtime (and research funding). For example, in June, the European Union codified in law the goal of reducing its greenhouse gas emissions 55% by 2030 (relative to 1990), and last month the European Commission presented a set of ambitious proposals for hitting that target. As a continent, Europe is already leading the world in emission reductions (albeit starting from a high level, with large cumulative historical emissions), and showing the rest of the world how to organize high-income societies in low-carbon ways. But the Commission’s proposals—called “Fit for 55”—have gone largely under the radar, not only outside of the EU but even within it.

The proposals are worth examining. At least according to the Commission, they will make the EU’s greenhouse gas emissions consistent with its commitments under the Paris Agreement. (Independent assessments generally agree that while a 55% reduction by 2030 won’t hit the Paris Agreement’s 1.5˚ target, it would be a proportionate contribution to the goal of limiting global heating to no more than 2˚.) And they will build on the EU’s prior reduction of its territorial emissions by 24% between 1990 and 2019.

A change of -24% over that period, and -18% for consumption emissions, is in one sense disappointing, given that climate scientists were warning about the need for action even before 1990. But this achievement, inadequate though it may be, far exceeds those of other high per-capita emitters, like the U.S. (+14%), Canada (+21%), or Australia (+54%).

The most notable reductions have been in the areas of electricity generation and heavy industry—sectors covered by the EU’s emissions trading system (ETS). Emissions from buildings have not declined as much, and those from transportation (land, air, and marine) have risen. Several of the Fit for 55 proposals therefore focus on these sectors. Maritime transport is to be incorporated into the ETS; free permits for aviation are to be eliminated; and a new, separate ETS for fuels used in buildings and land transport is to be established. Sales of new cars and trucks with internal combustion engines will end as of 2035, and increased taxes will apply to fuels for transport, heat, and electricity.

The Commission also proposes to cut emissions under the ETS by 4.2% each year (rather than 2.2% currently); expand the share of electricity sourced from renewables; and set a stricter (lower) target for the total amount of energy the EU will use by 2030—for the sake of greater energy efficiency.

All of this is going to be hugely contentious, and it will take a year or two at least for the Commission, the member-states, and the European Parliament to negotiate a final version. Corporate lobbying will shape the outcome, as will public opinion (paywall).

Two of the most interesting proposals are meant to head off opposition from industry and voters. A carbon border adjustment mechanism will put a price on greenhouse gases emitted by the production abroad of selected imports into the EU (provisionally cement, fertiliser, iron, steel, electricity, and aluminium). This will protect European producers from competitors subject to weaker rules. A social climate fund, paid for out of the new ETS, will compensate low-income consumers and small businesses for the increased costs of fossil fuels—thereby preventing any rise in fuel poverty.

No country is doing enough to mitigate emissions. But Fit for 55 represents the broadest, most detailed emissions reductions plan in the world—and, in some form, it will be implemented. Decision-makers everywhere should be studying, and making, policies like this.

—————————–

This guest blog is by friend of Cabot Insitute for the Environment and PLOS Climate Academic Editor Malcolm Fairbrother. Malcolm is a Professor of Sociology at Umeå University (Sweden), the Institute for Futures Studies (Stockholm), and University of Graz (Austria). Twitter: @malcolmfair. This blog has been reposted with kind permission from Malcolm Fairbrother. View the original blog.

Top image credit: Cold Dawn, Warm World by Mark McNestry, CC BY 2.0


Five satellite images that show how fast our planet is changing


Stocktrek Images, Inc. / Alamy

You have probably seen satellite images of the planet through applications like Google Earth. These provide a fascinating view of the surface of the planet from a unique vantage point and can be both beautiful to look at and useful aids for planning. But satellite observations can provide far more insights than that. In fact, they are essential for understanding how our planet is changing and responding to global heating and can do so much more than just “taking pictures”.

It really is rocket science and the kind of information we can now obtain from what are called Earth observation satellites is revolutionising our ability to carry out a comprehensive and timely health check on the planetary systems we rely on for our survival. We can measure changes in sea level down to a single millimetre, changes in how much water is stored in underground rocks, the temperature of the land and ocean and the spread of atmospheric pollutants and greenhouse gases, all from space.

Here I have selected five striking images that illustrate how Earth observation data is informing climate scientists about the changing characteristics of the planet we call home.

1. The sea level is rising – but where?

Map showing global sea level rise
The sea is rising quickly – but not evenly.
ESA/CLS/LEGOS, CC BY-SA

Sea level rise is predicted to be one of the most serious consequences of global heating: under the more extreme “business-as-usual” scenario, a two-metre rise would flood 600 million people by the end of this century. The pattern of sea surface height change, however, is not uniform across the oceans.

This image shows mean sea level trends over 13 years in which the global average rise was about 3.2mm a year. But the rate was three or four times faster in some places, like the south western Pacific to the east of Indonesia and New Zealand, where there are numerous small islands and atolls that are already very vulnerable to sea level rise. Meanwhile in other parts of the ocean the sea level has barely changed, such as in the Pacific to the west of North America.

2. Permafrost is thawing

Source: ESA

Permafrost is permanently frozen ground and the vast majority of it lies in the Arctic. It stores huge quantities of carbon but when it thaws, that carbon is released as CO₂ and an even more potent greenhouse gas: methane. Permafrost stores about 1,500 billion tonnes of carbon – twice as much as in the whole of the atmosphere – and it is incredibly important that carbon stays in the ground.

This animation combines satellite, ground-based measurements of soil temperature and computer modelling to map the permafrost temperature at depth across the Arctic and how it is changing with time, giving an indication of where it is thawing.

3. Lockdown cleans Europe’s skies

Source: ESA

Nitrogen dioxide is an atmospheric pollutant that can have serious health impacts, especially for those who are asthmatic or have weakened lung function, and it can increase the acidity of rainfall with damaging effects on sensitive ecosystems and plant health. A major source is from internal combustion engines found in cars and other vehicles.

This animation shows the difference in NO₂ concentrations over Europe before national pandemic-related lockdowns began in March 2020 and just after. The latter shows a dramatic reduction in concentration over major conurbations such as Madrid, Milan and Paris.

4. Deforestation in the Amazon

Credits: ESA/USGS/Deimos Imaging

Tropical forests have been described as the lungs of the planet, breathing in CO₂ and storing it in woody biomass while exhaling oxygen. Deforestation in Amazonia has been in the news recently because of deregulation and increased forest clearing in Brazil but it had been taking place, perhaps not so rapidly, for decades. This animation shows dramatic loss of rainforest in the western Brazilian state of Rondonia between 1986 and 2010, as observed by satellites.

5. A megacity-sized iceberg

Source: ESA

The Antarctic Ice Sheet contains enough frozen water to raise global sea level by 58 metres if it all ended up in the ocean. The floating ice shelves that fringe the continent act as a buffer and barrier between the warm ocean and inland ice but they are vulnerable to both oceanic and atmospheric warming.

This animation shows the break-off of a huge iceberg dubbed A-74, captured by satellite radar images that have the advantage they can “see” through clouds and operate day or night and are thus unaffected by the 24 hours of darkness that occurs during the Antarctic winter. The iceberg that forms is 1,270 km² in area which is about the same size as Greater London.

These examples illustrate just a few ways in which satellite data are providing unique, global observations of key components of the climate system and biosphere that are essential for our understanding of how the planet is changing. We can use this data to monitor those changes and improve models used to predict future change. In the run up to the vitally important UN climate conference, COP26 in Glasgow this November, colleagues and I have produced a briefing paper to highlight the role Earth observation satellites will play in safeguarding the climate and other systems that we rely on to make this beautiful, fragile planet habitable.The Conversation

————————–

This blog is written by Cabot Institute for the Environment member Jonathan Bamber, Professor of Physical Geography, University of Bristol.

This article is republished from The Conversation under a Creative Commons license. Read the original article.

Jonathan Bamber

Conference connects Climate Change Education with latest research

The Climate Change Education Research Network (CCERN), a GW4 funded project, hosted the first in a series of online conferences on 20th April 2021. The event saw 300 attendees register from across the education sector and beyond.

The conference kicked off with a video compilation of youth climate activists explaining why they believe the climate emergency should be top of all teachers’ priority list – watch the Youth Voice video here. The inspirational words from the young activists addressed the ‘why’ teachers ought to respond to the climate crisis, the next question was ‘how’. To tackle this from a research-informed perspective, we interviewed Martha Monroe of the University of Florida to establish the theoretical context. Monroe shared findings from a recent review into effective strategies in climate change education. Watch the full interview with Martha Monroe here and read the review here.

The next section of the event was a series of quickfire presentations from a multitude of experienced practitioners sharing best practice from the classroom. We heard valuable contributions from teachers from across the CCERN network – watch them here. Sam Williams of Cotham Garden Primary School spoke about his work embedding a climate change curriculum in the primary school setting. Robert Walker of Fairfield High School offered a secondary school perspective from his role as Global Learning Co-ordinator. John Davidson and Simon Ross of Geography Southwest gave an insightful presentation of some of the common misconceptions around climate change. Celia Tidmarsh (University of Bristol) and Will Roberts (Fairfield High School) spoke about various initiatives on the PGCE course which seek to encourage an interdisciplinary approach to climate change education, including the Green Apple project. The Nature Relations group presented a beautiful series of photos to provoke new perspectives in how we think about our relationships with the natural world. Finally, the Primary focus group presented learnings from success stories from their own classrooms.

A further purpose of the conference was to launch the CCERN School Survey – an innovative approach to researching the current state of climate change education in schools using teachers as researchers to gather data on the ground. Find out more and get involved here.

While meeting on Zoom can never fully replace the connections made at in-person events, the conference certainly gave a feeling of being part of something bigger than oneself. The chat was used to make introductions and share ideas – see the chat text here.

The next CCERN conference will happen towards the end of June. Sign up to our mailing list and follow us on Twitter to stay in the loop. If you want to get more involved please contact us at ed-climate@bristol.ac.uk.

The Climate Change Education Research Network (CCERN) is an initiative of the University of Bristol, University of Bath, Cardiff University and the University of Exeter. We exist to connect academic researchers and educators to address the big questions in Climate Change Education (CCE) together.

————————
This blog is written by Lauren Hennessy. Lauren is the Research Associate on the Climate Change Education Research Network. She is also a Maths teacher by training and her research interests are youth climate activism and effective strategies for delivering climate change education with a focus on social justice.
Lauren Hennessey


Why I’m mapping the carbon stored in regrowing Amazonian forests

As we navigate our way out of the global medical pandemic, many are calling for a “green economic recovery”. This green recovery should be at the forefront of many discussions as world leaders, policy makers, scientists and organisations are preparing for the 26th Conference of the Parties (COP26) due to take place in November this year in Glasgow, UK. This conference will once again try to unite the world to help tackle the next and even larger global emergency, the Climate Emergency.

In recent years, the conversations around the Climate Emergency have increased dramatically with many individuals, groups, companies and governments aiming to tackle this emergency, in part, through replanting, restoring and reforesting large areas of land.

But what if we let forests regrow back naturally? How much carbon can they absorb from the atmosphere? 

As part of my PhD research at the University of Bristol, I have been looking at naturally regrowing forests in the Brazilian Amazon rainforest. These forests are known as “Secondary forests” and regrow on land that has previously been deforested and used for agricultural or other purposes and has since been abandoned, allowing the natural vegetation to return.

Figure 1: Secondary Forest in the Tapajos region of the Brazillian Amazon (credit Ricardo Dalagnol)

Secondary Forests in the Brazilian Amazon are expected to play a key role in achieving the goals of the Paris Agreement. They have a large climate mitigation potential, given their ability to absorb carbon up to 11 times faster than old-growth forests. However, the regrowth of these secondary forests is not uniform across the Amazon and is influenced by regional and local-scale environmental drivers and human disturbances like fires and repeated deforestations.

I worked with numerous scientists from Brazil and the UK to determine the impact of different drivers on the regrowth rates of the secondary forests, using a combination of satellite data. The key datasets we needed were:

What we did

We combined the satellite data maps and overlayed them to extract information on the carbon stored in relation to the forest age to model the regrowth rate with increasing age. We overlayed the information of key environmental drivers and human disturbances to see if and how these factors impact the regrowth rates.

What we found out

Overall, we found that the environmental conditions in Western Amazon enable secondary forests to regrow faster. Here the land received lots of rainfall and does not experience much drought. In the eastern parts of the Amazon, where the climate is drier and experiences more drought, the regrowth rates were up to 60% lower.

Figure 2: Schematic summary of the main results from the paper, highlighting the spatial patterns of regrowth dependent on both climate and human disturbances. The map in the middle shows the regions of secondary forest in the Brazillian Amazon and the four panels correspond to these regions.

In addition to this, we found that the regrowth rates were reduced even further by as much as 80% in eastern regions if the forests were subject to human activities like burning and repeated deforestations before the land was finally abandoned.

What it all means

Our results show the importance of protecting and expanding secondary forest areas to help us meet the Paris Agreement Targets. Our regrowth models can be used to help determine the contribution of current and future regrowing forests in the Brazilian Amazon in a spatial manner.

We found that in 2017, the secondary forests in the Brazilian Amazon stored about 294 Terragrams Carbon aboveground (that excludes carbon stored in roots and soils). However, this number is equivalent to about 0.25% of the carbon that is already stored in Amazon’s old-growth forests. Limiting carbon emissions through deforestation and degradation through burning of old-growth forests is therefore extremely important to help tackle the Climate Emergency.

We calculated that the annual carbon absorbed by the present secondary forest area in the Amazon is enough to contribute to about 5% of Brazil’s pledged contribution to the Paris Agreement by 2030. This number may seem small, but the area covered by the Amazonian secondary forests is currently equivalent to less than 2% of the whole of Brazil. If the area of secondary forest were to be expanded this would bring with it numerous co-benefits such as generating income to landowners and re-establishing ecosystem services.

In December 2020, many countries submitted updates to their so-called Nationally Determined Contributions (NDC), a country’s individual contributions to the Paris Agreement, this included Brazil. However, Brazil’s updated NDC no longer includes a clear position on reforestation, restoration and eliminating illegal deforestation.

At a time when we have all seen and felt the impacts of a true global emergency such as the COVID-19 pandemic, it becomes easier to imagine the potential impacts of climate change if left at the back of politician’s agendas. In the run up to COP26 it is now more important than ever to raise, not lower ambitions as we continue to tackle the global Climate Emergency.

You can read the full paper and download the data here: https://rdcu.be/cg4um.

——————————-

This blog is written by Cabot Institute member Viola Heinrich, School of Geographical Sciences, University of Bristol.

Viola Heinrich

Learning lessons from the past to inform the future

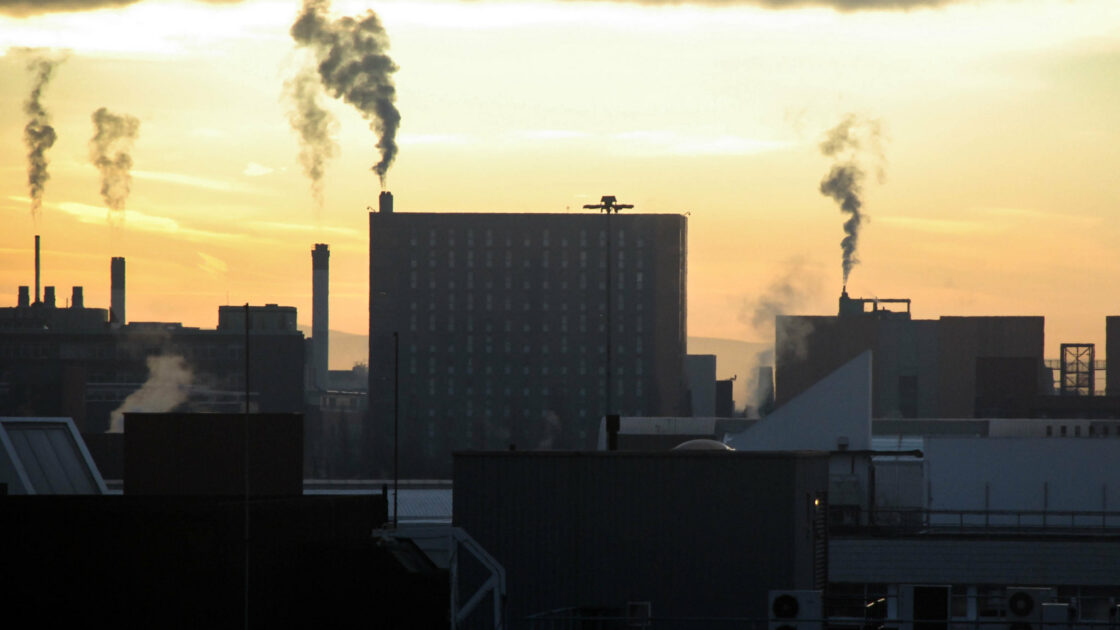
A fairly recent blog post on the EGU blog site reiterated the compelling comparison between the current COVID-19 crisis and the ongoing climate emergency, focusing on extreme events such as hurricanes, heatwaves and severe rainfall-related flooding, all of which are likely to get worse as the climate warms (Langendijk & Osman 2020).  This comparison has been made by us Climate Scientists since the COVID-19 crisis began; both the virus and the disastrous impacts of anthropogenic climate change were (and indeed are) predictable but little was done in the ways of preparedness, both were (and are still being) underestimated by those in power despite warnings from science, and both are global in extent and therefore require united action.  Another comparison is that both are being intensively, and urgently, researched across the world by many centres of excellence.  We don’t have all the answers yet for either, but progress is being made on both.

When it comes to understanding our climate, there are several approaches; these are, of course, not mutually exclusive.  We can focus on present-day climate variability, to understand the physical mechanisms behind our current climate; examples include, but are not limited to, ocean-atmosphere interactions, land-atmosphere feedbacks, or extreme events (see Williams et al. 2008, Williams & Kniveton 2012 or Williams et al. 2012, as well as work from many others).

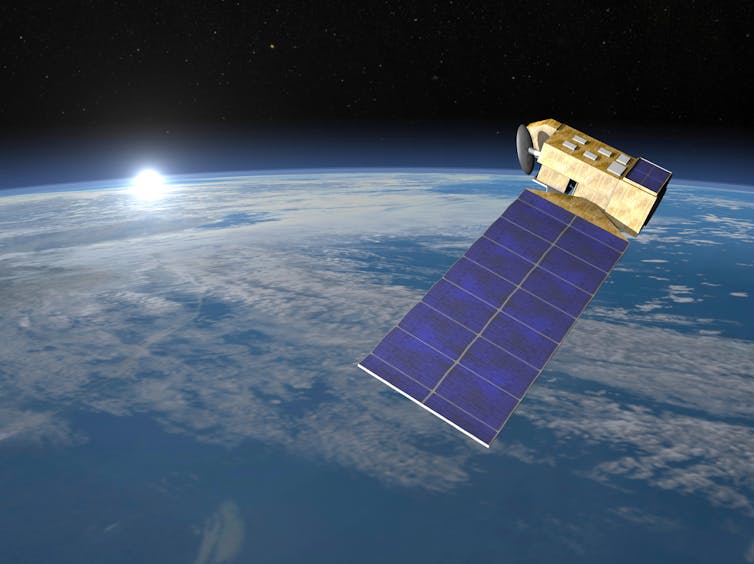
Alternatively, we can use our current understanding of the physical mechanisms driving current climate to make projections of the future, either globally or regionally.  State-of-the-art General Circulation Models (GCMs) can provide projections of future climate under various scenarios of socio-economic development, including but not limited to greenhouse gas (GHG) emissions (Williams 2017).

A third approach is to focus on climates during the deep (i.e. geological) past, using tools to determine past climate such as ice cores, tree rings and carbon dating.  Unlike the historical period, which usually includes the past in which there are human observations or documents, the deep past usually refers to the prehistoric era and includes timescales ranging from thousands of years ago (ka) to millions of years ago (Ma).  Understanding past climate changes and mechanisms is highly important in improving our projections of possible future climate change (e.g. Haywood et al. 2016, Otto-Bliesner et al. 2017, Kageyama et al. 2018, and many others).

One reason for looking at the deep past is that it provides an opportunity to use our GCMs to simulate climate scenarios very different to today, and compare these to scenarios based on past.

These days I am primarily focusing on the latter approach, and am involved in almost all of the palaeoclimate scenarios coming out of UK’s physical climate model, called HadGEM3-GC3.1.  These focus on different times in the past, such as the mid-Holocene (MH, ~6 ka), the Last Glacial Maximum (LGM, ~26.5 ka), the Last Interglacial (LIG, ~127 ka), the mid-Pliocene Warm Period (Pliocene, ~3.3 Ma) and the Early Eocene Climate Optimum / Paleocene-Eocene Thermal Maximum (EECO / PETM, collectively referred to here as the Eocene, ~50-55 Ma).  All of these have been (or are being) conducted under the auspices of the 6th phase of the Coupled Modelling Intercomparison Project (CMIP6) and 4th phase of the Palaeoclimate Modelling Intercomparison Project (PMIP4).

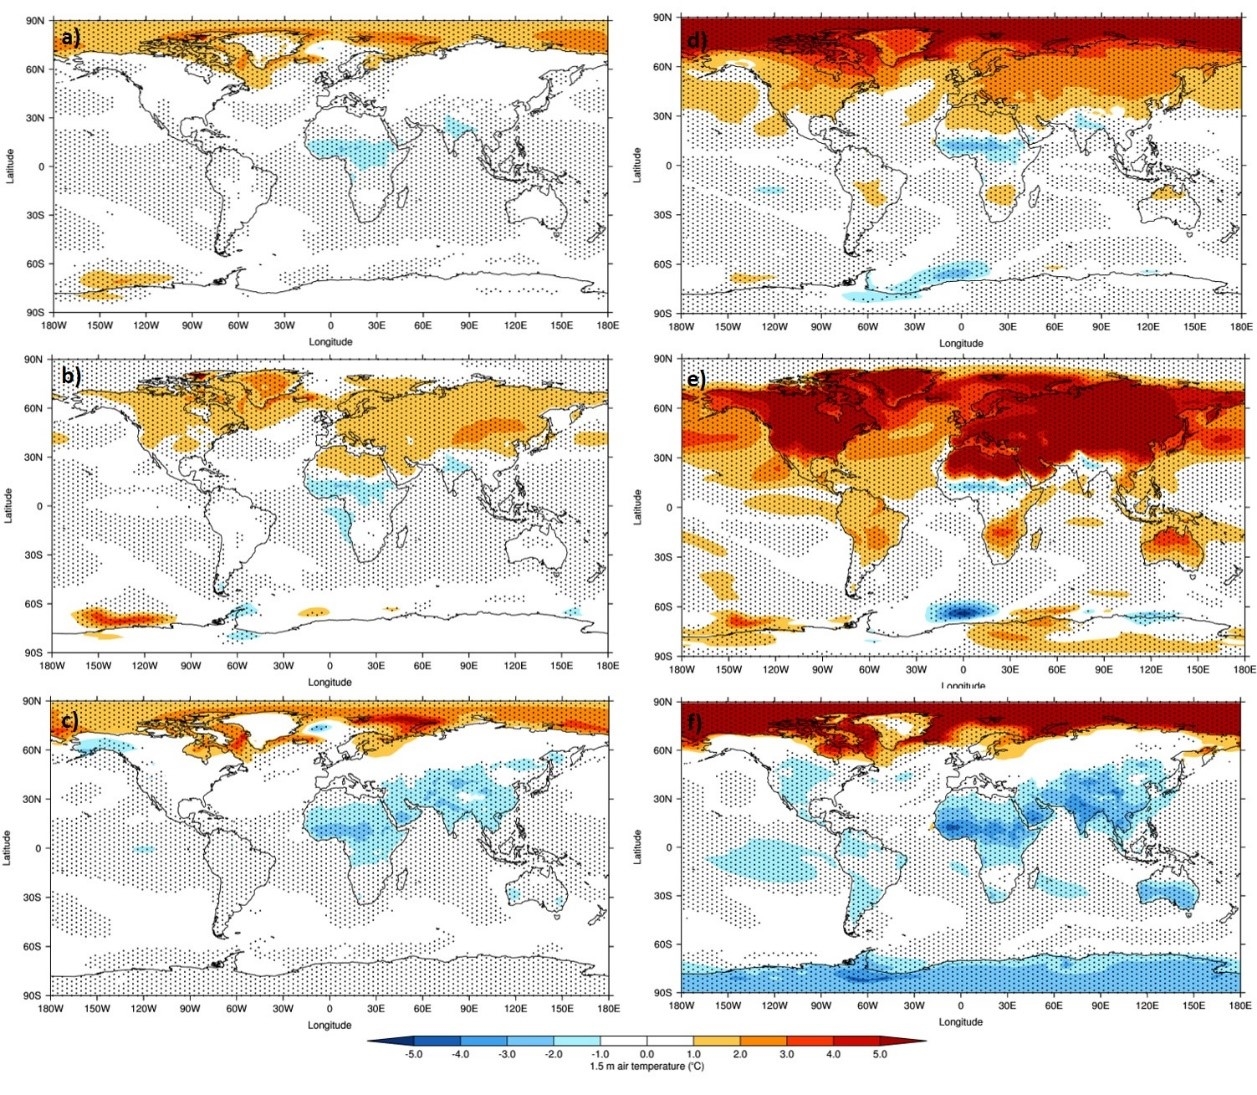
Figure 1: Calendar adjusted 1.5 m air temperature climatology differences, mid-Holocene and last interglacial simulations from the UK’s physical climate model, relative to the preindustrial era: a-c) mid Holocene – preindustrial; d-f) last interglacial – preindustrial. Top row: Annual; Middle row: Northern Hemisphere summer (June-August); Bottom row: Northern Hemisphere winter (December-February). Stippling shows statistical significance (as calculated by a Student’s T-test) at the 99% level. Taken from Williams et al. (2020).

These five periods are of particular interest to the above projects for a number of different reasons.  Before these are discussed, however, the fundamentals of deep past climate change need to be briefly introduced.  In short, climate changes in the geological past (i.e. without human influence) can either be internal to the planet (e.g. volcanic eruptions, oceanic CO2 release) or external to the planet (e.g. changes in the Earth’s orbit around the Sun). Arguably, it is changes to the amount of incoming solar radiation (known as insolation) that is the primary driver behind all long-term climate change. Theories for long-term climate change, such as the beginning and ending of ice ages, began to be proposed during the 1800s. However, it wasn’t until 1913 that the Serbian mathematician, Milutin Milankovitch, developed our modern day understanding of glacial cycles. In short, Milankovitch identified three interacting cycles concerning the Earth’s position relative to the Sun: a) Eccentricity, in which the Earth’s orbit around the Sun changes from being more or less circular on a period of 100-400 ka; b) Obliquity, in which the Earth’s axis changes from being more or less tilted towards the Sun on a period of ~41 ka; and c) Precession, in which the Earth’s polar regions appear to ‘wobble’ around the axis (like a spinning top coming to its end) on a period of ~19-24 ka. All of these three cycles not only change the overall amount of insolation received by the planet, and therefore its average temperature, but also where the most energy is received; this ultimately determines the strength and timing of our seasons.

With this background in mind, and returning to the paleoclimate scenarios mentioned above, the MH and the LIG collectively represent a ‘warm climate’ state.   During these periods the Earth’s axis was tilted slightly more towards the Sun, resulting in an increase in Northern Hemisphere insolation (because of the larger landmasses here relative to the Southern Hemisphere).  This caused much warmer Northern Hemisphere summers and enhanced African, Asian and South American monsoons (Kageyama et al. 2018).  The increase in temperatures can be seen in Figure 1, where clearly the largest increases relative to the preindustrial era (PI) are in the Northern Hemisphere during June-August (Williams et al. 2020).  By comparing model simulations to palaeoclimate reconstructions during these periods, the models’ ability to simulate these climates can be tested and this therefore assesses our confidence in future projections of climate change; which, as mentioned above, may result in more rainfall extremes and enhanced monsoons.

In contrast, the LGM represents a ‘cold climate’ state which, although unlikely to return as a result of increasing anthropogenic GHG emissions, nevertheless provides a well-documented climatic period during which to test the models.  Going back further in time, the Pliocene is the most recent time in the geological past when CO2 levels were roughly equivalent to today, and was a time when global annual mean temperatures were 1.8-3.6°C higher than today (Haywood et al. 2016).  See Figure 2 for the increases in sea surface temperature (SST) during the Pliocene, relative to today.  This annual mean temperature increase is clearly much higher than the current target, as specified by the Paris Agreement, of keeping warming below 1.5°C (at most 2°C) by the end of 2100.  Importantly, the CO2 increases and subsequent warming during the Pliocene occurred over timescales of thousands to millions of years, whereas anthropogenic GHG emissions have caused a similar increase in CO2 (from ~280 parts per million (ppmv) during the PI to just over 400 ppmv today) in under 300 years.  The Pliocene, therefore, provides an excellent analogy for what our climate might be like in the (possibly near) future.

Finally, going back even further, the Eocene is the most recent time in the past that was characterised by very high CO2 concentrations, twice or more than that of today at >800-1000 ppmv; this resulted in temperatures ~5°C higher than today in the tropics and ~20°C higher than today at high latitudes (Lunt et al. 2012, Lunt et al. 2017).  The reason the Eocene is highly relevant, and of concern, is that these CO2 concentrations are roughly equivalent to those projected to occur by the end of 2100, if the Representative Concentration Pathway (RCP) 8.5 scenario, also known as the ‘Business-as-usual’ scenario, which was used in the most recent IPCC report (IPCC 2014), becomes reality.  The Eocene, therefore, provides an excellent albeit concerning analogy for what the worse-case scenario could be like in the future, if action is not taken.

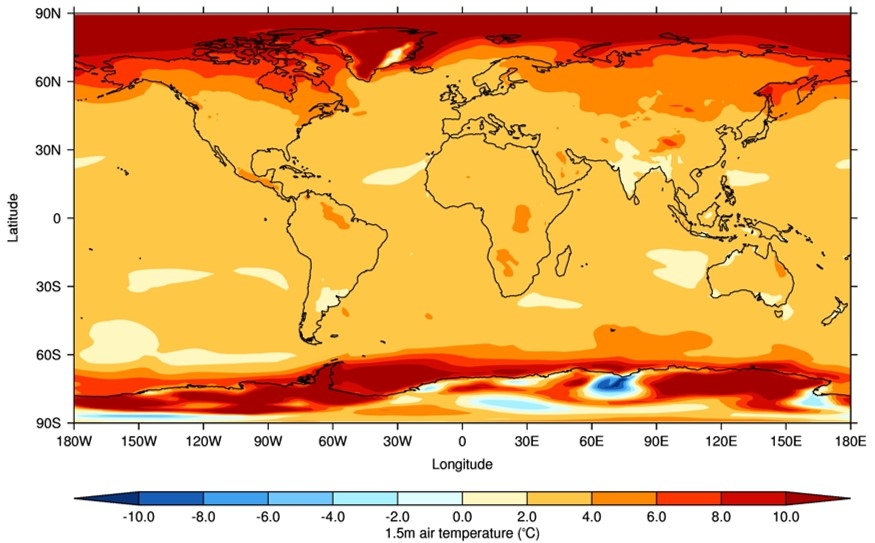
Figure 2: 1.5 m air temperature climatology differences, Pliocene simulation from the UK’s physical climate model, relative to the preindustrial era.

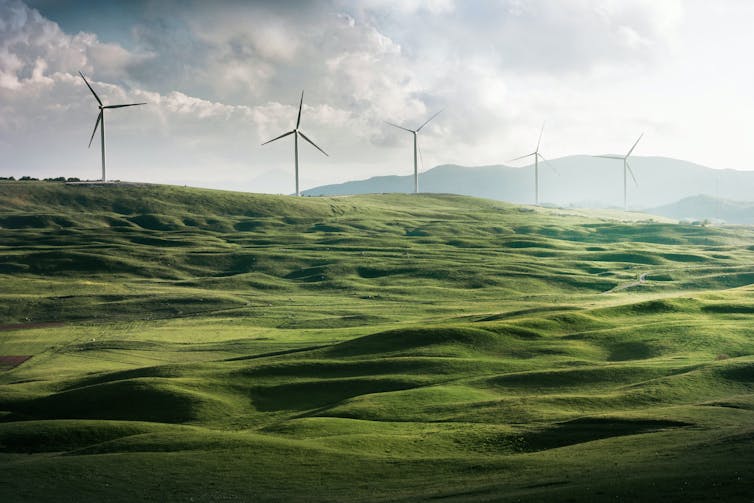
Understanding the climate, how it has changed in the past and how it might change in the future is a complex task and subject to various interrelated approaches.  One of these approaches, the concept of using the past to inform the future (e.g. Braconnot et al. 2011), has been described here.  Just like in the case of COVID-19, it is our responsibility as Climate Scientists to work together across approaches and disciplines, as well as reliably communicating the science to governments, policymakers and the general public, in order to mitigate the crisis as much as possible.

References

Braconnot, P., Harrison, S. P., Otto-Bliesner, B, et al. (2011).  ‘The palaeoclimate modelling intercomparison project contribution to CMIP5’.  CLIVAR Exchanges Newsletter.  56: 15-19

Haywood, A. M., Dowsett, H. J., Dolan, A. M. et al. (2016).  ‘The Pliocene Model Intercomparison Project (PlioMIP) Phase 2: scientific objectives and experimental design’.  Climate of the Past.  12: 663-675

IPCC (2014).  ‘Climate Change 2014: Synthesis Report. Contribution of Working Groups I, II and III to the Fifth Assessment Report of the Intergovernmental Panel on Climate Change’ [Core Writing Team, R.K. Pachauri and L.A. Meyer (eds.)].  IPCC.  Geneva, Switzerland, 151 pp

Kageyama, M., Braconnot, P., Harrison, S. P. et al. (2018).  ‘The PMIP4 contribution to CMIP6 – Part 1: Overview and over-arching analysis plan’.  Geoscientific Model Development.  11: 1033-1057

Langendijk, G. S. & Osman, M. (2020).  ‘Hurricane COVID-19: What can COVID-19 tell us about tackling climate change?’.  EGU Blogs: Climate.  https://blogs.egu.eu/divisions/cl/2020/04/16/corona-2/.  Accessed 24/7/20

Lunt, D. J., Dunkley-Jones, T., Heinemann, M. et al. (2012).  ‘A model–data comparison for a multi-model ensemble of early Eocene atmosphere–ocean simulations: EoMIP’.  Climate of the Past.  8: 1717-1736

Lunt, D. J., Huber, M., Anagnostou, E. et al. (2017).  ‘The DeepMIP contribution to PMIP4: experimental design for model simulations of the EECO, PETM, and pre-PETM (version 1.0)’.  Geoscientific Model Development.  10: 889-901

Otto-Bliesner, B. L., Braconnot, P., Harrison, S. P. et al. (2017).  ‘The PMIP4 contribution to CMIP6 – Part 2: Two interglacials, scientific objective and experimental design for Holocene and Last Interglacial simulations’.  Geoscientific Model Development.  10: 3979-4003

Williams, C. J. R., Kniveton, D. R. & Layberry, R. (2008).  ‘Influence of South Atlantic sea surface temperatures on rainfall variability and extremes over southern Africa’.  Journal of Climate.  21: 6498-6520

Williams, C. J. R., Allan, R. P. & Kniveton, D. R. (2012).  ‘Diagnosing atmosphere-land feedbacks in CMIP5 climate models’.  Environmental Research Letters.  7 (4)

Williams, C. J. R. & Kniveton, D. R. (2012).  ‘Atmosphere-land surface interactions and their influence on extreme rainfall and potential abrupt climate change over southern Africa’. Climatic Change.  112 (3-4): 981-996

Williams, C. J. R. (2017).  ‘Climate change in Chile: an analysis of state-of-the-art observations, satellite-derived estimates and climate model simulations’. Journal of Earth Science & Climatic Change.  8 (5): 1-11

Williams, C. J. R., Guarino, M-V., Capron, E. (2020).  ‘CMIP6/PMIP4 simulations of the mid-Holocene and Last Interglacial using HadGEM3: comparison to the pre-industrial era, previous model versions, and proxy data’.  Climate of the Past.  Accepted

——————————–

This blog was written by Cabot Institute member Dr Charles Williams, a climate scientist within the School of Geographical Sciences, University of Bristol. His research focusses on deep time to understand how climate has behaved in the warmer worlds experienced during the early Eocene and mid-Pliocene (ca. 50 – 3 Mio years ago). This blog was reposted with kind permission from Charles. View the original blog on the EGU blog site.

Dr Charles Williams


Coronavirus: have we already missed the opportunity to build a better world?


Chad Madden/Unsplash, FAL

Many people like to say that the coronavirus is teaching us a lesson, as if the pandemic were a kind of morality play that should lead to a change in our behaviour. It shows us that we can make big shifts quickly if we want to. That we can build back better. That social inequality is starkly revealed at times of crisis. That there is a “magic money tree”. The idea that crisis leads to change was also common during the financial crunch over a decade ago, but that didn’t produce any lasting transformations. So will post-COVID life be any different?

At the start of lockdown, in the middle of the anxiety and confusion, I started to notice that I was enjoying myself. I was cooking and gardening more; the air was cleaner, my city was quieter and I was spending more time with my partner. Lots of people started to write about the idea that there should be #NoGoingBack. It seemed that we had taken a deep collective breath, and then started to think about coronavirus as a stimulus to encourage us to think how we might address other big issues – climate, inequality, racism and so on.

Being an academic, I decided to put together a quick and dirty book on what life might look like after the crisis. I persuaded various activists and academics to write short pieces on working at home, money, leadership and lots of other topics. The idea was to show that the world could change if we wanted it to. The book is out now, but it already feels, only four months after I imagined it, like the document of a lost time. The city noises are back, and jet trails are beginning to scar the sky. Has the moment been lost?

The second lesson of coronavirus, it seems, is just how stubborn the old structures are. Wanting the world to be different does not translate into making it so. Slogans do not produce change when power, habits and infrastructure remain substantially the same. So what can we learn now about crisis and making enduring change?

Aerial view of beach with sun umbrellas.
Getting back to ‘normal’.
Alex Blăjan/Unsplash, FAL

Think about holidays in Spain and Portugal. Sunny beaches, cold drinks and cheap food. For many people, getting back to normal means going back to what they had before, and they don’t want to hear some killjoy – whether a head of state or spokesperson for Extinction Rebellion, telling them that they can’t have it. To add to the problem, there are thousands of jobs at stake in the various industries that take people on holiday – manufacturing and servicing planes, working in airports and hotels, selling duty free, aviation fuel and tourist special lunches.

The world that we live in now has a kind of stickiness to it, both in terms of the expectations of people and the infrastructure that already exists and that reinforces those expectations. The pre-COVID world was sculpted by flows of money and trade, motorways and shipping containers. As we gradually begin to stir from lockdown, these channels are already waiting, ready to be refilled with people and things.

In the social sciences, people often refer to “path dependency”, the idea that our history constrains our present choices. If we have cities that are organised around large numbers of people commuting into the centre, or houses and flats that don’t have workspaces, then it is going to be difficult for large numbers of people to work at home. If you have to park your car on the street, then charging an electric one means running a cable on the pavement. If our pensions funds rely on oil companies making huge profits, then encouraging investment in green technologies is going to be an uphill struggle.

Wind turbines on a green hillside.
A hill we need to climb.
Appolinary Kalashnikova/Unsplash, FAL

No wonder then that it is easier for most people to assume that the future will be like the past because the shape of the present limits how we can think about things to come. This is what worries me most about my book. I think it might be pushing against a door that is already closing. And the people who are pushing it are not stupid or evil, just politicians, businesses and ordinary people who all want to go back to what they had.

If lesson one of coronavirus is that things can change, and lesson two is that they easily slip back again, then lesson three must be about the importance of presenting images of the future that motivate people to imagine change. It is clear that we can’t carry on as we are and need to stop doing things that we were doing, but just saying that is a really bad way to encourage people to change.

Instead, we need to imagine futures which are just as exciting and fulfilling as the high speed, high consumption, high carbon ones we must leave behind. We need to give people good reasons to jump the tracks because it is much easier just to slide back to what you know. So let’s imagine the city quieter, and the air cleaner, less need to fight with traffic jams and more time to spend with family and friends. That seems like a good start to learning from COVID-19.

———————————-
This blog was written by Martin Parker, Professor of Organisation Studies, University of BristolThis article is republished from The Conversation under a Creative Commons license. Read the original article.
Martin Parker

Teach for the Future: Greening the national curriculum

Do you feel like you learnt enough about climate change in school? Most likely, you didn’t as only 44% in a national survey of students felt like they had. If you think that’s disgraceful than I have good news for you. In the last few months the National Union of Students (NUS) launched a partner charity called Students Organising for Sustainability (SOS). SOS’s first campaign is ‘Teach the Future’ which aims to incorporate sustainability into the wider English curriculum instead of the topic being squeezed into either Geography or Science. The campaign includes the first ever legislation to be drafted by pupils and students: The Climate Emergency Education Bill!

The Climate Emergency Education Bill has extensive demands from students across the UK for sustainability to be included in all parts of their education, as well as a guide for supporting teachers and student voices. There’s even proposed money earmarked for making educational buildings net-zero carbon. Here’s an excerpt from the Bill’s cover that explains all of the demands in a bit more detail:

  1. A government commissioned review into how the whole of the English formal education system is preparing students for the climate emergency and ecological crisis (in the gift of the Secretary of State);
  2. Inclusion of the climate emergency and ecological crisis in teacher training and a new professional teaching qualification (in the gift of the Secretary of State);
  3. An English Climate Emergency Education Act that:
  • obligates education providers to teach the climate emergency and ecological crisis, and to have a member of their leadership team responsible for it;
  • provides new funding for: the upskilling of existing teachers and lecturers; development of teaching resources; vocational centres of excellence on low carbon skills; establishing youth voice climate boards; more youth-led climate and environmental social action; support with eco-anxiety;
  • requires, and provides new funding, to ensure all new state-funded educational buildings are net-zero from 2022, and all existing state-funded educational buildings are net-zero by 2030.

Emma and I were lucky enough to win a competition and get spots on the exclusive guest list for the launch of the Bill at Parliament on the 26 February 2020! We met up with the 46 students aged 13-26 in Parliament Square for photos before heading into the main event at Parliament. The reception was filled with students, representatives from environmental and educational charities, and MPs. We spoke with everyone, advocating for the Bill, before stopping to watch the speeches. Speeches were given by students, Parliamentarians, and educational leaders all emphasizing the urgent need for educating pupils across the nation about the climate emergency and its effects. Interestingly, most of the speakers emphasised the need for the social and economic effects of climate change to be included in the curriculum alongside the environmental. As Emma and I are quite ‘in the know’ about the devastating social effects of climate change it was good to be reminded that not everyone does. We left the event feeling inspired and ready to tackle sustainability challenges in Bristol and beyond!

If you want to support the Teach for the Future campaign write to your MP and ask them to help make the Bill into law.

—————————————-
This blog was written by Anya Kaufman, a Sustainability masters student at the University of Bristol.

Lab efficiency: Towards a greener future

The Laboratory Efficiency Assessment Framework 2020 (LEAF) marks the University of Bristol’s move to a greener future. Following on from the University’s ‘climate emergency’ declaration and 2030 carbon neutrality pledge, we’ve set a new ambition for 100% Green Lab Accreditation and institutional LEAF. This will make us the first University in the world to achieve this.

Labs impact the environment, in fact they have a greater environmental impact than offices by at least five times. They use more water and energy, produce larger quantities of waste and generally use more resources. In order to tackle this ever-growing problem LEAF was created with lab users in mind and sustainable thinking at the forefront. LEAF is an innovative tool used to drive sustainability and efficiency within STEMed labs.

In 2019 the LEAF national pilot took place involving 16 national Higher Education Institutions, including the University of Bristol. To gain LEAF accreditation each participating lab must meet a set of criteria to achieve Bronze, Silver or Gold accreditation. Through LEAF, each lab’s carbon and financial savings can be recorded as they progress.

The LEAF criteria cover all environmental aspects of the lab including circular economy and waste, procurement, business travel, equipment efficiency and chemical management. In addition to this, the criteria also include research quality, addressing international issues regarding the ‘reproducibility crisis’. LEAF differs from the previous Green Labs Initiative as it includes metrics that enable us to quantify tangible environmental and financial savings so that we can measure real time changes in line with the University’s 2030 carbon neutrality goals.

Research councils and funding bodies are also collaborating with the Higher Education Institutions taking part in LEAF with an aim for inclusion in relevant research grant proposals within two to three years.

The LEAF accreditation is designed for academic groups or facilities rather than whole departments and involves the technical community, students and research staff.

Benefits of taking part in LEAF


  • Reduces utility costs and our environmental footprint
  • Provides the opportunity for direct savings through our financial incentive schemes
  • Ensures health and safety compliance within labs
  • Increases research efficiency
  • Provides recognition for individual labs and the University on a national stage
  • Enables a bottom-up sustainability movement
  • Aligns with our commitment to the Global Sustainable Development Goals (SDGs)
  • Integrates different labs and departments
  • Strengthens relationships between Estates, lab users and other stakeholders
  • Aligns your research with the University strategy and Bristol Futures
  • Provides chances of gaining additional research funding
  • A selling point for prospective students
  • Inter-lab and inter-departmental benchmarking
  • Provides practice-based learning experiences that improve professional skills and employability
  • Improves student experience via volunteering opportunities as Laboratory Efficiency Assessment Volunteers (LEAVs)
  • Creates a better understanding within our community of our science buildings and operations


How LEAF works

After signing-up to LEAF, participants are sent the LEAF Framework – an electronic workbook with a set of easy-to-implement actions.  For each accreditation (Bronze, Silver and Gold), participants need to fulfil certain criteria. The workbook provides useful links to help achieve the criteria and information on why these actions are important for improving lab sustainability.

Completing Bronze accreditation should only take an average of five hours, as most of our labs will already be running to Bronze standards. As you progress through Silver and Gold, criteria become more challenging and include categories such as minimising the amount of single-use plastic your lab uses.

There are also several special awards: Environmental Improvement, Environmental Hero, Innovation for Engagement and Community Action.

Throughout LEAF, participants are supported by the Green Labs Team and student LEAF volunteers (LEAVs), who have received environmental audit training. On submission of workbooks, laboratory audits can be organised, led by LEAVs. LEAF aims to improve student experience by providing volunteering opportunities and training. Alternatively, teams can also be audited by staff from Campus Division, or by peer assessment if they wish. On successful completion of the workbook and audit, labs will receive green accreditation status.

LEAF closes 13 November 2020, but teams can submit workbooks and complete audits at any point during the year, note workbooks can be submitted multiple times.

So, if you’re a Technician or academic and aren’t already actively involved in LEAF 2020, sign up now! If you’re a student and you’d like to volunteer with LEAF then sign up here.

This is an exciting time for Sustainability and especially for our University, being the first institution in the UK to declare a climate emergency and the first in the world to aim for 100% LEAF accreditation in all STEMed labs!

——————————————
This blog is written by Rachael Ward and Anna Lewis from the University of Bristol’s Sustainability Team.

The case to become a Fairtrade University

In October last year, I visited the Bristol Fairtrade Network to discuss Fairtrade and the Climate Emergency and find out more about how the University of Bristol could become a Fairtrade university. I had never heard of Fairtrade being part of the solution to the climate crisis, but I’m always looking for ways to act on this vital issue. I love the concept of Fairtrade and believe that as consumers we should be more responsible for the impacts of our purchases – Fairtrade empowers us to do just that.

The meeting started off with introductions and ice-breaker facts about the climate emergency. These set the tone for the meeting; the climate emergency is happening right now, and we need to act as soon as possible to prevent disasters affecting all of us. The Global South is feeling the worst impacts of the climate emergency which makes this a justice issue. There was also a great range of people at the meeting – from experts to novices, and even a couple who had travelled from a nearby town for the meeting.

In 2018 the City of Bristol was the first UK local authority to declare a Climate Emergency, and the University of Bristol was the first UK university to announce an emergency last year, with the Bristol’s NHS Trusts and We the Curious following suit. It’s clear that this is an issue that has captured the hearts and minds of Bristol’s residents.

How can Fairtrade be part of the solution to the climate crisis?

Climate change is increasing the vulnerability of farmers across the world to price volatility associated with their products resulting from increasing extreme weather events and weather pattern variability. The Fairtrade programme provides a price premium for farmers to invest in practices which can increase their resilience to the changing climate and decrease their vulnerability to crop failures and price volatility. Premiums can mean a better cash flow amongst farming cooperatives, greater access to credit and the ability to save more easily.

The Fairtrade foundation supports projects that encourage climate change adaptation and increase the resilience of farmers. For example, training for farmers is supported, which can include advice on switching to environmentally friendly practices, such as developing nutrient-rich soils that support healthy plants and encouraging wildlife to help control pests and diseases. The promotion of these practices, in turn, encourage sustainable agricultural production.

By supporting the work of Fairtrade and becoming a Fairtrade University, the University of Bristol can support the provision of the price premium to farmers across the world. Recognising the importance of supporting the mitigation and adaptation to climate change beyond the borders of Bristol due to the global nature of the climate emergency, is critical in ensuring a holistic approach to sustainability.

What we are doing as a University

The University of Bristol is working towards becoming a Fairtrade certified University as part of its commitments to address the climate emergency. This year Fairtrade Fortnight runs from the 24 February to the 8 March and the Source Cafes, Halls of Residence, Students’ Union shop and Balloon Bar are all getting involved with promotions and events to highlight how important Fairtrade is. We are putting on an event at the SU Living Room from 12 pm to 2 pm on 27 February to answer any questions and give out Fairtrade samples. For more information on Fair Trade at the University contact sustainability-estates@bristol.ac.uk.

 
—————————–
This blog is written by Emma Lewins from the University of Bristol Sustainability Team.

To fly or not to fly? Towards a University of Bristol approach

We’ve published a short video on air travel at the University of Bristol. 


Here is a blog to accompany the video to give you more detail on the biggest issues that the university (and other similar organisations who rely on air travel) are facing as it works towards making itself carbon neutral by 2030. Caboteer Eleni Michalopoulou, who features in the video, explains more…

The effects of climate change now have almost a daily mention in the news as they become all the more frequent and evident by various studies, reports, blogs and pictures from all over the world. And as the climate crisis escalates, it was of course a matter of time before scientists pointed out the irony of flying to a conference in order to discuss the urgency and issues related to climate change. Of course, there is here an irony within the irony that led to a lot of finger pointing of scientists that do fly and a narrative of ‘unethical scientists’ that ‘don’t practice what they preach’  but we will come back to that a little later when we explore some of the reasons that people (not just scientists) fly.


I must admit that before I attended the workshop organized by the University of Bristol Sustainability Team with support from the Cabot Institute on the 10 June 2019, I had never really considered the actual facts and figures related to the aviation industry. So, I started doing some research and these are only some of the numbers I came across:

On the 17 April 2019, the University of Bristol became the first university in the UK to declare a climate emergency and joined a long list of organizations and institutions across the world in the fight against climate change.  This announcement came to highlight the university’s commitment to become carbon neutral by 2030.

Bike servicing and repair at the University of Bristol

As part of this efforts to accelerate action on its own climate impacts, the University is now developing a plan to address academic and other business travel and in particular air travel. The first task has been to assess the carbon footprint of the thousands of journeys made each year on University business by academics, postgraduate students and professional services staff.

Business travel emissions lie outside the scope of mandatory carbon reporting required in the higher education sector and are not included in the University’s carbon neutral goal. Nonetheless for the past few years the University has collated emissions data on flights and other forms of business travel, alongside those from energy use in buildings and the fuel used by its own vehicle fleet.

In order for the University to monitor and report carbon emissions, it uses three different ‘scopes’.

  • Scope 1 – Emissions are direct emissions from activities owned or controlled by the University, such as University owned vehicles and the fuel they use.
  • Scope 2 – Emissions are indirect emissions from electricity owned or consumed by the University that we do not own or control.
  • Scope 3 – Emissions are other indirect emissions that are related to the University’s activities, such as waste, water and business travel.

Analysis of these data for the business travel plan suggest that emissions from air travel have more than doubled since 2010/11 and now account for nearly one fifth of the University’s total known operational carbon footprint. This growth has occurred against a backdrop of declining emissions from the University’s estate achieved through investment, for example, in improved energy efficiency in buildings.

This was the context for the  workshop on ‘Air travel: Drivers, impacts and opportunities for change’ in order to explore the most efficient way to develop a business travel plan for the University including the constraints and opportunities for managing the impacts of air travel for academic and other business reasons. The Vice-Chancellor for Global Engagement, Dr Erik Lithander, was present in this workshop and highlighted the need to maintain our global impact as a leading university while managing our environmental footprint and remaining committed to our strong sustainability agenda.

One of the most interesting parts of the workshop was the discussion around the reasons behind air travel in the University of Bristol. So, what is academic and business travel usually linked to according to the most recent staff travel survey?  This found the most common reasons (for business or academic travel) were to attend a conference or other forum for sharing research; take part in collaborative projects with other academic or industry partners; and go to other types of meetings on University business. Travel for fieldwork and training purposes was less frequent, followed by attending trade shows and recruitment.

Discussions during the workshop considered the reasons why flying might be the first choice over video-conferencing or other travel modes)’. The following five responses emerged from the roundtable discussions as the key determining factors in the choice of air travel over other alternatives:

  1. Time
  2. Costs
  3. Technological limitations (e.g. quality of videocalls)
  4. The importance of face-to-face interaction, and
  5. Air travel being the default option in funding requirements or travel management companies.

I suppose when I walked into the workshop, my thinking regarding air travel was overly simplistic. I had not realized the complexity of this issue especially for an institution as big as the University of Bristol. During the discussions around the reasons behind flying, three were the reasons that really troubled me in terms of a complex problem that potentially requires a complex solution.

Time

Perhaps the most important issue is the issue of time. A direct flight from Bristol to, for instance, Edinburgh is approximately one hour while the same distance if covered by train is six hours in a best-case scenario. And while for most of us this could be an opportunity to relax and enjoy a lovely trip by train, what about cases where there are caring responsibilities involved, or even an extremely busy workload? This question brings us back to the irony of the irony that I briefly mentioned in the beginning. While climate scientists care, of course, about the environment and their own environmental footprint, in a lot of cases they have families, children, or are responsible for the care of a relative or an individual and increasing the duration of their business trip by 10 or even 20 hours might not be a realistic goal to set.

Costs

Similarly, while a direct flight from Bristol to Edinburgh can cost from £23 pounds, the train from Bristol to Edinburgh ranges between £140 and £280 pounds. Of course, for the biggest part these expenses are not covered by the individual researcher but even so, a very simple question to ask would be ‘why use a substantial amount from the budget to cover a train ticket and not use the cheap option of a plane ticket?’

Physical presence

What was perhaps discussed the most during the workshop was the culture and beliefs behind the idea that an academic’s physical presence would be much more beneficial and could better achieve the purpose of their visit (e.g. research, collaboration, securing funding, networking) rather than the e-presence of the same individual. Can our physical presence be replaced with the help of technology? Can we achieve the same goals through an e-conference than we would if we were there? What can replace a handshake?

I should at this point highlight, that I am not writing the above in defense of flying. I am writing it as a way to reflect on my own thoughts and discussions with colleagues both during the workshop but also afterwards. Afterall, if there was one thing that was evident from the IPCC report was the fact that our lifestyle would have to go through ‘unprecedented changes’ in order for our planet and the climate to have a chance. Perhaps, while a train trip might seem as an inconvenience or disruption to us right now it will be nothing compared to future “inconveniences and disruptions” of a much-deteriorated climate.

I truly believe that it is extremely courageous for the University to start quantifying and addressing its own emissions related to air travel. This effort to explore both the limitations but also the opportunities, by consulting and talking to members of staff is the University’s best bet in order to both meet its very ambitious sustainability goals but also maintain a strong global presence and agenda. Following the workshop in June, a program of wider staff engagement is due to take place continue in the autumn to help develop the University’s approach to air travel. Like many other colleagues, I look forward to the opportunity to contribute to this important response to the climate emergency.

————————————
This blog was written by Cabot Institute member Eleni Michalopoulou from the University of Bristol School of Chemistry.

Eleni Michalopoulou