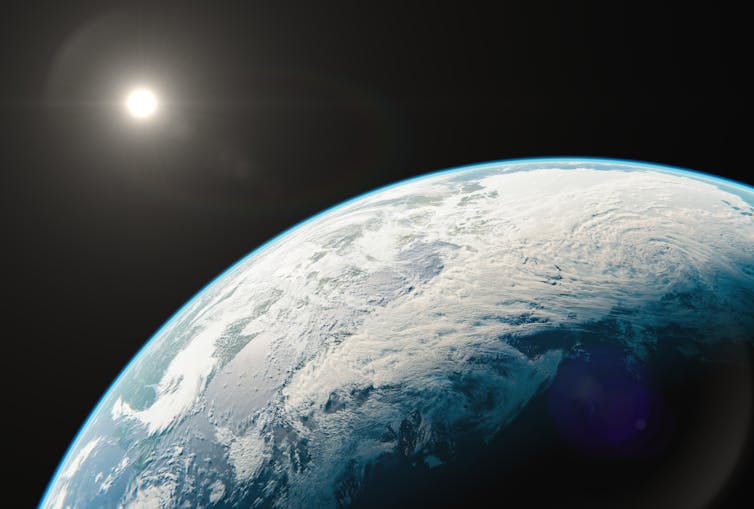
People often underestimate tiny beings. But microscopic algal cells not only evolved to thrive in one of the most extreme habitats on Earth – glaciers – but are also shaping them.
With a team of scientists from the UK and Canada, we traced the evolution of purple algae back hundreds of millions of years and our findings challenge a key idea about how evolution works. Though small, these algae are having a dramatic effect on the glaciers they live on.
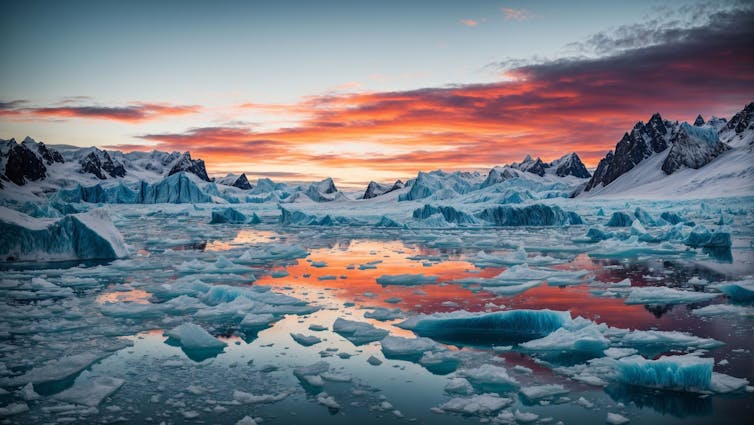
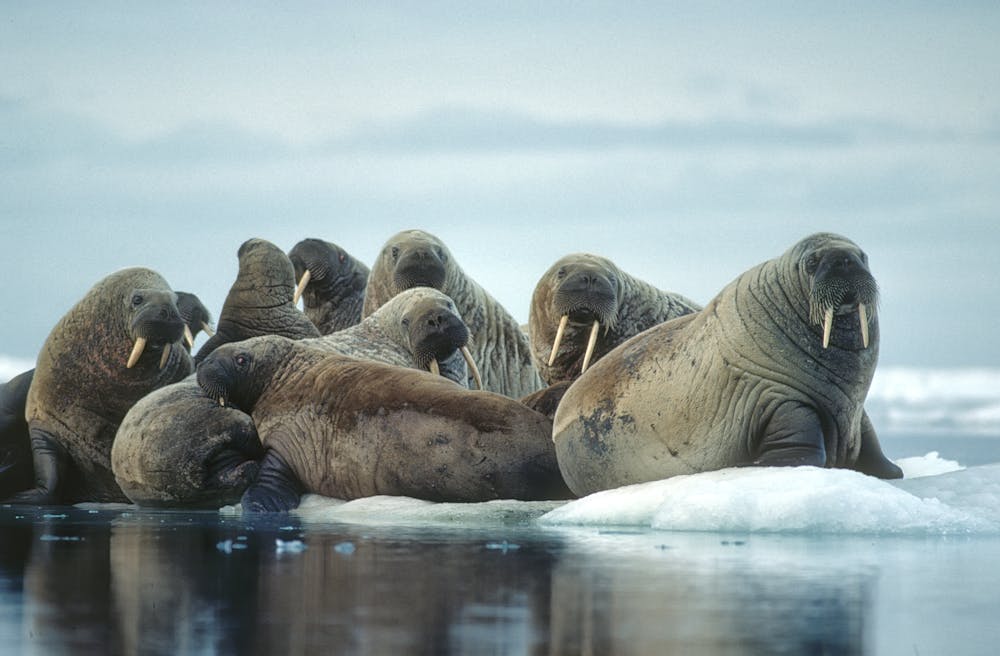
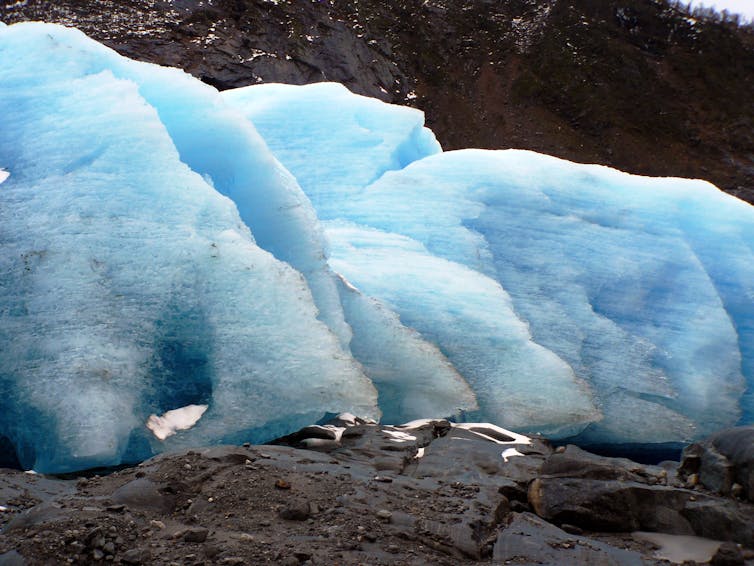
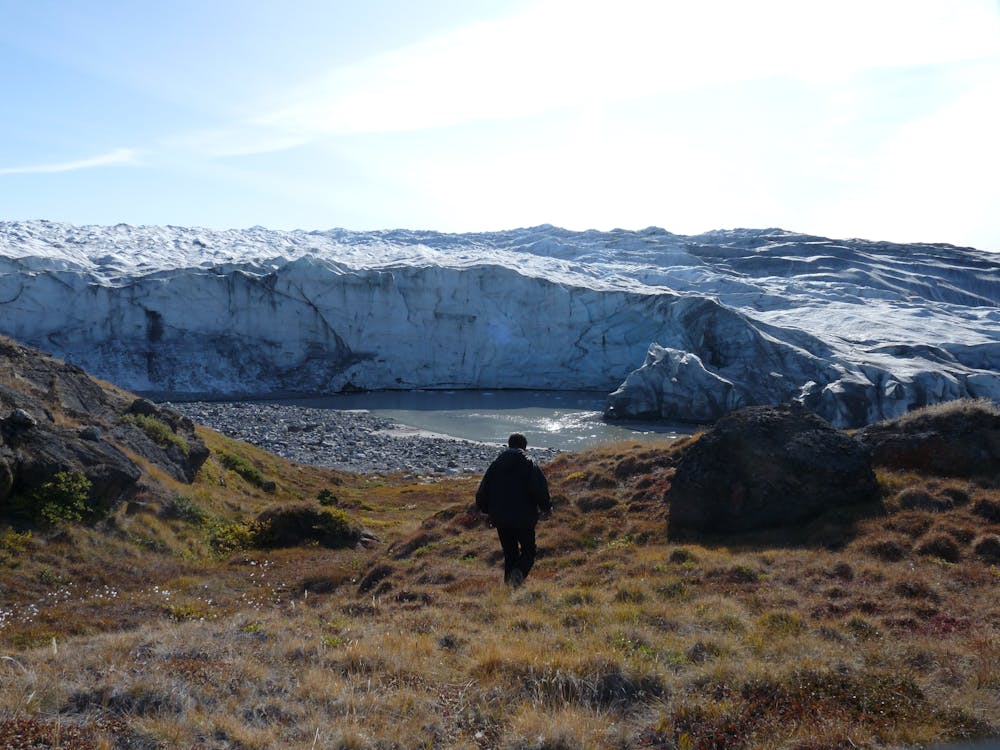
Glaciers are among the planet’s fastest changing ecosystems. During the summer melt season as liquid water forms on glaciers, blooms of purple algae darken the surface of the ice, accelerating the rate of melt. This fascinating adaptation to glaciers requires microscopic algae to control their growth and photosynthesis. This must be balanced with tolerance of extreme ice melt, temperature and light exposure.
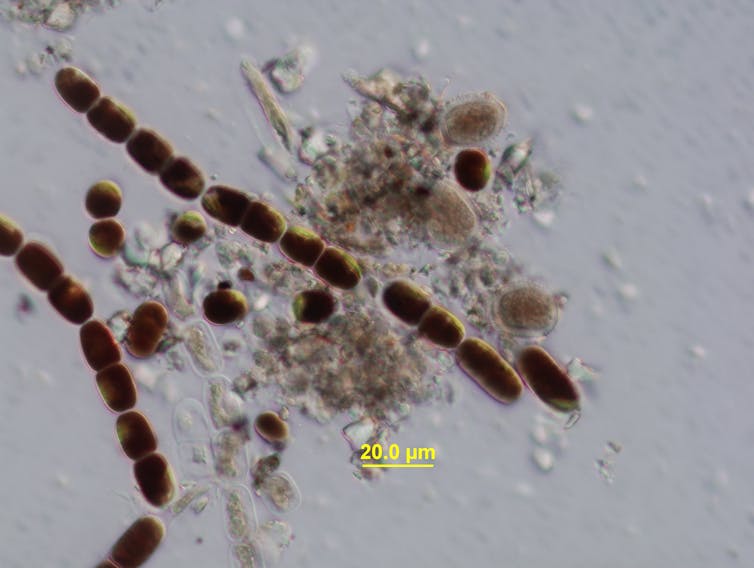
Our study, published in New Phytologist, reveals how and when their adaptations to live in these extreme environments first evolved. We sequenced and analysed genome data of the glacier algae Ancylonema nordenskiöldii. Our results show that the purple colour of glacier algae, which acts like a sunscreen, was generated by new genes involved in pigment production.
This pigment, purpurogallin, protects algal cells from damage of ultraviolet (UV) and visible light. It is also linked with tolerance of low temperatures and desiccation, characteristic features of glacial environments. Our genetic analysis suggests that the evolution of this purple pigment was probably vital for several adaptations in glacier algae.
We also identified new genes that helped increase the algae’s tolerance to UV and visible light, important adaptations for living in a bright, exposed environment. Interestingly these were linked to increased light perception as well as improved mechanisms of repair to sun damage. This work reveals how algae are adapted to live on glaciers in the present day.
Next, we wanted to understand when this adaptation evolved in Earth’s deep history.
The evolution of glacier algae
Earth has experienced many fluctuations of colder and warmer climates. Across thousands and sometimes millions of years, global climates have changed slowly between glacial (cold) to interglacial (warm) periods.
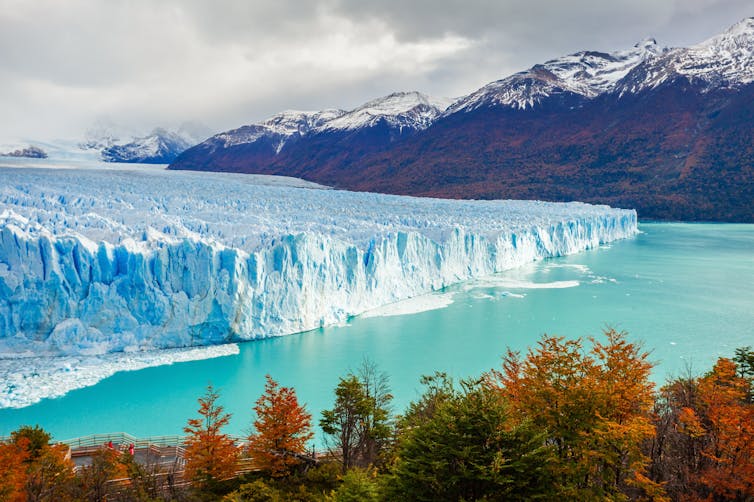
One of the most dramatic cold periods was the Cryogenian, dating back to 720-635 million years ago, when Earth was almost entirely covered in snow and ice. So widespread were these glaciations, they are sometimes referred to by scientists as “Snowball Earth”.
Scientists think that these conditions would have been similar to the glaciers and ice sheets we see on Earth today. So we wondered could this period be the force driving the evolution of glacier algae?
After analysing genetic data and fossilised algae, we estimated that glacier algae evolved around 520-455 million years ago. This suggests that the evolution of glacier algae was not linked to the Snowball Earth environments of the Cryogenian.
As the origin of glacier algae is later than the Cryogenian, a more recent glacial period must have been the driver of glacial adaptations in algae. Scientists think there has continuously been glacial environments on Earth up to 60 million years ago.
We did, however, identify that the common ancestor of glacier algae and land plants evolved around the Cryogenian.
In February 2024, our previous analysis demonstrated that this ancient algae was multicellular. The group containing glacier algae lost the ability to create complex multicellular forms, possibly in response to the extreme environmental pressures of the Cryogenian.
Rather than becoming more complex, we have demonstrated that these algae became simple and persevered to the present day. This is an example of evolution by reducing complexity. It also contradicts the well-established “march of progress” hypothesis, the idea that organisms evolve into increasingly complex versions of their ancestors.
Our work showed that this loss of multicellularity was accompanied by a huge loss of genetic diversity. These lost genes were mainly linked to multicellular development. This is a signature of the evolution of their simple morphology from a more complex ancestor.
Over the last 700 million years, these algae have survived by being tiny, insulated from cold and protected from the Sun. These adaptations prepared them for life on glaciers in the present day.
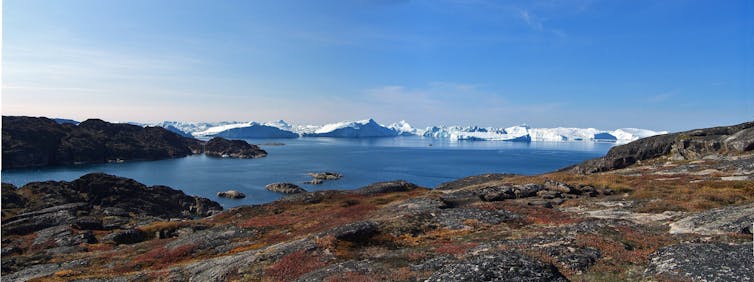
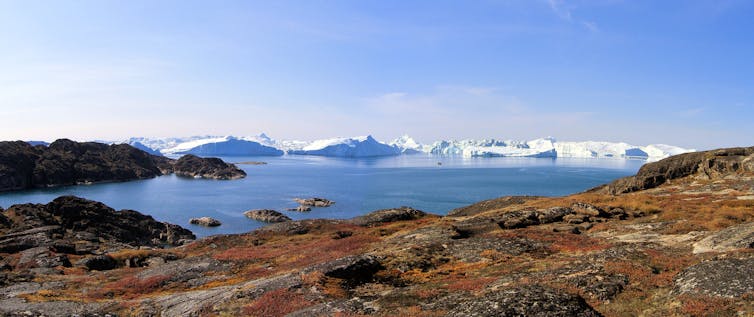
So specialised is this adaptation, that only a handful of algae have evolved to live on glaciers. This is in contrast to the hundreds of algal species living on snow. Despite this, glacier algae have dramatic effects across vast ice fields when liquid water forms on glacier surfaces. In 2016, on the Greenland ice sheet, algal growth led to an additional 4,400–6,000 million tonnes of runoff.
Understanding these algae helps us appreciate their role in shaping fragile ecosystems.
Our study gives insight into the evolutionary journey of glacier algae from the deep past to the present. As we face a changing climate, understanding these microscopic organisms is key to predicting the future of Earth’s icy environments.![]()
————————–
This blog is written by Dr Alexander Bowles, Postdoctoral research associate, University of Bristol
This article is republished from The Conversation under a Creative Commons license. Read the original article.


