Hidden in even the clearest waters of the ocean are clues to what’s happening to the seas and the climate on a global scale. Trace amounts of various chemical elements are found throughout the seas and can reveal what’s going on with the biological reactions and physical processes that take place in them.
Researchers have been working for years to understand exactly what these trace elements can tell us about the ocean. This includes how microscopic algae capture carbon from the atmosphere via photosynthesis in a way that produces food for much marine life, and how this carbon sequestration and biological production are changing in response to climate change.
But now scientists have proposed that they may also be able to learn how these systems were affected by climate change long ago by digging deep into the seabed to find the sedimentary record of past trace elements. And understanding the past could be key to working out what will happen in the future.
Trace elements can teach us an amazing amount about the oceans. For example, ocean zinc concentrations strikingly resemble the physical properties of deep waters that move huge quantities of heat and nutrients around the planet via the “ocean conveyor belt”. This remarkable link between zinc and ocean circulation is only just beginning to be understood through high-resolution observations and modelling studies.
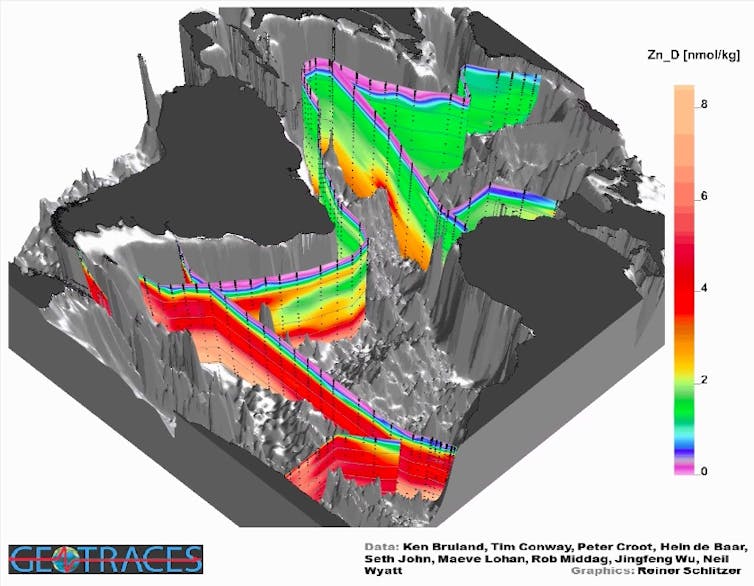
Reiner Schlitzer, data from eGEOTRACES., Author provided
Some trace elements, such as iron, are essential to life, and others, such as barium and neodymium, reveal important information about the biological productivity of algae. Different isotopes of these elements (variants with different atomic masses) can shed light on the types and rates of chemical and biological reactions going on.
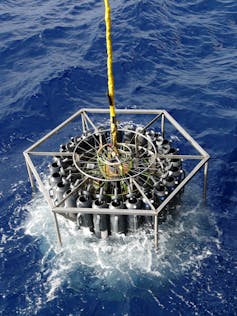
Many of these elements are only found in vanishingly small amounts. But over the last few years, an ambitious international project called GEOTRACES has been using cutting-edge technological and analytical methods to sample and analyse trace elements and understand the chemistry of the modern ocean in unprecedented detail. This is providing us with the most complete picture to date of how nutrients and carbon move around the oceans and how they impact biological production.
Carbon factories
Biological production is a tangled web of different processes and cycles. Primary production is the amount of carbon converted into organic matter by algae. Net export production refers to the small fraction of this carbon bound up in organic matter that doesn’t end up being used by the microbes as food and sinks into the deep. An even smaller portion of this carbon will eventually be stored in sediment on the ocean floor.
As well as carbon, these algae capture and store a variety of trace elements in their organic matter. So by using all the chemical information available to us, we can get a complete view of how the algae grow, sink and become buried within the oceans. And by looking at how different metals and isotopes are integrated into ancient layers of sedimentary rock, we can reconstruct these changes through time.
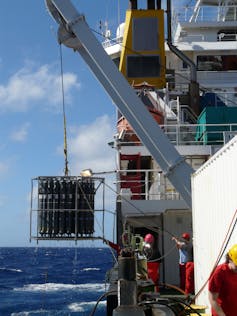
Micha Rijkenberg, Author provided
This means we can use these sedimentary archives as proxy records of nutrient use and net primary production, or export production, or sinking rates. This should enable us to start answering some of the mysteries of how oceans are affected by climate change, not only in relatively recent Earth history but also in deep time.
For example, as well as enlightening us on active processes within the modern ocean, scientists have analysed what zinc isotopes are in seabed fossils from tens of thousands of years ago, and even in ancient rocks from over half a billion years ago. The hope is that they can use this information to reconstruct a picture of how marine nutrients have changes throughout geological history.
But this work comes with a note of caution. We need to bring our knowledge about modern biogeochemistry together with our understanding of how rocks form and geochemical signals are preserved. This will enable us to be sure that we can make robust interpretations of the proxy records of the prehistoric seabeds.
Micha Rijkenberg, Author provided
How do we go about doing this? In December 2018, scientists from GEOTRACES met with members of another research project, PAGES, who are experts in reconstructing how the Earth has responded to past climate change. One approach we developed is to essentially work backwards.
First we need to ask: what archives (shells, sediment grains, organic matter) are preserved in marine sediments? Then, which of the useful metal and isotope signatures from seawater get locked up in these archives? Can we check – using material from the surface of deep-sea sediments – whether these archives do provide useful and accurate information about oceanic conditions?
The question can also be turned around, allowing us to ask whether there new isotope systems that have yet to be investigated. We want to know if GEOTRACES uncovered interesting patterns in ocean chemistry that could be the start of new proxies. If so, we might be able to use these ocean archives to shed light on
how the uptake of carbon in marine organic matter responds to, and acts as a feedback on, climate in the future.
For example, will a warmer world with more carbon dioxide enhance the growth of algae, which could then absorb more of this excess CO₂ and help to act as a break on man-made carbon emissions? Or will algae productivity decline, trapping less organic matter and spurring on further atmospheric warming into the future? The secrets could all be in the seabed.
————————–
This blog is written by Cabot Institute member Katharine Hendry, Reader in Geochemistry, University of Bristol and Allyson Tessin, Visiting research fellows, University of Leeds. This article is republished from The Conversation under a Creative Commons license. Read the original article.