Humanity is compressing millions of years of natural change into just a few centuries

The near future may be similar to the mid-Pliocene warm period a few million years ago.
Daniel Eskridge / shutterstock

Many numbers are swirling around the climate negotiations at the UN climate summit in Glasgow, COP26. These include global warming targets of 1.5℃ and 2.0℃, recent warming of 1.1℃, remaining CO₂ budget of 400 billion tonnes, or current atmospheric CO₂ of 415 parts per million.

It’s often hard to grasp the significance of these numbers. But the study of ancient climates can give us an appreciation of their scale compared to what has occurred naturally in the past. Our knowledge of ancient climate change also allows scientists to calibrate their models and therefore improve predictions of what the future may hold.

Recent climate changes in context.
IPCC AR6, chapter 2

Recent work, summarised in the latest report of the Intergovernmental Panel on Climate Change (IPCC), has allowed scientists to refine their understanding and measurement of past climate changes. These changes are recorded in rocky outcrops, sediments from the ocean floor and lakes, in polar ice sheets, and in other shorter-term archives such as tree rings and corals. As scientists discover more of these archives and get better at using them, we have become increasingly able to compare recent and future climate change with what has happened in the past, and to provide important context to the numbers involved in climate negotiations.

For instance one headline finding in the IPCC report was that global temperature (currently 1.1℃ above a pre-industrial baseline) is higher than at any time in at least the past 120,000 or so years. That’s because the last warm period between ice ages peaked about 125,000 years ago – in contrast to today, warmth at that time was driven not by CO₂, but by changes in Earth’s orbit and spin axis. Another finding regards the rate of current warming, which is faster than at any time in the past 2,000 years – and probably much longer.

But it is not only past temperature that can be reconstructed from the geological record. For instance, tiny gas bubbles trapped in Antarctic ice can record atmospheric CO₂ concentrations back to 800,000 years ago. Beyond that, scientists can turn to microscopic fossils preserved in seabed sediments. These properties (such as the types of elements that make up the fossil shells) are related to how much CO₂ was in the ocean when the fossilised organisms were alive, which itself is related to how much was in the atmosphere. As we get better at using these “proxies” for atmospheric CO₂, recent work has shown that the current atmospheric CO₂ concentration of around 415 parts per million (compared to 280 ppm prior to industrialisation in the early 1800s), is greater than at any time in at least the past 2 million years.

chart showing climate changes over history
An IPCC graphic showing climate changes at various points since 56 million years ago. Note most rows show changes over thousands or millions of years, while the top row (recent changes) is just a few decades.
IPCC AR6, chapter 2 (modified by Darrell Kaufman)

Other climate variables can also be compared to past changes. These include the greenhouse gases methane and nitrous oxide (now greater than at any time in at least 800,000 years), late summer Arctic sea ice area (smaller than at any time in at least the past 1,000 years), glacier retreat (unprecedented in at least 2,000 years) sea level (rising faster than at any point in at least 3,000 years), and ocean acidity (unusually acidic compared to the past 2 million years).

In addition, changes predicted by climate models can be compared to the past. For instance an “intermediate” amount of emissions will likely lead to global warming of between 2.3°C and 4.6°C by the year 2300, which is similar to the mid-Pliocene warm period of about 3.2 million years ago. Extremely high emissions would lead to warming of somewhere between 6.6°C and 14.1°C, which just overlaps with the warmest period since the demise of the dinosaurs – the “Paleocene-Eocene Thermal Maximum” kicked off by massive volcanic eruptions about 55 million years ago. As such, humanity is currently on the path to compressing millions of years of temperature change into just a couple of centuries.

Small animals in a forest
Many mammals, like these horse-ancestors ‘Eohippus’, first appeared after a sudden warm period 55 million years ago.
Daniel Eskridge / shutterstock

Distant past can held predict the near future

For the first time in an IPCC report, the latest report uses ancient time periods to refine projections of climate change. In previous IPCC reports, future projections have been produced simply by averaging results from all climate models, and using their spread as a measure of uncertainty. But for this new report, temperature and rainfall and sea level projections relied more heavily on those models that did the best job of simulating known climate changes.

Part of this process was based on each individual model’s “climate sensitivity” – the amount it warms when atmospheric CO₂ is doubled. The “correct” value (and uncertainty range) of sensitivity is known from a number of different lines of evidence, one of which comes from certain times in the ancient past when global temperature changes were driven by natural changes in CO₂, caused for example by volcanic eruptions or change in the amount of carbon removed from the atmosphere as rocks are eroded away. Combining estimates of ancient CO₂ and temperature therefore allows scientists to estimate the “correct” value of climate sensitivity, and so refine their future projections by relying more heavily on those models with more accurate climate sensitivities.

Overall, past climates show us that recent changes across all aspects of the Earth system are unprecedented in at least thousands of years. Unless emissions are reduced rapidly and dramatically, global warming will reach a level that has not been seen for millions of years. Let’s hope those attending COP26 are listening to messages from the past.

——————————

This blog is written by Cabot Institute for the Environment member Dan Lunt, Professor of Climate Science, University of Bristol and Darrell Kaufman, Professor of Earth and Environmental Sciences, Northern Arizona University

This article is republished from The Conversation under a Creative Commons license. Read the original article.

Dan Lunt


Read all blogs in our COP26 blog series:

Is Europe heading for a more drought prone future?

Parched landscape of Europe during the 2018 drought. Image credit: NASA, CC0

In 2018, Europe was hit with one of the worst droughts so far in the 21st century in terms of its extent, severity and duration. This had large-scale effects on the vegetation, both agricultural and natural. Harvest yields were substantially reduced, by up to 40% in some regions, and widescale browning of vegetation occurred.

A consortium of international researchers, including members of the Atmospheric Chemistry Research Group (ACRG) at the University of Bristol, asked the question: given the major impacts on vegetation, which plays an essential role in removing carbon dioxide (CO2) from the air, was there an observable change in the amount of carbon uptake across Europe during this event?

There are at least two ways to quantify the impact that the drought had on the terrestrial carbon sink: a bottom-up or top-down approach. Our plans and timelines to mitigate climate change rely on using these methods to predict how much of anthropogenic greenhouse gas emissions can be taken up by the natural biosphere. Currently, the terrestrial carbon sink (i.e. vegetation and soils) takes up approximately a third of manmade emissions. The oceans take up about a similar amount. But this important carbon sink is subject to variation brought about by naturally occurring variation in the climate and manmade climate change.

To investigate the impact of the drought on the European terrestrial carbon sink, modellers can predict how individual processes that contribute to the terrestrial sink would respond to the climate during that period – a bottom-up approach. For example, a study by Bastos et al. (2019) compared the estimates of net ecosystem exchange during the drought period from 11 vegetation models. Net ecosystem exchange quantifies the amount of CO2 that is either taken up or released from the ecosystem and is usually quantified as a flux of CO2 to the atmosphere. This value is negative if the ecosystem is a sink and positive if it is a source of CO2 to the atmosphere. The consensus from previous studies was that an unusually sunny spring led to early vegetation growth, which depleted soil moisture, which intensified the drought during the summer period. Although more CO2 was taken up by the biosphere in spring, in some European regions, like Central Europe, the lack of rain during the summer months meant that the soils, already depleted in water, could not maintain the vegetation, and this led to CO2 losses from the ecosystem.

At the ACRG we use measurements of gases in the atmosphere, like CO2, to improve estimates of emissions and uptake of these gases using a top-down approach called inverse modelling. Measurements are obtained from carefully calibrated instruments that are part of global networks of measurement sites like AGAGE (Advanced Global Atmospheric Gases Experiment) and ICOS (Integrated Carbon Observation System). We also require initial estimates of the fluxes, which we obtain from several sources, including vegetation models and bottom-up inventories, and a model that describes atmospheric transport of the gas (a model that describes how a pocket of air will travel in the atmosphere). Using a statistical approach, we can then improve on those initial estimates to get better agreement between the modelled and observed concentrations at the measurement sites. With this method, we have to account for all sources of a gas, both anthropogenic and natural, as the concentration that is recorded at a measurement site is the sum of all contributions from all sources.

In a recent publication by Thompson et al. (2020), we compared the CO2 flux estimates for regions in Europe over the last ten years using the ACRG modelling method, along with four other approaches. The combined estimate from these five modelling systems indicated that the temperate region of Europe (i.e. Central Europe) was a small source of CO2 during 2018. This means that when carbon losses due to plant and soil respiration are compared with the carbon uptake by photosynthesis, then a small positive amount was emitted to the atmosphere on balance. This is described by a positive net flux of 0.09 ± 0.06 PgC y-1 (mean ± SD) to the atmosphere, compared with the mean of the last 10 years of -0.08 ± 0.17 PgC y-1, which is a net sink of carbon, meaning that over the last 10 years more carbon was taken up by photosynthesis than emitted through ecosystem respiration. Northern Europe was also found to be a small source in 2018. This publication was part of a special issue on the impacts of the 2018 drought on Europe.

So what does this tell us about how carbon uptake might change in the future? A 2018 study by Samaniego et al. considered future projections from climate models under different scenarios ranging from 1°C to 3°C global temperature rise. They concluded that soil moisture droughts were set to become 40% more likely by the end of the 21st century under the current 3°C future compared with 1.5°C set out in the Paris Climate Agreement. Droughts like the previous “Lucifer” event in 2003, where as many as 35,000 people lost their lives due to the effects of the drought, are expected to become twice as likely. Failing to reduce greenhouse gas emissions so that we mitigate the global temperature rise will impact on our ability to grow food and make killer drought events more likely. Our study shows that more frequent droughts will reduce the biosphere’s ability to take up our CO2 emissions due to the impact of a warmer climate on the soil and vegetation of key natural sinks, and lead to fundamental changes in the structure and species composition of these systems into the future. Unfortunately, this will further exacerbate the effects of climate change.

Bibliography

A. Bastos, P. Ciais, P. Friedlingstein, S. Sitch, J. Pongratz, L. Fan, J. P. Wigneron, U. Weber, M. Reichstein, Z. Fu, P. Anthoni, A. Arneth, V. Haverd, A. K. Jain, E. Joetzjer, J. Knauer, S. Lienert, T. Loughran, P. C. McGuire, H. Tian, N. Viovy, S. Zaehle. Direct and seasonal legacy effects of the 2018 heat wave and drought on European ecosystem productivity. Science Advances, 2020; 6 (24): eaba2724 DOI: 10.1126/sciadv.aba2724

M. Reuter, M. Buchwitz, M. Hilker, J. Heymann, H. Bovensmann, J.P. Burrows, S. Houweling, Y.Y. Liu, R. Nassar, F. Chevallier, P. Ciais, J. Marshall, M. Reichstein. How much CO2 is taken up by the European Terrestrial Biosphere? Bulletin of the American Meteorological Society, 2017; 98 (4): 665-671 DOI: 10.1175/BAMS-D-15-00310.1

L. Samaniego, S. Thober, R. Kumar, N. Wanders, O. Rakovec, M. Pan, M. Zink, J. Sheffield, E.F. Wood, A. Marx. Anthropogenic warming exacerbates European soil moisture droughts. Nature Climate Change, 2018; 8, 421-426 DOI: 10.1038/s41558-018-0138-5

R.L. Thompson, G. Broquet, C. Gerbig, T. Kock, M. Lang, G. Monteil, S. Munassar, A. Nickless, M. Scholze, M. Ramonet, U. Karstens, E. van Schaik, Z. Wu, C. Rödenbeck. Changes in net ecosystem exchange over Europe during the 2018 drought based on atmospheric observations. Philosophical Transactions of the Royal Society B, 2020; 375 (1810): 20190512 DOI: 10.1098/rstb.2019.0512

————————————-

This blog is written by Cabot Institute member Dr Alecia Nickless, a research associate in the School of Chemistry at the University of Bristol.

The East Asian monsoon is many millions of years older than we thought

Sub-tropical rainforest in China. Image credit: UMBRELLA project

The East Asian monsoon covers much of the largest continent on Earth leading to rain in the summer in Japan, the Koreas and lots of China. Ultimately, more than 1.5 billion people depend on the water it provides for agriculture, industry and hydroelectric power.

Understanding the monsoon is essential. That is why colleagues and I recently reconstructed its behaviour throughout its 145m-year history, in order to better understand how it acts in response to changes in geography or the wider climate in the very long term, and what that might mean for the future.

Our study, published in the journal Science Advances indicates that the East Asian monsoon is much older and more varied than previously thought. Until quite recently the general consensus was that the monsoon came into being around 23m years ago, some time after the Tibetan Plateau was formed.

However, we show that it has been ever present for at least the past 145m years (except during the Late Cretaceous: the era of T. Rex), regardless of whether there was a Tibetan Plateau or how much CO₂ was in the atmosphere.

What is a monsoon?

At its most simple level a monsoon is a highly seasonal distribution in precipitation leading to a distinct “wet” and “dry” seasons – the word even derives from the Arabic “mausim”, translated as “season”.

The East Asian monsoon is a “sea breeze monsoon”, the most common type. They form because land and sea heat up at different rates, so high pressure forms over the sea and low pressure over land which results in wind blowing onshore in the summer.


It’s the world’s largest, highest plateau.
Rashevskyi Viacheslav / shutterstock

Although The Tibetan Plateau is not strictly needed to form the East Asian monsoon it can serve to enhance it. At 5km or more above sea level, the plateau simply sits much higher in the atmosphere and thus the air above it is heated much more than the same air would be at a lower elevation (consider the ground temperature in Tibet compared to the freezing air 5km above your head). As that Tibetan air is warmer than the surrounding cold air it rises and acts as a heat “pump”, sucking more air in to replace it and enhancing the monsoon circulation.

Changes over the (millions of) years

We found the intensity of the monsoon has varied significantly over the past 145m years. At first, it was around 30% weaker than today. Then, during the Late Cretaceous 100-66m years ago, a huge inland sea covered much of North America and weakened the Pacific trade winds. This caused East Asia to become very arid due to the monsoon disappearing.

However, rainfall patterns changed substantially after the Indian tectonic plate collided into the Asian continent around 50m years ago, forming the Himalayas and the Tibetan Plateau. As the land rose up, so did the strength of the monsoon. Our results suggest that 5-10m years ago there were “super-monsoons” with rainfall 30% stronger than today.

But how can we be sure that such changes were caused by geography, and not elevated carbon dioxide concentrations? To test this, we again modelled the climate for all different time periods (roughly every 4m years) and increased or reduced the amount of CO₂ in the atmosphere to see what effect this had on the monsoon. In general, irrespective of time period chosen, the monsoon showed little sensitivity (-1% to +13%) to changes in CO₂ compared to the impact of changes in regional geography.

Climate models are working

The monsoon in East Asia is mainly a result of its favourable geographic position and regional topography – though our work shows that CO₂ concentrations do have an impact, they are secondary to tectonics.

The past can help us better understand how the monsoon will behave as the climate changes – but its not a perfect analogue. Although rainfall increased almost every time CO₂ doubled in the past, each of these periods was unique and dependent on the specific geography at the time.

The reassuring thing is that climate models are showing agreement with geological data through the past. That means we have greater confidence that climate models are able to accurately predict how the monsoon will respond over the next century as humans continue to emit more CO₂ into the atmosphere.The Conversation

—————————–
This blog was written by Cabot Institute member Dr Alex Farnsworth, Postdoctoral Research Associate in meteorology at the University of Bristol. This article is republished from The Conversation under a Creative Commons license. Read the original article.

Alex Farnsworth

An insight into aviation emissions and their impact on the atmosphere

Image credit: El Ronzo, Flickr

The proliferation of aviation has brought about huge benefits to our society, enhancing global economic prosperity and allowing humanity to travel faster, further and more frequently than ever before. However, the relentless expansion of the industry is a major detriment to the environment on a local, regional and global level. This is due to the vast amounts of pollution produced from the jet fuel combustion process, that is required to propel aircraft through the air and to sustain steady level flight.

Aircraft impact the climate largely through the release of CO2, which results in a direct contribution to the greenhouse effect, absorbing terrestrial radiation and trapping heat within the atmosphere, leading to rising temperatures. However, it is also vital not to overlook the non-CO2 aircraft emissions such as NOx, soot and water vapour, which result in alternative climate change mechanisms – the indirect greenhouse effect, the direct aerosol effect and aviation induced cloudiness. When accounting for these non-CO2 effects, it can be assumed that the climate impact is doubled or tripled compared to that of CO2 alone.

This report provides the necessary background information to grasp the science behind aircraft emissions and delves into the impacts aviation has on the atmosphere’s ability to cleanse itself of harmful emissions, otherwise known as the oxidising capacity of the atmosphere. It does so through an analysis of three distinct and commonly flown flight routes, investigating the impact that each flight’s emissions have on the surrounding atmospheric chemistry and discusses the potential effects this has on our Earth-atmosphere system.

Read the full report by Kieran Tait

——————————
Read our other blogs about air travel:

  1. To fly or not to fly? Towards a University of Bristol approach
  2. I won’t fly to your conference, but I hope you will still invite me to participate
Watch our latest video on air travel at the University of Bristol.

Turning knowledge of past climate change into action for the future

Arctic sea ice: Image credit NASA

It’s more helpful to talk about the things we can do, than
the problems we have caused.

Beth Shapiro,
a molecular biologist and author of How To Clone A Mammoth, gave a hopeful
response to an audience question about the recent UN report stating that one
million species are threatened with extinction.

I arrived at the International Union for Quaternary Research (INQUA) 2019
conference, held in Dublin at the end of July, keen to learn exactly that: what
climate scientists can do to mitigate the impact of our rapidly changing
climate. INQUA brings together earth, atmosphere and ocean scientists studying
the Quaternary, a period from 2.6 million years ago to the present day. The
Quaternary has seen repeated and abrupt periods of climate change, making it
the perfect analogue for our rapidly changing future.
In the case of extinctions, if we understand how species
responded to human and environmental pressures in the past, we may be better
equipped to protect them in the present day.

Protecting plants and polar bears

Heikki
Seppä
from the University of Finland and colleagues are using the fossil
record to better understand how polar bears adapt to climate change. The Arctic
bears survived the Holocene thermal maximum, between 10,000 and 6,000 years
ago, when temperatures were about 2.5°C warmer than today. Although rising
temperatures and melting sea ice drove them out of Scandinavia, fossil evidence
suggests they probably found a cold refuge around northwest Greenland. This is
an encouraging indicator that polar bears could survive the 1.5°C
warming projected by the IPCC to occur sometime
between 2030 and 2052
, if it continues to increase at the current rate.
Protecting animal species means preserving habitat, so it’s
just as important to study the effects of climate change on plants. Charlotte
Clarke
from the University of Southampton studies the diversity of plants
during times of abrupt climate change, using Russian lake records. Her results
show that although two thirds of Arctic plant species survived the same warm
period which forced the bears to leave Scandinavia, they too were forced to
migrate, probably moving upslope to colder areas.


If we understand how ecosystems respond to climate change,
we will be better prepared to protect them in the future. But what will future
climate change look like? Again, we can learn a lot by studying the past.

The past is the key to the future

To understand the impact of anthropogenic CO2
emissions on the climate, we must disentangle the effect of CO2 from
other factors, such as insolation (radiation from the Sun reaching the Earth’s
surface). This is the mission of Qiuzhen Yin from UC
Louvain, Belgium, who is studying the relative impact of CO2
on climate during five past warm interglacials
. Tim Shaw, from
Nanyang Technological University in Singapore, presented work on the mechanisms driving
past sea level change
. And Vachel
Carter
from the University of Utah is using charcoal as an analogue for
past fire activity
in the Rocky Mountains. By studying the pattern of fire
activity during past warm periods, we can determine which areas are most at
risk in the future.

The 2018 fire season in Colorado was one of the worst on record.

So Quaternary scientists have a lot to tell us about what
our rapidly changing planet might look like in the years to come. But how can
we translate this information into practical action? ‘Science as a human
endeavour necessarily encompasses a moral dimension’, says George Stone from Milwaukee
Area Technical College, USA. Stone’s passionate call to action is part of a
series of talks about how Quaternary climate research can be applied to
societal issues in the 21st Century.

One thing scientists can do is try to engage with
policymakers. Geoffrey
Boulton
of the International Science Council
is hopeful that by partnering with INQUA and setting up collaborations with
Quaternary scientists, it can help them do that. The International Science
Council has a history of helping to integrate science into major global climate
policy such as the Paris
Agreement
.

What can we do ourselves as scientists is to portray
scientific results in a way that is visually appealing and easy to understand,
so they are accessible to the public and to policymakers. Oliver Wilson and
colleagues from the University of Reading are a prime example, as they brought
along 3D printed giant pollen grains which they use for outreach and teaching
as part of the 3D
Pollen Project
.


Given that it’s easier than ever to publicise your own results,
through channels such as blogs and social media, hopefully a new generation of
Quaternary scientists will leave inspired to engage in outreach and use their
knowledge to make a difference.

—————————–
This blog is written by Cabot Institute member Jen
Saxby
, a PhD student in the School
of Earth Sciences
at the University of Bristol.

Jen Saxby


Why we’re looking for chemicals in the seabed to help predict climate change

File 20190128 108370 ansjbe.jpg?ixlib=rb 1.1
Alex Fox, Author provided

Hidden in even the clearest waters of the ocean are clues to what’s happening to the seas and the climate on a global scale. Trace amounts of various chemical elements are found throughout the seas and can reveal what’s going on with the biological reactions and physical processes that take place in them.

Researchers have been working for years to understand exactly what these trace elements can tell us about the ocean. This includes how microscopic algae capture carbon from the atmosphere via photosynthesis in a way that produces food for much marine life, and how this carbon sequestration and biological production are changing in response to climate change.

But now scientists have proposed that they may also be able to learn how these systems were affected by climate change long ago by digging deep into the seabed to find the sedimentary record of past trace elements. And understanding the past could be key to working out what will happen in the future.

Trace elements can teach us an amazing amount about the oceans. For example, ocean zinc concentrations strikingly resemble the physical properties of deep waters that move huge quantities of heat and nutrients around the planet via the “ocean conveyor belt”. This remarkable link between zinc and ocean circulation is only just beginning to be understood through high-resolution observations and modelling studies.

Dissolved zinc concentrations in the oceans.
Reiner Schlitzer, data from eGEOTRACES., Author provided

Some trace elements, such as iron, are essential to life, and others, such as barium and neodymium, reveal important information about the biological productivity of algae. Different isotopes of these elements (variants with different atomic masses) can shed light on the types and rates of chemical and biological reactions going on.

Many of these elements are only found in vanishingly small amounts. But over the last few years, an ambitious international project called GEOTRACES has been using cutting-edge technological and analytical methods to sample and analyse trace elements and understand the chemistry of the modern ocean in unprecedented detail. This is providing us with the most complete picture to date of how nutrients and carbon move around the oceans and how they impact biological production.

Carbon factories

Biological production is a tangled web of different processes and cycles. Primary production is the amount of carbon converted into organic matter by algae. Net export production refers to the small fraction of this carbon bound up in organic matter that doesn’t end up being used by the microbes as food and sinks into the deep. An even smaller portion of this carbon will eventually be stored in sediment on the ocean floor.

As well as carbon, these algae capture and store a variety of trace elements in their organic matter. So by using all the chemical information available to us, we can get a complete view of how the algae grow, sink and become buried within the oceans. And by looking at how different metals and isotopes are integrated into ancient layers of sedimentary rock, we can reconstruct these changes through time.

Sampling the seabed.
Micha Rijkenberg, Author provided

This means we can use these sedimentary archives as proxy records of nutrient use and net primary production, or export production, or sinking rates. This should enable us to start answering some of the mysteries of how oceans are affected by climate change, not only in relatively recent Earth history but also in deep time.

For example, as well as enlightening us on active processes within the modern ocean, scientists have analysed what zinc isotopes are in seabed fossils from tens of thousands of years ago, and even in ancient rocks from over half a billion years ago. The hope is that they can use this information to reconstruct a picture of how marine nutrients have changes throughout geological history.

But this work comes with a note of caution. We need to bring our knowledge about modern biogeochemistry together with our understanding of how rocks form and geochemical signals are preserved. This will enable us to be sure that we can make robust interpretations of the proxy records of the prehistoric seabeds.

Collecting the samples.
Micha Rijkenberg, Author provided

How do we go about doing this? In December 2018, scientists from GEOTRACES met with members of another research project, PAGES, who are experts in reconstructing how the Earth has responded to past climate change. One approach we developed is to essentially work backwards.

First we need to ask: what archives (shells, sediment grains, organic matter) are preserved in marine sediments? Then, which of the useful metal and isotope signatures from seawater get locked up in these archives? Can we check – using material from the surface of deep-sea sediments – whether these archives do provide useful and accurate information about oceanic conditions?

The question can also be turned around, allowing us to ask whether there new isotope systems that have yet to be investigated. We want to know if GEOTRACES uncovered interesting patterns in ocean chemistry that could be the start of new proxies. If so, we might be able to use these ocean archives to shed light on
how the uptake of carbon in marine organic matter responds to, and acts as a feedback on, climate in the future.

For example, will a warmer world with more carbon dioxide enhance the growth of algae, which could then absorb more of this excess CO₂ and help to act as a break on man-made carbon emissions? Or will algae productivity decline, trapping less organic matter and spurring on further atmospheric warming into the future? The secrets could all be in the seabed.

————————–
This blog is written by Cabot Institute member Katharine Hendry, Reader in Geochemistry, University of Bristol and Allyson Tessin, Visiting research fellows, University of Leeds.  This article is republished from The Conversation under a Creative Commons license. Read the original article.

The new carbon economy – transforming waste into a resource

As part of Green Great Britain Week, supported by BEIS, we are posting a series of blogs throughout the week highlighting what work is going on at the University of Bristol’s Cabot Institute for the Environment to help provide up to date climate science, technology and solutions for government and industry.  We will also be highlighting some of the big sustainability actions happening across the University and local community in order to do our part to mitigate the negative effects of global warming. Today our blog will look at ‘Technologies of the future: clean growth and innovation’.

On Monday 8 October 2018, the IPCC released a special report which calls upon world governments to enact policies which will limit global warming to 1.5°C compared with pre-industrial levels, failure to do so will drastically increase the probability of ecosystem collapses, extreme weather events and complete melting of Arctic sea ice. Success will require “rapid and far-reaching” actions in the way we live, move, produce and consume.

So, what comes to mind when you hear carbon dioxide – a greenhouse gas? A waste product? You’re not wrong to think that given the predicament that our planet faces, but this article is going to tell the other side of the story which you already know but is often forgotten.

For over a billion years, carbon dioxide has been trapped and transformed, almost miraculously, into an innumerable, rich and complex family of organic molecules and materials by photosynthetic organisms. Without this process, life as we know simply would not have evolved. Look around you, – I dare say that the story of carbon dioxide is weaved, one way or another into all the objects you see around you in this moment. Whether it’s the carbon atoms within the material itself – or that old fossilised sourced of carbon was used to smelt, melt or fabricate it.

The great growth and development of the last two centuries has been defined by humanity’s use of fossilised carbon which drove the first and second industrial revolutions. But now – the limitations of those very revolutions are staring us in the face and a new revolution is already underway, albeit it quietly.

An industrial revolution is said to occur when there is a step change in three forms of technology, Information, Transport and Energy. The step change that I will discuss here is the use of carbon dioxide coupled with renewable energy systems to deliver a circular carbon economy that aims to be sustainable, carbon neutral at worst and carbon negative at best. This burgeoning field comes under the name carbon capture and utilisation (CCU). CCU, represents a broad range of chemical processes that will most directly impact energy storage and generation and the production of chemical commodities including plastics and building aggregates such as limestone.

In our research we are developing catalysts made of metal nanoparticles to activate and react CO2 to form chemicals such as carbon monoxide (CO), formic acid, methanol and acetate. They be simple molecules – but they have significant industrial relevance, are made on vast scales, are energy intensive to produce, and all originate in some way from coal. The methods that we are investigating while being more technically challenging, consume just three inputs – CO2, water and an electrical current. We use a device called an electrolyser, it uses electricity to break chemical bonds and form new ones. The catalyst sits on the electrodes. At the anode, water is broken into positively charged hydrogen ions called protons and oxygen, while at the opposite electrode, the cathode, CO2 reacts with the protons, H+, to form new molecules. It sounds simple but encouraging CO2 to react is not easy, compared to most molecules, CO2 is a stubborn reactant. It needs the right environment and some energy such as heat, electricity or light to activate it to form products of higher energy content. The chemicals that can be produced by this process are industrially significant, they are used in chemical synthesis, as solvents, reactants and many other things. CO for example can be built up to form cleaner burning petroleum/diesel-like fuels, oils, lubricants and other products derived by the petrochemical industry.

Formic acid and methanol may be used to generate energy, they can be oxidised back to CO2 and H2O using a device called a fuel cell to deliver electricity efficiently without combustion. One day we could see electrically driven cars not powered by batteries or compressed hydrogen but by methanol which has a higher volumetric energy density than both batteries and hydrogen. Batteries are heavy, too short-lived and use high quantities of low abundance metals such as lithium and cobalt – meaning their supply chains could suffer critical issues in the future. While the compression of hydrogen is an energy intensive process which poses greater safety challenges.

However, there are still many hurdles to overcome. I recently went to the Joint European Summer School on Fuel Cell, Electrolyser and Battery Technologies. There I learned about the technical and economic challenges from an academic and industrial perspective. In an introductory lecture, Jens Oluf Jensen was asked “When will we run out of fossil fuels?”, his answer “Not soon enough!”. An obvious answer but there is something I wish to unpick. The task for scientists is not just to make technologies like CO2 capture, CO2 conversion and fuel cells practical – which I would argue is already the case for some renewable technological processes. The greatest challenge is to make them cost competitive with their oil-based equivalents. A gamechanger in this field will be the day that politicians enact policies which incorporate the cost to the environment in the price of energy and materials derived from fossil fuels, and even go so far as to subsidise the cost of energy and materials-based on their ability to avoid or trap carbon dioxide.

Even without such political input there is still hope as we’ve seen the cost of solar and wind drop dramatically, lower than some fossil fuel-based power sources and only with limited government support. Already there are companies springing up in the CCU sector. Companies like Climeworks and Carbon Engineering are demonstrating technology that can trap CO2 using a process known as Direct Air Capture (DAC). Carbon Engineering is going even further and developing a technology they call Air to Fuels™. They use CO2 from the air, hydrogen split from water and clean electricity to generate synthetic transportation fuels such as gasoline, diesel or jet fuel. You may question why we should need these fuels given the rise of battery powered vehicles but a better solution for fuelling heavy goods vehicles, cargo ships and long-haul flights is at the very least a decade way.

In 1975, Primo Levi wrote a story about a carbon dioxide molecule and he said in relation to photosynthesis “dear colleagues, when we learn to do likewise we will be sicut Deus [like God], and we will have also solved the problem of hunger in the world.”. The circular carbon economy may still be in its infancy, but the seeds have sprouted. Unlike the first and second industrial revolution, the 3rd industrial revolution will not be dependent on one single energy source but will be a highly interdependent network of technologies that support and complement each other in the aim of sustainability, just like nature itself.

——————————————
This blog is written by Cabot Institute member Gaël Gobaille-Shaw, University of Bristol School of Chemistry. He is currently designing new electrocatalysts for the conversion of CO2 to liquid fuels.
For updates on this work, follow @CatalysisCDT @Gael_Gobaille and @UoB_Electrochem on Twitter.  Follow #GreenGB for updates on the Green Great Britain Week.

Gael Gobaille-Shaw

Read other blogs in this Green Great Britain Week series:
1. Just the tip of the iceberg: Climate research at the Bristol Glaciology Centre
2. Monitoring greenhouse gas emissions: Now more important than ever?
3. Digital future of renewable energy
4. The new carbon economy – transforming waste into a resource
5. Systems thinking: 5 ways to be a more sustainable university
6. Local students + local communities = action on the local environment


How ancient warm periods can help predict future climate change

Several more decades of increased carbon dioxide emissions could lead to melting ice sheets, mass extinctions and extreme weather becoming the norm. We can’t yet be certain of the exact impacts, but we can look to the past to predict the future.

We could start with the last time Earth experienced CO2 levels comparable to those expected in the near future, a period 56m to 34m years ago known as the Eocene.

The Eocene began as a period of extreme warmth around 10m years after the final dinosaurs died. Alligators lived in the Canadian Arctic while palm trees grew along the East Antarctic coastline. Over time, the planet gradually cooled, until the Eocene was brought to a close with the formation of a large ice sheet on Antarctica.

During the Eocene, carbon dioxide (CO2) concentrations in the atmosphere were much higher than today, with estimates usually ranging between 700 and 1,400 parts per million (ppm). As these values are similar to those anticipated by the end of this century (420 to 935ppm), scientists are increasingly using the Eocene to help predict future climate change.

We’re particularly interested in the link between carbon dioxide levels and global temperature, often referred to as “equilibrium climate sensitivity” – the temperature change that results from a doubling of atmospheric CO2, once fast climate feedbacks (such as water vapour, clouds and sea ice) have had time to act.

To investigate climate sensitivity during the Eocene we generated new estimates of CO2 throughout the period. Our study, written with colleagues from the Universities of Bristol, Cardiff and Southampton, is published in Nature.

Reconstruction of the 40m year old planktonic foraminifer Acarinina mcgowrani.
Richard Bizley (www.bizleyart.com) and Paul Pearson, Cardiff University, CC BY

As we can’t directly measure the Eocene’s carbon dioxide levels, we have to use “proxies” preserved within sedimentary rocks. Our study utilises planktonic foraminifera, tiny marine organisms which record the chemical composition of seawater in their shells. From these fossils we can figure out the acidity level of the ocean they lived in, which is in turn affected by the concentration of atmospheric CO2.

We found that CO2 levels approximately halved during the Eocene, from around 1,400ppm to roughly 770ppm, which explains most of the sea surface cooling that occurred during the period. This supports previously unsubstantiated theories that carbon dioxide was responsible for the extreme warmth of the early Eocene and that its decline was responsible for the subsequent cooling.

We then estimated global mean temperatures during the Eocene (again from proxies such as fossilised leaves or marine microfossils) and accounted for changes in vegetation, the position of the continents, and the lack of ice sheets. This yields a climate sensitivity value of 2.1°C to 4.6°C per doubling of CO2. This is similar to that predicted for our own warm future (1.5 to 4.5°C per doubling of CO2).
Our work reinforces previous findings which looked at sensitivity in more recent time intervals. It also gives us confidence that our Eocene-like future is well mapped out by current climate models.

Fossil foraminifera from Tanzania – their intricate shells capture details of the ocean 33-50m years ago.
Paul Pearson, Cardiff University, CC BY

Rich Pancost, a paleoclimate expert and co-author on both studies, explains: “Most importantly, the collective research into Earth history reveals that the climate can and has changed. And consequently, there is little doubt from our history that transforming fossil carbon underground into carbon dioxide in the air – as we are doing today – will significantly affect the climate we experience for the foreseeable future.”

Our work also has implications for other elements of the climate system. Specifically, what is the impact of higher CO2 and a warmer climate upon the water cycle? A recent study investigating environmental change during the early Eocene – the warmest interval of the past 65m years – found an increase in global precipitation and evaporation rates and an increase in heat transport from the equator to the poles. The latter is consistent with leaf fossil evidence from the Arctic which suggests that high precipitation rates were common.

However, changes in the water cycle are likely to vary between regions. For example, low to mid latitudes likely became drier overall, but with more intense, seasonal rainfall events. Although very few studies have investigated the water cycle of the Eocene, understanding how this operates during past warm climates could provide insights into the mechanisms which will govern future changes.
The Conversation
———————–
This blog was written by Cabot Institute member Gordon Inglis, Postdoctoral Research Associate in Organic Geochemistry, University of Bristol and Eleni Anagnostou, Postdoctoral Research Fellow, Ocean and Earth Science, University of Southampton

This article was originally published on The Conversation. Read the original article.

Ancient ‘dead seas’ offer a stark warning for our own near future

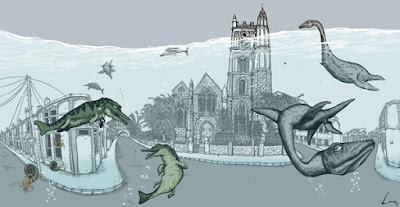
Bristol during the pleiocene as envisaged by Lucas Antics.

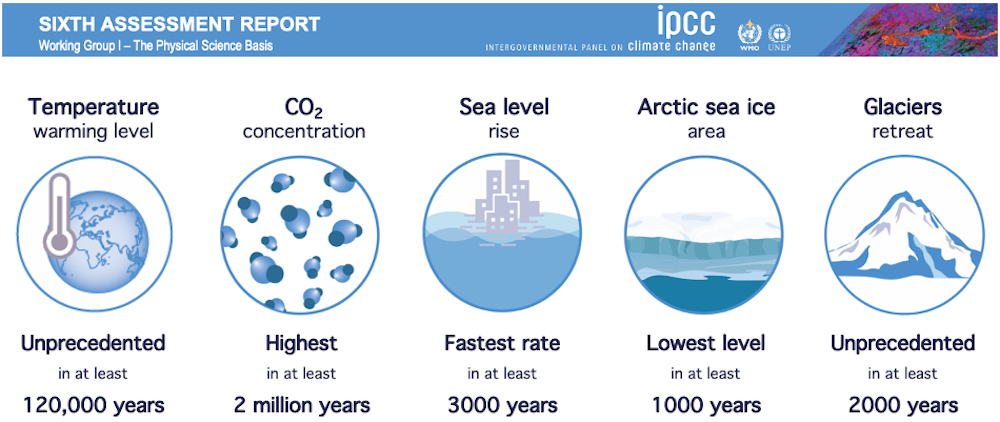
The oceans are experiencing a devastating combination of stresses. Rising CO2 levels are raising temperatures while acidifying surface waters.  More intense rainfall events, deforestation and intensive farming are causing soils and nutrients to be flushed to coastal seas. And increasingly, the oceans are being stripped of oxygen, with larger than expected dead zones being identified in an ever broadening range of settings. These dead zones appear to be primarily caused by the runoff of nutrients from our farmlands to the sea, but it is a process that could be exacerbated by climate change – as has happened in the past.

Recently, our group published a paper about the environmental conditions of the Zechstein Sea, which reached from Britain to Poland 270 million years ago. Our paper revealed that for tens of thousands of years, some parts – but only parts – of the Zechstein Sea were anoxic (devoid of oxygen). As such, it contributes to a vast body of research, spanning the past 40 years and representing the efforts of hundreds of scientists, which has collectively transformed our understanding of ancient oceans – and by extension future ones.

The types of processes that bring about anoxia are relatively well understood. Oxygen is consumed by animals and bacteria as they digest organic matter and convert it into energy. In areas where a great deal of organic matter has been produced and/or where the water circulation is stagnant such that the consumed oxygen cannot be rapidly replenished, concentrations can become very low. In severe cases, all oxygen can be consumed rendering the waters anoxic and inhospitable to animal life.  This happens today in isolated fjords and basins, like the Black Sea.  And it has happened throughout Earth history, allowing vast amounts of organic matter to escape degradation, yielding the fossil fuel deposits on which our economy is based, and changing the Earth’s climate by sequestering what had once been carbon dioxide in the atmosphere into organic carbon buried in sediments.

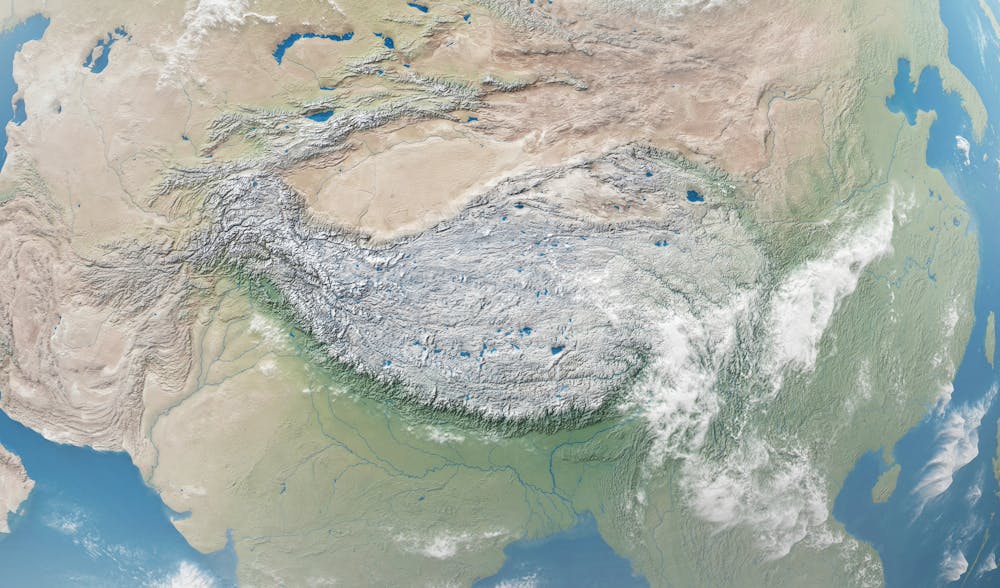
Red circles show the location and size of many dead zones. Black dots show Ocean dead zones of unknown size. Image source: Wikimedia Commons/NASA Earth Observatory

In some cases, this anoxia appears to have been widespread; for example, during several transient Cretaceous events, anoxia spanned much of what is now the Atlantic Ocean or maybe even almost all of the ancient oceans. These specific intervals were first identified and named oceanic anoxic events in landmark work by Seymour Schlanger and Hugh Jenkyns.  In the 1970s, during the earliest days of the international Deep Sea Drilling Program (now the International Ocean Discovery Program, arguably the longest-running internationally coordinated scientific endeavor), they were the first to show that organic matter-rich deep sea deposits were the same age as similar deposits in the mountains of Italy. Given the importance of these deposits for our economy and our understanding of Earth and life history, scientists have studied them persistently over the past four decades, mapping them across the planet and interrogating them with all of our geochemical and palaeontological resources.

In my own work, I have used the by-products of certain bacterial pigments to interrogate the extent of that anoxia.  The organisms are green sulfur bacteria (GSB), which require both sunlight and the chemical energy of hydrogen sulfide in order to conduct a rather exotic form of bacterial photosynthesis; crucially, hydrogen sulfide is only formed in the ocean from sulfate after the depletion of oxygen (because the latter yields much more energy when used to consume organic matter). Therefore, GSB can only live in a unique niche, where oxygen poor conditions have extended into the photic zone, the realm of light penetration at the very top of the oceans, typically only the upper 100 m.  However, GSB still must compete for light with algae that live in even shallower and oxygen-rich waters, requiring the biosynthesis of light harvesting pigments distinct from those of plants, the carotenoids isorenieratene, chlorobactene and okenone. For the organism, this is an elegant modification of a molecular template to a specific ecological need. For the geochemist, this is an astonishingly fortuitous and useful synthesis of adaptation and environment – the pigments and their degradation products can be found in ancient rocks, serving as molecular fossil evidence for the presence of these exotic and diagnostic organisms.

And these compounds are common in the black shales that formed during oceanic anoxic events.  And in particular, during the OAE that occurred 90 million years ago, OAE2, they are among the most abundant marker compounds in sediments found throughout the Atlantic Ocean and the Tethyan Ocean, what is now the Mediterranean Sea.  It appears that during some of these events anoxia extended from the seafloor almost all the way to the ocean’s surface.

********

Today, the deep sea is a dark and empty world. It is a world of animals and Bacteria and Archaea – and relatively few of those. Unlike almost every other ecosystem on our planet, it is bereft of light and therefore bereft of plants.  The animals of the deep sea are still almost entirely dependent on photosynthetic energy, but it is energy generated kilometres above in the thin photic zone. Beneath this, both animals and bacteria largely live off the scraps of organic matter energy that somehow escape the vibrant recycling of the surface world and sink to the twilight realm below. In this energy-starved world, the animals live solitary lives in emptiness, darkness and mystery. Exploring the deep sea via submersible is a humbling and quiet experience.  The seafloor rolls on and on and on, with only the occasional shell or amphipod or small fish providing any evidence for life.

“Krill swarm” by Jamie Hall – NOAA. Licensed under Public Domain via Wikimedia Commons

And yet life is there.  Vast communities of krill thrive on the slowly sinking marine snow, can appear.  Sperm whales dive deep into the ocean to consume the krill and emerge with the scars of fierce battles with giant squid.  And when one of those great creatures dies and its carcass plummets to the seafloor, within hours it is set upon by sharks and fish, ravenous and emerging from the darkness for the unexpected feast. Within days the carcass is stripped to the bones but even then new colonizing animals arrive and thrive. Relying on bacteria that slowly tap the more recalcitrant organic matter that is locked away in the whale’s bones, massive colonies of tube worms spring to life, spawn and eventually die.

But all of these animals, the fish, whales, tube worms and amphipods, depend on oxygen. And the oceans have been like this for almost all of Earth history, since the advent of multicellular life nearly a billion years ago.

This oxygen-replete ocean is an incredible contrast to the north Atlantic Ocean during at least some of these anoxic events. Then, plesiosaurs, ichthyosaurs and mosasaurs, feeding on magnificent ammonites, would have been confined to the sunlit realm, their maximum depth of descent marked by a layer of surprisingly pink and then green water, pigmented by the sulfide consuming bacteria.  And below it, not a realm of animals but a realm only of Bacteria and Archaea, single-celled organisms that can live in the absence of oxygen, a transient revival of the primeval marine ecosystems that existed for billions of years before more complex life evolved.

We have found evidence for these types of conditions during numerous events in Earth history, often associated with major extinctions, including the largest mass extinction in Earth history – the Permo-Triassic Boundary 252 million years ago.  Stripping the ocean of oxygen and perhaps even pumping toxic hydrogen sulfide gas into the atmosphere is unsurprisingly associated with devastating biological change.   It is alarming to realise that under the right conditions our own oceans could experience this same dramatic change.  Aside from its impact on marine life, it would be devastating for us, so dependent are we on the oceans for our food.

The conventional wisdom has been that such extreme anoxia in the future is unlikely, that Cretaceous anoxia was a consequence of a markedly different geography.  North America was closer to Europe and South America only completely rifted from Africa about 150 million years ago; the ancient Atlantic Ocean was smaller and more restricted, lending itself to these extreme conditions.

And yet questions remain.  What was their trigger?  Was it really a happenstance of geography?  Or was it due to environmental perturbations? And how extensive were they? The geological record preserves only snapshots, limiting the geographical window into ancient oceans, and this is a window that narrows as we push further back in time. In one of our recent papers, we could not simulate such severe anoxia in the Atlantic Ocean without also simulating anoxia throughout the world’s oceans, a truly global oceanic anoxic event.  However, that model can only constrain some aspects of ocean circulation and there are likely alternative mechanisms that confine anoxia to certain areas.

************

Over the past twenty years, these questions have intersected one another and been examined again and again via new models, new geochemical tools and new ideas.  And an emerging idea is that the geography of the Mesozoic oceans was not as important as we have thought.

That classical model is that ancient oceans, through a combination of the aforementioned restricted geography and overall high temperatures, were inherently prone to anoxia.  In an isolated Atlantic Ocean, oxygen replenishment of the deep waters would have been much slower.  This would have been exaggerated by the higher temperatures of the Cretaceous, such that oxygen solubility was lower (i.e. for a given amount of oxygen in the atmosphere, less dissolves into seawater) and ocean circulation was more sluggish. Consequently, these OAEs could have been somewhat analogous to the modern Black Sea.  The Black Sea is a restricted basin with a stratified water column, formed by low density fresh water derived from the surrounding rivers sitting stably above salty and dense marine deep water. The freshwater lid prevents mixing and prevents oxygen from penetrating into deeper waters. Concurrently, nutrients from the surrounding rivers keep algal production high, ensuring a constant supply of sinking organic matter, delicious food for microbes to consume using the last vestiges of oxygen.  The ancient oceans of OAEs were not exactly the same but perhaps similar processes were operating. Crucially, the configuration of ancient continents in which major basins were isolated from one another, suggests a parallel between the Black Sea and the ancient North Atlantic Ocean.

But over the past twenty years, that model has proved less and less satisfactory.  First, it does not provide a mechanism for the limited temporal occurrence of the OAEs.  If driven solely by the shape of our oceans and the location of our continents, why were the oceans not anoxic as the norm rather than only during these events? Second, putative OAEs, such as that at the Permo-Triassic Boundary occur at times when the oceans do not appear to have been restricted.  Third, coupled ocean-atmosphere models indicate that although ocean circulation was slower under these warmer conditions, it did not stop.

But also, as we have looked more and more closely at those small windows into the past, we have learned that during some of these events anoxia was more restricted to coastal settings.  And that brings us back to the Zechstein Sea. We mapped the extent of anoxia at an unprecedented scale in cores drilled by the Polish Geological Survey, and we discovered an increasing abundance of GSB molecular fossils in rocks extending from the carbonate platform and down the continental slope, suggesting that anoxia had extended out into the wider sea.  But when we reached the deep central part of the basin, the fossils were absent.  In fact, the sediments contained the fossils of benthic foraminifera, oxygen dependent organisms living at the seafloor, and the sediments had been bioturbated, churned by ancient animals. The green sulfur bacteria and the anoxia were confined to the edge of the basin, completely unlike the Black Sea.  This is not the first such observation and this is consistent with new arguments mandating not only a different schematic but also a different trigger.  And perhaps that trigger was from outside of the oceans.

If the trigger was not solely a restriction of oxygen supply then the alternative is that it was an excess of organic matter, the degradation of which consumed the limited oxygen. A likely source of that organic matter and one that is consistent with restriction of anoxia to ocean margins is a dramatic increase in nutrients that stimulated algal blooms – much like what is occurring today.  And that increase in nutrients, as elegantly summarized by Hugh Jenkyns, could have been caused by an increase in erosion and chemical weathering, driven by higher carbon dioxide concentrations, global warming and/or changes in the hydrological cycle, all of which we now know occurred prior to several OAEs. And again, similar to what is occurring today.

It is likely that today’s coastal dead zones are due not to climate change but to how we use our land and especially to our excess and indiscriminate use of fertilisers, most of which does not help crops grow or enhance our soil quality but is instead washed away to pollute our rivers and coastal seas. And yet that only underscores the lessons of the past.  They suggest that global warming might exacerbate the impacts of our poor land management, adding yet another pressure to an already stressed ecosystem.

Runoff of soil and fertiliser  during a rain storm. Image source: Wikimedia Commons

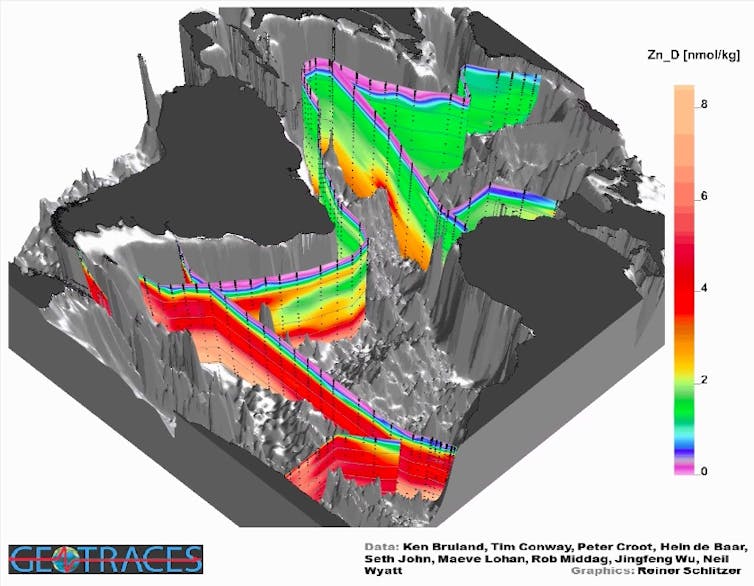
The Zechstein Sea study is not the key to this new paradigm (and that ‘paradigm’ is far from settled).  There is probably no single study that marked our change in understanding.  Instead, this new model has been gradually emerging over nearly 20 years, as long as I have been studying these events. New geochemical data, such as the distribution of nutrient elements, suggest that many of these anoxic episodes, whether local or global, were associated with algal blooms.  And other geochemical tools, such as the isotopic composition of trace metals, provide direct evidence for changes in the chemical weathering that liberated the bloom-fueling nutrients.

Science can move in monumental leaps forward but more typically it evolves in small steps. Sometimes, after years of small steps, your understanding has fundamentally changed. And sometimes that change means that your perception of the world, the world you love and on which you depend, has also changed.  You realize that it is more dynamic than you thought – as is its vulnerability to human behaviour.
——————————

This blog is by Prof Rich Pancost, Director of the Cabot Institute at the University of Bristol
A shortened version of this blog can be found on The Conversation.

Prof Rich Pancost

This blog has also appeared in IFL Science and The Ecologist.

Thoughts on passing 400 ppm

In the next few days, the Mauna Loa atmospheric CO2 record will pass 400 ppm. This isn’t the first time that’s happened – we first crossed the 400 ppm threshold in May 2013, but the annual, saw-tooth variation in levels as the Northern hemisphere boreal forest breathes in and out has dipped us below 400 a couple of times since. This crossing is likely to be special however, as it is probably going to be the last time anybody alive today will experience an atmosphere with LESS than 400 ppm CO2.

Human emissions have been pushing up atmospheric levels by about 2.2 ppm every year in recent years, so normally we would expect the annual monthly minimum to increase to beyond 400 ppm from this year’s September minimum of 397.1 ppm, however we are in the midst of one of the largest El Nino years for over a decade, and the drought in the tropics during El Nino years slow the growth of trees relative to normal years, and increases fires. Previous strong El Nino years (like 1997) have helped to push the annual CO2 increase to a massive 3.7 ppm, and this year’s strong El Nino, coupled with increased forest burning in Indonesia, along with fossil fuel burning, have led Ralph Keeling to predict the annual rise could be as much as 4.4 ppm this year.

So why does it matter? 400 is in truth a fairly arbitrary value to get excited about, a neat quirk of our counting system and no more important as a value to the atmosphere than your car odometer ticking from 99,999 to 100,000. It doesn’t mean the car is going to collapse, but it certainly catches your attention. It’s the same with the atmosphere – it gives us pause to consider what we’ve done, and what it might mean for the climate system. For me, the most outrageous thing is that we, an insignificant population of carbon based life forms, have managed to alter the chemical composition of the atmosphere! And not just by a little – by a lot! And let’s not forget that the atmosphere is big – really big!

To me, as an Earth Scientist that leads me to think about when in Earth history the planet has experienced such high levels of CO2 before. Measuring atmospheric CO2 in the geological past is tricky – for the past  ~800 thousand years we have a fantastic archive of trapped atmospheric gas bubbles in ice cores, and for the whole of that record CO2 never peaked above 300 ppm. Beyond the time for which we have the ice cores, we rely on geochemical proxies in marine and terrestrial sediments to estimate CO2 and that is the heart of my research. In a paper we published last year we showed that we have to go back to more than 2.3 Million years ago, to the very earliest Pleistocene and Pliocene to find atmospheric CO2 levels as high as we are about to permanently experience. What does that mean? Well the Pliocene was a similar world to today – the continents were in much the same place, the vegetation mix across this Earth was the same, except global temperatures were 2-3 degrees C higher than now, driven primarily by those high levels of CO2.

Another thing that strikes me today is how rapidly we’ve managed to change the atmosphere. In a little over 150 years since we started to burn fossil fuels with alacrity, we’ve gone from 280 ppm to 400 ppm. It’s hard to find geological records with the temporal precision to see changes that quick, but for sure we don’t know any time in Earth history when CO2 has changed so much, so quickly.

With COP21 in Paris just around the corner, perhaps saying goodbye to sub 400 ppm will focus minds to come up with a solution. I don’t know whether it will, or what a global solution would look like, but I hope beyond anything that we don’t do nothing.
—————–
Cabot Institute member Dr Marcus Badger is a Research Associate in the Organic Geochemistry Group in the School of Chemistry. His research involves using biomolecules and climate models to better understand the Earth system.