The East Asian monsoon is many millions of years older than we thought

Sub-tropical rainforest in China. Image credit: UMBRELLA project

The East Asian monsoon covers much of the largest continent on Earth leading to rain in the summer in Japan, the Koreas and lots of China. Ultimately, more than 1.5 billion people depend on the water it provides for agriculture, industry and hydroelectric power.

Understanding the monsoon is essential. That is why colleagues and I recently reconstructed its behaviour throughout its 145m-year history, in order to better understand how it acts in response to changes in geography or the wider climate in the very long term, and what that might mean for the future.

Our study, published in the journal Science Advances indicates that the East Asian monsoon is much older and more varied than previously thought. Until quite recently the general consensus was that the monsoon came into being around 23m years ago, some time after the Tibetan Plateau was formed.

However, we show that it has been ever present for at least the past 145m years (except during the Late Cretaceous: the era of T. Rex), regardless of whether there was a Tibetan Plateau or how much CO₂ was in the atmosphere.

What is a monsoon?

At its most simple level a monsoon is a highly seasonal distribution in precipitation leading to a distinct “wet” and “dry” seasons – the word even derives from the Arabic “mausim”, translated as “season”.

The East Asian monsoon is a “sea breeze monsoon”, the most common type. They form because land and sea heat up at different rates, so high pressure forms over the sea and low pressure over land which results in wind blowing onshore in the summer.


It’s the world’s largest, highest plateau.
Rashevskyi Viacheslav / shutterstock

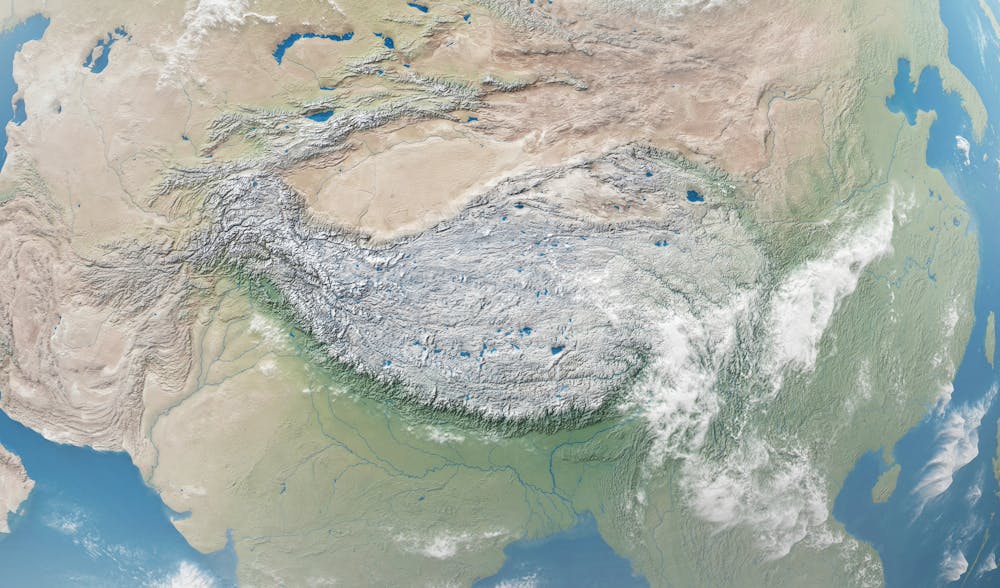
Although The Tibetan Plateau is not strictly needed to form the East Asian monsoon it can serve to enhance it. At 5km or more above sea level, the plateau simply sits much higher in the atmosphere and thus the air above it is heated much more than the same air would be at a lower elevation (consider the ground temperature in Tibet compared to the freezing air 5km above your head). As that Tibetan air is warmer than the surrounding cold air it rises and acts as a heat “pump”, sucking more air in to replace it and enhancing the monsoon circulation.

Changes over the (millions of) years

We found the intensity of the monsoon has varied significantly over the past 145m years. At first, it was around 30% weaker than today. Then, during the Late Cretaceous 100-66m years ago, a huge inland sea covered much of North America and weakened the Pacific trade winds. This caused East Asia to become very arid due to the monsoon disappearing.

However, rainfall patterns changed substantially after the Indian tectonic plate collided into the Asian continent around 50m years ago, forming the Himalayas and the Tibetan Plateau. As the land rose up, so did the strength of the monsoon. Our results suggest that 5-10m years ago there were “super-monsoons” with rainfall 30% stronger than today.

But how can we be sure that such changes were caused by geography, and not elevated carbon dioxide concentrations? To test this, we again modelled the climate for all different time periods (roughly every 4m years) and increased or reduced the amount of CO₂ in the atmosphere to see what effect this had on the monsoon. In general, irrespective of time period chosen, the monsoon showed little sensitivity (-1% to +13%) to changes in CO₂ compared to the impact of changes in regional geography.

Climate models are working

The monsoon in East Asia is mainly a result of its favourable geographic position and regional topography – though our work shows that CO₂ concentrations do have an impact, they are secondary to tectonics.

The past can help us better understand how the monsoon will behave as the climate changes – but its not a perfect analogue. Although rainfall increased almost every time CO₂ doubled in the past, each of these periods was unique and dependent on the specific geography at the time.

The reassuring thing is that climate models are showing agreement with geological data through the past. That means we have greater confidence that climate models are able to accurately predict how the monsoon will respond over the next century as humans continue to emit more CO₂ into the atmosphere.The Conversation

—————————–
This blog was written by Cabot Institute member Dr Alex Farnsworth, Postdoctoral Research Associate in meteorology at the University of Bristol. This article is republished from The Conversation under a Creative Commons license. Read the original article.

Alex Farnsworth

How we traced ‘mystery emissions’ of CFCs back to eastern China

Since being universally ratified in the 1980s, the Montreal Protocol – the treaty charged with healing the ozone layer – has been wildly successful in causing large reductions in emissions of ozone depleting substances. Along the way, it has also averted a sizeable amount of global warming, as those same substances are also potent greenhouse gases. No wonder the ozone process is often held up as a model of how the international community could work together to tackle climate change.

However, new research we have published with colleagues in Nature shows that global emissions of the second most abundant ozone-depleting gas, CFC-11, have increased globally since 2013, primarily because of increases in emissions from eastern China. Our results strongly suggest a violation of the Montreal Protocol.

A global ban on the production of CFCs has been in force since 2010, due to their central role in depleting the stratospheric ozone layer, which protects us from the sun’s ultraviolet radiation. Since global restrictions on CFC production and use began to bite, atmospheric scientists had become used to seeing steady or accelerating year-on-year declines in their concentration.

Ozone-depleting gases, measured in the lower atmosphere. Decline since the early 1990s is primarily due to the controls on production under the Montreal Protocol. AGAGE / CSIRO

But bucking the long-term trend, a strange signal began to emerge in 2013: the rate of decline of the second most abundant CFC was slowing. Before it was banned, the gas, CFC-11, was used primarily to make insulating foams. This meant that any remaining emissions should be due to leakage from “banks” of old foams in buildings and refrigerators, which should gradually decline with time.

But in that study published last year, measurements from remote monitoring stations suggested that someone was producing and using CFC-11 again, leading to thousands of tonnes of new emissions to the atmosphere each year. Hints in the data available at the time suggested that eastern Asia accounted for some unknown fraction of the global increase, but it was not clear where exactly these emissions came from.

Growing ‘plumes’ over Korea and Japan

Scientists, including ourselves, immediately began to look for clues from other measurements around the world. Most monitoring stations, primarily in North America and Europe, were consistent with gradually declining emissions in the nearby surrounding regions, as expected.
But all was not quite right at two stations: one on Jeju Island, South Korea, and the other on Hateruma Island, Japan.

These sites showed “spikes” in concentration when plumes of CFC-11 from nearby industrialised regions passed by, and these spikes had got bigger since 2013. The implication was clear: emissions had increased from somewhere nearby.

To further narrow things down, we ran computer models that could use weather data to simulate how pollution plumes travel through the atmosphere.

Atmospheric observations at Gosan and Hateruma monitoring stations showed an increase in CFC-11 emissions from China, primarily from Shandong, Hebei and surrounding provinces. Rigby et al, Author provided

From the simulations and the measured concentrations of CFC-11, it became apparent that a major change had occurred over eastern China. Emissions between 2014 and 2017 were around 7,000 tonnes per year higher than during 2008 to 2012. This represents more than a doubling of emissions from the region, and accounts for at least 40% to 60% of the global increase. In terms of the impact on climate, the new emissions are roughly equivalent to the annual CO₂ emissions of London.

The most plausible explanation for such an increase is that CFC-11 was still being produced, even after the global ban, and on-the-ground investigations by the Environmental Investigations Agency and the New York Times seemed to confirm continued production and use of CFC-11 even in 2018, although they weren’t able to determine how significant it was.

While it’s not known exactly why production and use of CFC-11 apparently restarted in China after the 2010 ban, these reports noted that it may be that some foam producers were not willing to transition to using second generation substitutes (HFCs and other gases, which are not harmful to the ozone layer) as the supply of the first generation substitutes (HCFCs) was becoming restricted for the first time in 2013.

Bigger than the ozone hole

Chinese authorities have said they will “crack-down” on any illegal production. We hope that the new data in our study will help. Ultimately, if China successfully eliminates the new emissions sources, then the long-term negative impact on the ozone layer and climate could be modest, and a megacity-sized amount of CO₂-equivalent emissions would be avoided. But if emissions continue at their current rate, it could undo part of the success of the Montreal Protocol.


The network of global (AGAGE) and US-run (NOAA) monitoring stations. Luke Western, Author provided

While this story demonstrates the critical value of atmospheric monitoring networks, it also highlights a weakness of the current system. As pollutants quickly disperse in the atmosphere, and as there are only so many measurement stations, we were only able to get detailed information on emissions from certain parts of the world.

Therefore, if the major sources of CFC-11 had been a few hundred kilometres further to the west or south in China, or in unmonitored parts of the world, such as India, Russia, South America or most of Africa, the puzzle would remain unsolved. Indeed, there are still parts of the recent global emissions rise that remain unattributed to any specific region.

When governments and policy makers are armed with this atmospheric data, they will be in a much better position to consider effective measures. Without it, detective work is severely hampered.


—————————
This blog is written by Cabot Institute member Dr Matt Rigby, Reader in Atmospheric Chemistry, University of Bristol; Luke Western, Research Associate in Atmospheric Science, University of Bristol, and Steve Montzka, Research Chemist, NOAA ESRL Global Monitoring Division, University of ColoradoThis article is republished from The Conversation under a Creative Commons license. Read the original article.

Listen to Matt Rigby talk about CFC emissions on BBC Radio 4’s Inside Science programme.

Learning about cascading hazards at the iRALL School in China

Earlier this year, I wrote about my experiences of attending an interdisciplinary workshop in Mexico, and how these approaches foster a rounded approach to addressing the challenges in communicating risk in earth sciences research. In the field of geohazards, this approach is increasingly becoming adopted due to the concept of “cascading hazards”, or in other words, recognising that when a natural hazard causes a human disaster it often does so as part of a chain of events, rather than as a standalone incident. This is especially true in my field of research; landslides. Landslides are, after all, geological phenomena studied by a wide range of “geoscientists” (read: geologists, geomorphologists, remote sensors, geophysicists, meteorologists, environmental scientists, risk assessors, geotechnical and civil engineers, disaster risk-reduction agencies, the list goes on). Sadly, these natural hazards affect many people across the globe, and we have had several shocking reminders in recent months of how landslides are an inextricable hazard in areas prone to earthquakes and extremes of precipitation.

The iRALL, or the ‘International Research Association on Large Landslides’, is a consortium of researchers from across the world trying to adopt this approach to understanding cascading hazards, with a particular focus on landslides. I was lucky enough to attend the ‘iRALL School 2018: Field data collection, monitoring and modelling of large landslides’ in October this year, hosted by the State Key Laboratory of Geohazard Prevention and Geoenvironment Protection (SKLGP) at Chengdu University of Technology (CDUT), Chengdu, China. The school was attended by over 30 postgraduate and postdoctoral researchers working in fields related to landslide and earthquake research. The diversity of students, both in terms of subjects and origins, was staggering: geotechnical and civil engineers from the UK, landslide specialists from China, soil scientists from Japan, geologists from the Himalaya region, remote sensing researchers from Italy, earthquake engineers from South America, geophysicists from Belgium; and that’s just some of the students! In the two weeks we spent in China, we received presentations from a plethora of global experts, delivering lectures in all aspects of landslide studies, including landslide failure mechanisms, hydrology, geophysics, modelling, earthquake responses, remote sensing, and runout analysis amongst others. Having such a well-structured program of distilled knowledge delivered by these world-class researchers would have been enough, but one of the highlights of the school was the fieldwork attached to the lectures.

The scale of landslides affecting Beichuan County is difficult to grasp: in this photo of the Tangjiwan landslide, the red arrow points to a one story building. This landslide was triggered by the 2008 Wenchuan earthquake, and reactivated by heavy rainfall in 2016.

The first four days of the school were spent at SKLGP at CDUT, learning about the cascading hazard chain caused by the 2008 Wenchuan earthquake, another poignant event which demonstrates the interconnectivity of natural hazards. On 12th May 2008, a magnitude 7.9 earthquake occurred in Beichuan County, China’s largest seismic event for over 50 years. The earthquake triggered the immediate destabilisation of more than 60,000 landslides, and affected an area of over 35,000 km2; the largest of these, the Daguangbao landslide, had an estimated volume of 1.2 billion m3 (Huang and Fan, 2013). It is difficult to comprehend numbers on these scales, but here’s an attempt: 35,000 km2 is an area bigger than the Netherlands, and 1.2 billion m3 is the amount of material you would need to fill the O2 Arena in London 430 times over. These comparisons still don’t manage to convey the scale of the devastation of the 2008 Wenchuan earthquake, and so after the first four days in Chengdu, it was time to move three hours north to Beichuan County, to see first-hand the impacts of the earthquake from a decade ago. We would spend the next ten days here, continuing a series of excellent lectures punctuated with visits to the field to see and study the landscape features that we were learning about in the classroom.

The most sobering memorial of the 2008 Wenchuan earthquake is the ‘Beichuan Earthquake Historic Site’, comprising the stabilised remains of collapsed and partially-collapsed buildings of the town of Old Beichuan. This town was situated close to the epicentre of the Wenchuan earthquake, and consequently suffered huge damage during the shaking, as well as being impacted by two large landslides which buried buildings in the town; one of these landslides buried a school with over 600 students and teachers inside. Today, a single basketball hoop in the corner of a buried playground is all that identifies it as once being a school. In total, around 20,000 people died in a town with a population of 30,000. Earth science is an applied field of study, and as such, researchers are often more aware of the impact of their research on the public than in some other areas of science. Despite this, we don’t always come this close to the devastation that justifies the importance of our research in the first place.

River erosion damaging check-dams designed to stop debris flows is still a problem in Beichuan County, a decade after the 2008 Wenchuan earthquake.

It may be a cliché, but seeing is believing, and the iRALL School provided many opportunities to see the lasting impacts of large slope failures, both to society and the landscape. The risk of debris flows resulting from the blocking of rivers by landslides (a further step in the cascading hazard chain surrounding earthquakes and landslides) continues to be a hazard threatening people in Beichuan County today. Debris flow check-dams installed after the 2008 Wenchuan earthquake are still being constantly maintained or replaced to provide protection to vulnerable river valleys, and the risk of reactivation of landslides in a seismically active area is always present. But this is why organisations such as the iRALL, and their activities such as the iRALL School are so important; it is near impossible to gain a true understanding of the impact of cascading hazards without bringing the classroom and the field together. The same is true when trying to work on solutions to lessen the impact of these cascading hazard chains. It is only by collaborating with people from a broad range of backgrounds, skills and experiences can we expect to come up with effective solutions that are more than the sum of their parts.

—————
This blog has been reposted with kind permission from James Whiteley.  View the original blog on BGS Geoblogy.   This blog was written by James Whiteley, a geophysicist and geologist at University of Bristol, hosted by British Geological Survey. Jim is funded through the BGS University Funding Initiative (BUFI). The aim of BUFI is to encourage and fund science at the PhD level. At present there are around 130 PhD students who are based at about 35 UK universities and research institutes. BUFI do not fund applications from individuals.

The fraud factor: Why a changing environment might mean more food scandals in the future

Horse meat in burgers, melamine in milk and shark labelled as swordfish…as our urban lifestyle brings us further from our food sources, there are more opportunities for dishonesty along each link of the food production chain. Whether it’s a matter of making a good quality oil stretch a little further by adding cheaper oil or labeling something falsely to appeal to current consumer trends – it’s all fraud and it costs the global food industry an estimated US$10-15 billion each year [1].

While there is evidence that the incidences of food fraud are on the rise [2], consumers have been swindled by food producers since…well, since there have been food producers. Indeed food fraud in the 18th and early 19th century was so widespread and involved such toxic substances that it’s surprising that the citizens of industrialised nations managed to survive to their next meal [3]. Pickles were turned an alluring bright blue-green through the use of copper sulfate, children’s sweets were colored with lead and copper, and chalk and lime (calcium oxide, not the fruit) were common additives to bread. By comparison, one might argue that a little horsemeat in one’s burger might seem rather tame.

Unlike previous generations, however, our food supply systems have become incredibly complex. Food passes through many hands and travels around the world at such astonishing speeds that the threat of food fraud now has a global reach. Add to this a changing environment with implications for agriculture, food and energy security, and transportation and we may very well be creating the ideal conditions for culinary crimes: incentive and opportunity.

Factors contributing to food fraud


Milk, olive oil, honey and spices are among
the most commonly adulterated foods.
Image by Nicola Temple.

Unlike food safety issues, which generally stem from neglect, food fraud is a deliberate act, usually for financial gain. Behind every scandal are people who make decisions to be dishonest, but what is it that motivates these behaviours?

Some of the factors that are thought to have contributed to recent food fraud scandals, such as horsemeat in the UK and fox meat in China, include: the financial crisis, rising food prices, a demand for cheap food, complex food supply chains, a lack of strong penalties, and low risk of detection [4].

Climate change may trigger more criminal behaviour in the future

If we now look at these crime contributing factors in the context of climate change, we might expect to see even more food scandals hitting headlines in the future. More extreme weather events – such as droughts and floods – will affect agriculture, as will increased prevalence of disease and parasites that have longer life cycles in a warmer climate (e.g. blowfly strike). These conditions can force food producers into a state of desperation.

For example, in the late 1800s a tiny root-feeding aphid (Phylloxera) sucked the sap out of nearly 2.5 million hectares of grapes in France. The vineyard owners began to import raisins from other countries, desperate to fill demands for wine. They even fabricated wines entirely from chemicals, sugar and water [5].

The costs of food transportation may also increase as changes in weather patterns and extreme weather events cause infrastructure disruptions and the price of fossil fuels (upon which our food transportation systems are so dependent) increases.

The combination of farmers thwarted by environmental conditions and increased transportation costs alone could potentially increase the costs associated with food production. All the while, an ever growing global population continues to demand cheap food. It is indeed a situation that could very well force otherwise honest people into shady territory.

While food fraud has been discussed thoroughly in terms of globalisation, and even in the context of security and acts of terrorism, to my knowledge there has yet to be much discussion on food fraud in the context of climate change and an uncertain environment.

Fighting food fraud

In a proactive approach to preventing food fraud there are two approaches: reducing the motivation behind the crime and reducing the opportunities to commit the crime [6]. Governments around the world are moving food fraud further up the agenda, considering action plans to crack down on fraudsters with more funding for testing, increased penalties and a more cooperative approach to gathering and sharing information on types of food fraud.

At the same time, researchers are doing their best to help build resilient agriculture through the development of disease and drought resistant crops, increased yields, disease prevention and welfare in livestock and more sustainable farming practices.

Other researchers are spearheading new technologies and methods that can detect food adulteration. This not only increases the risk of fraudsters getting caught, it forces the fraudsters to become more sophisticated in their techniques and eventually the cost of adulterating the food becomes so high it is no longer worthwhile.

As always, we as consumers are not helpless. Our behaviours and choices can make us less vulnerable to food fraud. If we reduce the number of steps between the producers and ourselves, this alone will reduce our chances of being swindled.

Over the last three years I have worked on several projects with the University of Bristol’s Cabot Institute. With every interaction I have with the researchers involved with Cabot, I find myself making new connections between the realities of daily life and how these may be altered in an uncertain and changing climate. I have spent considerable time thinking and writing about ocean acidification, warming temperatures, sea-ice melt, extreme weather events and food security and yet I have not given enough consideration to the impacts on things like education, finances, and security.
Any one of these topics on their own are overwhelming and so by necessity we need to break the issues down into tangible components. However, I’m grateful that there are groups like the Cabot Institute out there who are helping to hold the bigger picture – connecting a web and giving an occasional tug on the silk lines to see how the whole thing shakes.

Sources/notes
[1] Johnson R. (2014) Food Fraud and ‘Economically Motivated Adulteration’ of Food and Food Ingredients. Congressional Research Service Report (7-5700), Prepared for Members and Committees of Congress. http://www.fas.org/sgp/crs/misc/R43358.pdf
[2] Holpuch A. (23 January 2013) Food fraud report reveals rise in manufacturers’ cost-cutting measures. The Guardian < http://www.theguardian.com/world/2013/jan/23/food-fraud-report-cost-cutting>
[3] For a thorough and captivating history of food fraud, I highly recommend the book Swindled by Bee Wilson and published by Princeton University Press.
[4] Avery J. (16/01/2014) Fighting food fraud, European Parliamentary Research Service < http://www.europarl.europa.eu/RegData/bibliotheque/briefing/2014/130679/LDM_BRI(2014)130679_REV1_EN.pdf
[5] Wilson B. (2008) Swindled. Princeton, New Jersey: Princeton University Press. (Pg. 60)
[6] Spink J, Moyer DC. (2011) Defining the public health threat of food fraud. Journal of Food Science, 76 (9):R157-R163. http://onlinelibrary.wiley.com/doi/10.1111/j.1750-3841.2011.02417.x/full

This blog is written by Nicola Temple, Independent Science Writer and editor of the Cabot Institute Magazine.  This blog was taken from Nicola’s blog with kind permission.

Nicola Temple

Growth and energy use – a surprising relationship

One assumption that is often made in public discourse is that the size of the economy and the consumption of energy are firmly and linearly linked; the growth of one inevitably requires the growth of the other. But are things really that simple? I’m not so sure.A great place to start when considering a question like this is the excellent dataset maintained by the World Bank.  Let’s start in the UK: how does GDP relate to the usage and production of energy? These are plotted in Figure 1. The economy has grown steadily since 1960, but the same can’t be said of energy use or production; indeed, production can be seen to be in steep decline since 2000.

Figure 1


To get a clearer picture, let’s consider the relationship between UK energy use and GDP in Figure 2. Clearly, the trajectory is far from linear. In fact, since 2000 the UK economy has both expanded and contracted, whilst energy use has been in rapid decline in the same period. It’s likely that advances in energy efficiency and the decline of heavy industry in the UK may be responsible for this effect, but the fact remains that there is little evidence that a growing UK economy will always need more energy to sustain it. It may even be possible that a larger, ‘greener’ economy may need even less energy in years to come.

Figure 2

So, does that mean that humanity has finally broken free of its addiction to energy? Can the world economy grow without draining the Earth’s energy resources? I’d say no.

Before the industrial revolutions of the 19th century, the basis of a country’s economy was predominantly agrarian, and the engine of agricultural production was muscle power. This was replaced by mechanical fuel-driven devices as countries industrialised, and led to the strong correlation between growth and energy use. This effect is still very visible in the fast growing economies of recently industrialised nations. An excellent example is that of China, visible in Figure 3 and Figure 4.

Figure 3


Figure 4

While the UK does appear to have reversed the trend of energy usage, this is due to a large extent to globalisation. Today, we in the UK import a much larger selection of goods from overseas than we did before the industrial revolution. Industrial economies are often still shackled by the old linear relationship between energy use and economic output, and by purchasing goods from these countries we are simply ‘outsourcing’ our energy needs elsewhere. Perhaps nations that are in the process of industrialisation will eventually adopt more energy-efficient means than they currently use. But until then, my conclusion is that it is possible to grow the UK economy without increasing our energy use. However, we do so at a cost to world energy use, and perhaps that should be the statistic that we pay more attention to.

This blog is written by Neeraj Oak, Cabot Institute.


Neeraj Oak