I was given the opportunity to spend a significant part of 2018 in Bangkok, Thailand, to work with the Chulabhorn Research Institute (CRI) Laboratory of Environmental Toxicology working on a project funded by the Newton Fund on air-quality. Bangkok is a large city with over 14 million inhabitants, which suffer high levels of traffic and congestion resulting in consequent high exposure to traffic-related pollution. It is a UN Sustainable development goal to reduce the number of deaths caused by pollution by 2030. Air pollution is a global problem – a major threat to health throughout the world – but particularly so in low and medium income countries, which account for 92% of pollution related deaths (1). The poor and the marginalised often live in areas of high pollution, and children have a disproportionate exposure to pollutants at a vulnerable stage of development.
The Chulabhorn Research Institute is an independent research institute in Bangkok whose mission includes the application of science and technology to improve the Thai people’s quality of life. The Laboratory of Toxicology, under Professor Mathuros Ruchirawat, have a very strong record in using their results to inform policy and make a real impact on the lives of people in South East Asia affected by environmental toxins. For example, a previous study undertaken by the CRI found that people living and working near busy roads were exposed to Benzene from traffic exhaust, and they demonstrated increased DNA damage. Once this was known, the Thai government was persuaded to alter fuel mixtures in cars to protect the population (2).
I was in Bangkok from January to June, then returned in September till December 2018. I brought with me particle measurement and sampling equipment to count particles and sample particulate matter (PM) in Bangkok to supplement the toxicology work of the Research institute. PM can be described by its size fractions; usually reported are PM10 (aerosol diameter 10 micrometres and lower) and PM2.5 (2.5 micrometres and lower). Less often measured, is the sum-micron range (sometimes referred to as PM1) and the ultrafine range (less than 100 nm).
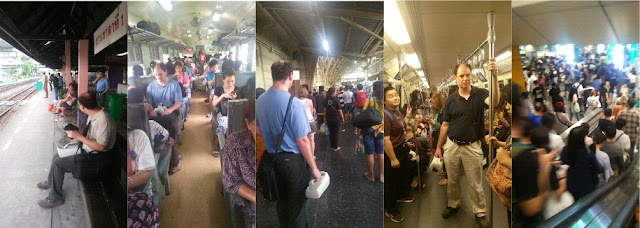 |
| James Matthews with his particle measurement and sampling equipment on public transport in Bangkok. |
Below 1 μm, it becomes more difficult to measure particle numbers as optical techniques fail on particles around 200 nm and smaller. To count them, the particles require a solvent to grow them to a countable size. The requirement for regular solvents, and the high price of aerosol instrumentation to measure the smallest sizes, mean that particle number concentration is not always measured as a matter of course, but new research is indicating that they may be a significant health concern. The smaller particles can penetrate further into the lung and there is some evidence that this may cause them to pass further into the body, possibly even making its way into the brain. While much more research is needed – in both the toxicological and epidemiological domains – to understand the effects of these smaller particles I would not be surprised if the narrative on air quality moves further toward the ultrafine size range in the very near future.
While in Bangkok, I added my aerosol science expertise and experience in aerosol field measurements to the team in the CRI, taking measurements of particle number count using a handheld particle counter, and collecting samples of PM using both PM10 samplers, and a cascade impactor (the Dekati Electrical Low Pressure Impactor) that allowed samples to be separated by aerodynamic size, then collected for further analysis on ICP-MS (inductively coupled plasma mass spectrometry). Thus, metal concentrations within all the different size fractions of aerosol could be found. Within the first few months of the project, I was able to train the staff at the CRI to use this equipment, and so measurements could continue when I returned to the UK.
As well as taking measurements at the CRI in the Lak Si district, north of Bangkok, we chose three sites in the wider Bangkok area that represented different exposure conditions. We were given access to the Thai governmental Pollution Control Department (PCD) air quality measurements sites, where our instrumentation was set up next to their other pollutant measurements.
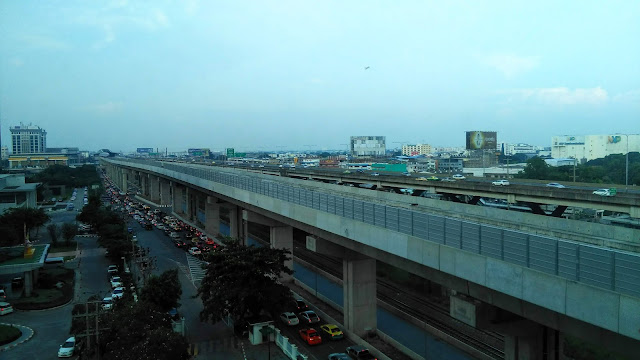 |
| A toll road and railway in Lak Si – from Bangkok toward the Don Mueang airport. Image credit James Matthews. |
The three sites included Ayutthaya, a UNESCO world heritage site north of Bangkok. Ayutthaya, while a busy tourist destination, has considerably less traffic, and therefore less traffic emission related pollutants, than the other sites. The second site, Bang Phli, was an area to the South of Bangkok where there is a lot of industry. The third, Chok Chai, was a roadside site in central Bangkok.
Survey measurements of particle count were taken in several locations using a hand-held particle counter. The particle numbers were highest in measurements on the state railway and on the roads in Bangkok. The state railway through Bangkok is slow moving, where diesel engines repetitively start and brake, all of which contribute to particulates. Conversely the newer sky train and underground railways had low particle counts (the underground had the lowest counts I measured anywhere). At the CRI site, long term measurements near a toll road showed that the particle number count was highest at rush hours, indicating traffic as the dominant contributor. Walking routes in both Bangkok and Ayutthaya showed high concentrations near roads, and in markets and street stalls, where street vendors produce food.
Within our measurements in Bangkok, we were able to measure the mass fraction, and the metal (and some non-metals such as arsenic) content over 12 size fractions from 10 um down to 10 nm. Metals that are known to be deleterious to human health include Cadmium, Chromium, Nickel and Lead, which are class 2 (possible or probable) or class 1 (known) carcinogens. Comparing the reference site (Ayutthaya) with the roadside site (Chok Chai) over several 3-day sampling periods showed that these toxic metals were present in higher concentrations in the area with higher traffic. They were also present in higher concentration in the lower size ranges, which may result in these metals penetrating deeper into the lung.
One episode demonstrated the need for local knowledge when measurements are taken. Normally, we would expect measurements during weekdays to be higher in working areas than at weekends, due to increased work traffic, and in most cases this was the case (Ayutthaya was often an exception, likely due to weekend traffic from tourists). However, one weekend saw a notable peak in aerosol concentrations at a site one Saturday evening, which was difficult to explain. It was pointed out to me by colleagues at the institute that over this weekend was a festival during which the Chinese community in Bangkok traditionally burned items, including fake money, as a long standing tradition. The peak in particles fitted this explanation.
Knowing more about the nature and level of pollutants in a city is an important first step, but challenges persist for the people in Bangkok and other polluted cities as to how to reduce these exposures. The problem of rural crop burning is one that frustrates many in Thailand, as it is well known that the particulates from burnt crops are harmful to the population. While there are strong restrictions on the deliberate burning of crops, it is still common see fields burning in January to March in areas of northern Thailand. Similarly, Bangkok remains the city of the car, with residents accepting that they may have to sit in traffic for long periods to get anywhere.
 |
| Burning mountains in Thailand. Wikimedia Commons. |
Researchers from Bristol were able to discuss our results alongside measurements from the PCD and the CRI in Bangkok in a seminar held in 2019. It was apparent that there is great awareness of the dangers of air pollution, but it still seems that more needs to be done to address these problems. In January 2019, Bangkok made the headlines for PM2.5 exposures that were at dangerously high levels. January in Thailand is during the ‘cool’ season, where both temperatures and rainfall are low. This weather results in a trapping of pollutants within the city, thus increasing exposure levels. On discussing this with the pollution experts in Thailand, it was argued that the levels this year were typical levels for January, but the reporting of those levels had changed. The Thai PCD advocate communication of pollutant levels though their website and their app, and until recently the PCD sites did not measure PM2.5 in a sufficient number of stations to use it in their air quality index calculations. This year, they changed the calculation to include PM2.5, and as a consequence, the high pollutant levels discussed above were reported. The reporting of these pollutant levels can be attributed to the greater awareness of the population to the problem of pollution, which in turn is leading to a greater urgency in finding solutions.
So there is a role for the direct engagement with the population, which may lead to pressure on governments to respond. There is also a role for science to provide leaders with tangible solutions, such as the suggestion to change fuel mixtures. But the huge challenge of reducing sources of pollutants in a growing city like Bangkok remains.
1 Landringham, P. J. et al 2017. Lancet 391, 462-512
2 Davies R., 2018. Lancet 391, 421.
————————–
This blog is written by
Cabot Institute member
Dr James Matthews,
School of Chemistry, University of Bristol. James’ research looks at the flow of gases in urban environments, and the use of perfluorocarbon trace gas releases to map the passage of air in urban cities.
 |
| James Matthews |


