Travelling through Asia’s breadbasket

This is the second of a series of blogs from a group of University of Bristol Cabot Institute researchers who are on a remote expedition (funded by BCAI) to find out more about Kazakh agriculture and how farmers are responding to their changing landscape. 

Image credit: Hannah Vineer

Queen’s ‘Bohemian Rhapsody’ played on the car radio as we drove through endless fields of stubble stretching into the horizon in every direction. We were 2 days into our 3-day, 2,345km journey from Astana to our field site, and it was easy to see why Kazakhstan is referred to as Asia’s breadbasket. Spring had finally arrived after an unusually long winter.  Tractors were busy burning, ploughing and planting, disappearing into the distance with each pass of the field.

The vast, flat steppe has provided the opportunity for cereal production on a scale unrivalled by the UK’s comparatively small field enclosures. In 2017, Kazakhstan held wheat stocks of 12MMT (million metric tonnes), making UK’s 1.4MMT seem like a drop in the ocean by comparison. Kazakhstan exports wheat globally and is a key player in global food security. Grain elevators capable of storing more than 100,000 tonnes of grain dominate the skyline of every major town and soon became a familiar feature of the landscape to us.

Image credit: Hannah Vineer

Our journey was punctuated every 6 hours or so by stops at restaurants that seemed to appear out of nowhere. Each one was as unique as the last, their bright colours a reflection of the cheerful nature of the Kazakh people. The popular Tabletkas parked outside reminded me of VW Transporters, and the friendly locals reminded me of my Welsh roots, where strangers greet you on the street.

Image credit: Hannah Vineer

The restaurants served a range of traditional Kazakh comfort food – meat and milk based meals like borscht, always served with bread, of course. Bread, or нан (pronounced naan) is a staple food here and is said to be the most important part of the dinner table. The menu, written in the Cyrillic alphabet, was indecipherable to me at first and I had to pester the Kazakh and Russian members of our team to help me choose a meal each time. Based on my excited reaction when I finally discovered the image recognition feature of my Google Translate app, you would have thought that I had never seen modern technology before. In truth, I was just relieved to not be such a burden on the rest of team!

Image credit: Hannah Vineer

Before long we were back on the road and as the hours passed I looked forward to getting to camp and getting started with our work. We planned to visit remote villages, thousands of kilometres off the tourist track, to survey farmers about how they cope with weather extremes such as this year’s particularly harsh winter. But for now, we had run out of time and energy. The sun was setting and we needed to find a place to rest for the night. We headed for the dim twinkling lights of Aktobe, passing a tractor working into the night, illuminating a cloud of dust in its wake. When we eventually found a motel with rooms available, I found it difficult to sleep. I couldn’t wait for the final leg of our journey to our wild camp in the Kazakh steppe.

———————————
This blog is written by Cabot Institute member Hannah Rose Vineer.  This expedition has been kindly funded by the Bristol Centre for Agricultural Innovation.  This blog was reposted with permission from the BCAI blog site.

Setting off on a BCAI expedition to Kazakhstan

This is the first of a series of blogs from a group of University of Bristol Cabot Institute researchers who are on a remote expedition (funded by BCAI) to find out more about Kazakh agriculture and how farmers are responding to their changing landscape. 

Abandoned machinery. Image credit Hannah Vineer.

Ghost towns on the Kazakh steppe look as though they are centuries old, but it is an illusion. They have been sandblasted relentlessly by the force of the steppe since they were abandoned, less than 40 years ago, after the breakdown of the Soviet Union. This is one area on earth that people have largely failed to tame, but as the human population increases the country’s agricultural systems are rapidly developing and focus is turning to the steppe once again. At the same time, farmers must adapt to recent changes in climate – drier summers limit crop production and water availability, and changing patterns of snowfall and snowmelt threaten the lives of livestock. I am about to embark on a remote expedition to find out more about Kazakh agriculture and how farmers are responding to their changing landscape. Follow this blog series for updates from the field.

Since 2000, approximately 5,000,000 additional hectares of land have been sown for cropping, and approximately 2,000,000 each additional sheep, cattle and horses are kept in Kazakhstan. This increase in livestock productivity is largely driven by smallholder farmers, who rely on livestock for up to a fifth of their family’s food. However, climate change has been felt disproportionately in Central Asia, threatening food security. National Geographic recently reported that over half a million animals failed to survive the winter in neighbouring Mongolia due to a combination of lethal winter conditions and poor summer crop growth, so I’m anxious to see how the Kazakhs fared.

Image credit: mapchart.net

I’m told that in the Ural region in Western Kazakhstan, wheat production, livestock and wildlife exist in close contact, and that this is the best place to start my research. I’m set to fly to Astana tomorrow to join colleagues from the Association for the Conservation of Biodiversity of Kazakhstan (ACBK) on the three-day, 2,000km journey to the far west. With the help of ACBK and Bristol PhD student Munib Khanyari, I will interview farmers spread out over an area the size of England, skirting along the Russian border and the Caspian Sea. I’ll spend my evenings wild camping off-grid under the stars for 2-3 weeks. There will be no fresh water, no toilets and no internet – the team and I have to carry everything we need in order to survive the duration. Wish me luck!

———————————

This blog is written by Cabot Institute member Hannah Rose Vineer.  This expedition has been kindly funded by the Bristol Centre for Agricultural Innovation.  This blog was reposted with permission from the BCAI blog site.Read part two of this blog – Travelling through Asia’s breadbasket.

The Paris Agreement – where are we now?

Cabot Annual Lecture 2018

This year the Cabot Institute Annual Lecture posed a critical question: where are we with current efforts to tackle global climate change? The event brought together over 800 people to hear from leading Cabot Institute experts in climate science, policy, and justice, Dr Jo House, Dr Dann Mitchell, Dr Alix Dietzel and Professor Tony Payne. It was both an appraisal of the findings of the recently published report of the Intergovernmental Panel on Climate Change (IPCC), and a grounded call to climate action.

Paris commitments

In 2015 world leaders adopted the Paris Agreement committing all parties to limiting global average temperatures to well below 2 °C above pre-industrial levels and to pursue efforts to limit warming to 1.5 °C. All countries undertook to achieve global peaking of greenhouse gas emissions as soon as possible and to enact increasingly ambitious mitigation measures in line with the overarching temperature goals. The Paris Agreement, in contrast to the preceding Kyoto Protocol, is not based on legally binding reductions targets for developed countries, but on a voluntary system of pledges known as ‘nationally determined contributions’ for all parties which will be subject to a stocktake of global progress every five years, beginning in 2023.

Although the Paris Agreement initially offered great promise with pledges being made by both developed and developing countries, a report by the UN Environment Programme in November 2017 examining progress towards the global temperature goals found that even if all current pledges are honoured, we remain on track for some 3 °C of warming by 2100. In light of this, and under the Presidency of Fiji, the first Small Island State to preside over a Conference of the Parties at COP23 last year, the focus has been on building momentum for more urgent action through the facilitative ‘Talanoa dialogue’ and on hashing out the final operating procedures for the Agreement. The findings of the IPCC Report on Global Warming of 1.5°C, published on 8 October represent a further important piece of the picture of global progress, which three of the Cabot speakers shed light upon as contributing authors.

Why 0.5°C of warming matters

The findings of the report are significant in illustrating the projected differences in climate change impacts between the 1.5°C and 2°C temperature thresholds. Dr Dann Mitchell outlined the evidence for increases in regional mean temperatures and for the increasing likelihood of temperature extremes of the kind witnessed during this summer’s European heatwave, which we could see occur almost every year at 2°C of warming. These extremes, together with the projected intensification of storms presented in the report, are closely linked to human risks to health, wellbeing and livelihoods.

Cabot Annual Lecture 2018
Dr Dann Mitchell

Professor Tony Payne echoed these concerns with respect to the findings of the report on sea-level rise which predict an extra 10cm rise between the 1.5°C and 2°C temperature thresholds, equating, in turn, to an additional 10 million people at risk of related impacts including inundation and displacement. The destabilisation of the ice sheets is set to become more likely beyond 1.5°C, entailing risks of much greater sea-level rise in the future. Professor Payne further outlined the strikingly severe consequences for coral reefs of the two temperature thresholds, with projections that at 2°C all coral in the oceans will die, while by limiting temperature to 1.5°C, some 10-30% of coral will survive. Reefs are not only crucial for the maintenance of healthy marine ecosystems, but also for the millions of people around the world who depend upon those ecosystems for their food security and livelihoods.

Cabot Annual Lecture 2018
Professor Tony Payne

A call for action

Against these stark warnings on the significance of limiting global temperatures to 1.5°C, Dr Jo House outlined some key recommendations for how we can get on track. The IPCC report sets out a number of pathways for action, each calling for changes across a broad spectrum of policy sectors with the aim of rapidly reducing greenhouse gas emissions and enhancing the absorption of existing carbon in the atmosphere. These changes include moving away from fossil fuels to renewable sources of energy, greening the transport sector, replanting forests, and investing in carbon capture and storage technologies. Dr House underlined the importance of action at all levels of governance to meet these goals. At the national level in the UK under the provisions of the Climate Change Act we are already committed to an 80% reduction on 1990 levels by 2050, while at the city level in Bristol, the Climate and Energy Security Framework commits to the same target, with a 50% reduction to be achieved by 2025.

Cabot Annual Lecture 2018
Dr Jo House

This action in climate policy is increasingly being driven by sub-state actors and Dr Alix Dietzel highlighted the crucial role that local government, civil society groups, citizens initiatives, corporations, and individuals are playing in this. Dr Dietzel expressed cause for hope in the reaction of sub-state actors to the announcement of the withdrawal of the United States from the Paris Agreement, with the ‘WE ARE STILL IN’ movement garnering support from city mayors, governors, tribal leaders, universities, and businesses for continuing commitment to the Paris goals. At the individual level, the actions we can all take within the boundaries of our own capabilities were discussed, outlining our capacity to affect change through our consumption and lifestyle choices. The need to consider the ethical questions surrounding our responsibilities as individuals and global citizens remains crucial, particularly in light of the disproportionately harmful effects that climate impacts will have upon those who have contributed least to the problem.

Cabot Annual Lecture 2018
Dr Alix Dietzel

The risks of inaction on the 1.5°C threshold were balanced against the opportunities and benefits of action by the panel. The successful lobbying efforts of climate-vulnerable states to embed the 1.5°C threshold within the Paris framework, alongside the commitment of many governments and sub-state actors to meet it, are cause for hope but we still have a long way to go.

——————————
This blog was written by Cabot Institute member Alice Venn, a PhD Candidate in Environment, Energy & Resilience at the University of Bristol’s Law School.

Alice Venn

Listen again to the Annual Lecture
View the presentation slides
View the photos on Flickr 
View our Moments or check out #CabotLecture2018 on Twitter.

Local students + local communities = action on the local environment

As part of Green Great Britain Week, supported by BEIS, we are posting a series of blogs throughout the week highlighting what work is going on at the University of Bristol’s Cabot Institute for the Environment to help provide up to date climate science, technology and solutions for government and industry.  We will also be highlighting some of the big sustainability actions happening across the University and local community in order to do our part to mitigate the negative effects of global warming. Today our blog will look at ‘Climate action in communities.

Geography students from the University of Bristol spent February 2018 working on air, soil and water quality research projects for local organisations and community groups, including Bristol Green Capital Partnership members. Below is a summary of each project, the findings and next steps.

Bristol City Council – Bristol Urban Heat Island effect

Students investigated the effects of urban and suburban heat islands within Bristol compared to local rural areas. Urban Heat Island can impact human health, air and water quality and energy demand in the City with implications for future planning and city resilience. This project aimed to provide early groundwork for Bristol City Council in developing a better understanding of the Urban Heat Island in the city. The group used fifteen Tinytags across the city to collect temperature data and gained secondary data from local weather stations and building management systems. The group used a contour graph (see image below) to illustrate the UHIs they found, there was significant differences (c.1.3C) between rural sites, such as Fenswood Farm, Long Ashton compared to urban sites in close proximity, such as Hotwells Road. Bristol City Council will be using this data and other insights generated through participation in the project to inform i) the co-development of an urban temperature monitoring network and ii) further research into the Urban Heat Island effect.

Malago Valley Conservation Group – water pollution in the River Malago

Students investigated how water quality varied along the River Malago in Bishopsworth and what biological impact the dam has on microplastics and pollution in the river. Initially the group collected GPS data to map the river course and used water quality samples from 40 sites along the river to record nutrient, chlorophyll and microplastic data. The team found that some microplastic build up was evident before dams and weirs along the river and nitrate concentrations increased downstream through nitrification which suggests there may be impacts on the ecology of the river. Overall the river was found to be relatively healthy according to DEFRA and Environment Agency data, but there were recommended actions to protect its health in the future. The Malago Valley Conservation Group will be using the findings to plan conversation work programmes with their volunteers.

Bristol Avon Rivers Trust – water pollution in Three Brooks Lake

Students investigated the Three Brooks Lake and accompanying urban brooks in North Bristol to see if there was a difference in pollution levels entering the lake from two brooks from separate local residential areas. The group collected twenty water samples from the site and secondary data from the Environment Agency to examine variations in the pH, nutrient concentrations, turbidity (cloudiness of the water) and microplastics levels at the site. The findings suggested that there is likely to be a difference in the water quality of the two brooks and that the lake may be a sink for water pollution in the area. The Three Brooks Nature Reserve group will use the findings to support the development of a local management plan and the Bristol Avon Rivers Trust will be using the findings to contribute to their existing knowledge base for the catchment and to search for funding to develop the research further and to undertake any necessary improvements.

Friends of Badock’s Wood – wildflower cultivation in Badock’s Wood

Students investigated the soil conditions in Badock’s Wood to support the cultivation of wildflower meadows. The group collected soil cores from three meadows and a control meadow to analyse the soil moisture and organic matter content in the lab. Most wildflower species prefer calcareous soils (>15% calcium) with low phosphorous and high nitrogen content to grow optimally. Findings showed that two meadows have calcareous soils and two were on the borderline, all meadows had low phosphorus and low nitrogen content. In the present conditions, although some wildflowers do grow, the soil isn’t optimal to sustain the growth of many species but measures could be taken to improve the soil and more robust wildflowers could be selected to cope with soil conditions. The Friends of Badock’s Wood will be using the findings to revise their management plan for the site.

Dundry and Hartcliffe Wildlife Conservation Group – water pollution in Pigeonhouse stream tributaries

Students investigated water quality variances in five tributaries of the Pigeonhouse stream in Hartcliffe and whether this is influenced by land use in the area. The group collected samples to analyse the pH, nutrient content and temperature of the streams. The findings showed that the tributaries were healthy and unlikely to be contributing to water pollution levels in the Pigeonhouse stream and further downstream in the River Malago. The group suggested that high levels of nitrate in one tributary and Pigeonhouse stream were likely to be a result of run-off from neighbouring fertilised agricultural fields. E. Coli was prolific in all areas, the source of this will be a subject for future students to investigate. Dundry and Hartcliffe Wildlife Conservation Group will present the findings to the local neighbourhood partnership group.

Dundry and Hartcliffe Wildlife Conservation Group – effects of urban development and refuse on the Pigeonhouse Stream

Students investigated water quality along the Pigeonhouse stream in Hartcliffe. The group collected water samples to analyse for pH, nutrient content, turbidity and microplastic levels in the stream. Findings showed that microplastic pollution increased and turbidity (water cloudiness) decreased downstream as urbanisation increased. Ammonia and nitrogen concentrations were found to be high in the stream, but average compared to other streams in the region and within DEFRA safety standards. In-flow pipes from the surrounding urban areas are likely to be influencing the water quality in the stream. Dundry and Hartcliffe Wildlife Conservation Group will use the report to work with Bristol Waste to reduce fly-tipping in the area and with the local neighbourhood partnership to develop strategies to reduce pollution from the in-flow pipes.

Friends of Bristol Harbourside Reed Bed – impacts of reed beds on water quality in Bristol Floating Harbour

Students investigated spatial variation in water quality across the reed bed. The group collected twenty-one water samples and analysed for E.Coli, heavy metals, pH and nutrient content. Findings showed usual levels of heavy metals, except for zinc which was ten times higher than expected. There was no evidence that the reed bed influenced nutrient concentrations or pH levels, but this may be different if the research was conducted in summer during peak growing season. High levels of chlorophyll were found over the reed bed which can result in algae blooms. The group recommended that the reed beds should be cut back annually in autumn, this will reduce the amount of dead plant matter in the water to maintain healthy levels of zinc and chlorophyll in the reed bed. Friends of Bristol Harbourside Reed Bed will be using the findings to inform their management plan of the reed bed.

Friends of Bristol Harbourside Reed Bed – the health of the Bristol Floating Harbour reed bed

Students investigated concentrations of heavy metals and microplastics in the reed bed which would impact the reed bed ecology. The group collected ten sediment samples and five reed samples to test in the lab. Findings showed usual nitrate and phosphate levels, but zinc and potassium levels were higher than in comparable rivers which may be due to houseboats dumping excrement in the water. Microplastics were prolific in the sediment samples and identified as a major pollutant in the reed bed. The reed beds were filtering some pollutants in the water, particularly potassium, but these will re-enter the ecological system if the reeds are left to die back. The group recommended that reeds were cut back annually to reduce pollutants in the water. Friends of Bristol Harbourside Reed Bed will be using the findings to inform their management plan of the reed bed.

Bristol Zoo – air pollution at Bristol Zoo

Students investigated CO2 levels as an indicator of air pollution levels at Bristol Zoo. The group collected data using CO2 probes and gas samples at five sites at Bristol Zoo and two control sites at Fenswood Farm, Long Ashton and Bear Pit Roundabout, City Centre. The analysis accounted for environmental factors such as temperature and windspeed. Findings showed that air pollution was higher at the boundaries of Bristol Zoo than in the centre, but not as high as in the city centre. The group suggested further investigations into the impact of the high boundary wall and roadside vegetation on air pollution at Bristol Zoo would be useful. Bristol Zoo will be using the findings to as a baseline for more research into air pollution at the site.

Narroways Millennium Green Trust

Students investigated the impacts of firepits on soil pollution and compaction at the Narroways Hill conservation site in St Werburghs. The group collected twenty soil samples to test in the lab. Findings showed that soil compaction was high in some areas of the site, but no evidence linked this to firepits at the site. Soil moisture was found to increase further from the firepits. There was not significant evidence to show heavy metal pollutants at the sites, except for arsenic which the group are investigating further. Narroways Millennium Green Trust will be using the findings to inform public communications around fires at the site.

———————-
This blog is written by Amy Walsh from Skills Bridge. If your organisation would benefit from similar research, please email amy@bristolgreencapital.org.


Read other blogs in this Green Great Britain Week series:
1. Just the tip of the iceberg: Climate research at the Bristol Glaciology Centre
2. Monitoring greenhouse gas emissions: Now more important than ever?
3. Digital future of renewable energy
4. The new carbon economy – transforming waste into a resource
5. Systems thinking: 5 ways to be a more sustainable university
6. Local students + local communities = action on the local environment

Systems thinking: 5 ways to be a more sustainable university

As part of Green Great Britain Week, supported by BEIS, we are posting a series of blogs throughout the week highlighting what work is going on at the University of Bristol’s Cabot Institute for the Environment to help provide up to date climate science, technology and solutions for government and industry.  We will also be highlighting some of the big sustainability actions happening across the University and local community in order to do our part to mitigate the negative effects of global warming. Today our blog will look at ‘Considering the actions businesses can take on climate change’.

Our University is justly famous for the breadth and depth of its work on Sustainability. This ranges from research on the effect of micro plastics on the oceans, through food and farming, to the effect of resource-driven migration. We are also tackling arguably the biggest problem of all: developing the tools and techniques that will help us to fight climate change.

Our Sustainability Policy is clear that we need to walk the talk and demonstrate that we are supporting a sustainable world in our operations and strategies.

The University of Bristol’s Sustainability team co-ordinates sustainability activity across the organisation, continually innovating to find ways of reducing our environmental impact against a backdrop of growing staff and student numbers, increasingly bespoke teaching and ever more complex research requirements. The team has particular responsibility for waste resource management, energy, water and transport, and engages with staff and students in many different ways through community engagement, biodiversity activities, sustainable food and sustainable procurement.

1. A changing landscape

The team is led by Martin Wiles, who has been with the University since 2001. “Innovation is at the heart of what we do,” says Martin. “Everyone in the sector knows that the fundamentals are changing, and that change is accelerating. It’s difficult to see what the pedagogical, economic or political landscape is going to be even a year ahead. So, we see our activities as being guided by three principles: how do we support excellence in teaching, research and the staff and student experience? How do we reduce resource use whilst saving money? How do we ensure that we are compliant with increasingly complex environmental legislation? We also feel that we have a role in distilling our findings and disseminating good practice to the wider sector.”

2. Sustainable Laboratories

A good example of how this thinking is applied in practice is the Sustainable Labs Initiative, which focuses on improving the safety, sustainability and success of our laboratories. Energy manager Chris Jones says, “We had known for a long time that our highly-serviced labs represent only 5% of our floor area but use 40% of our energy. In recent years, controls for air handling have improved immensely and we have started to roll out best practice, starting with our Synthetic Chemistry building. We have been able to reduce electricity consumption by 30% there whilst still delivering the same level of service.” The project has been implemented by Chris, working with Anna Lewis, the Team’s Sustainable Labs officer.  A former Research Technician herself, Anna works closely with academic and research staff to minimise resource use by better management. “Staff understand the issues,” says Anna, “and they are very happy to help. We can usually achieve better environmental performance and better safety through relatively small changes to our way of working.”

3. Closing the loop on waste

This sentiment is echoed by Rose Rooney, the Environmental Management System (EMS) and Circular Economy Manager. “If we treat everything in isolation, the task of compliance becomes unnecessarily expensive and intrusive in people’s work. Adhering to the EMS processes saves time and aids compliance. A good example is waste. If we are informed early and fully that a consignment of waste needs to be removed, we can deal with it cheaply and easily, often finding a route for it to be reused or recycled. We are moving away from the idea of waste to becoming a circular economy, where the output from one process becomes the input for another.”  She cites the University’s popular and successful Re-store programme, which allows furniture and equipment from one group to be used by another, and The Bristol Big Give, where students’ unwanted items that would normally go to waste at the end of term are collected and sent to be sold for charities. Many tonnes of items are now being reused that might otherwise have gone to landfill.

4. Be The Change

Bristol Big Give is just one example of a number of behaviour change initiatives delivered by the team to encourage the sustainable behaviours as part of work, study and home life. Maev Moran, Communications and Campaigns Assistant, oversees the delivery of these initiatives: “We have found that audiences respond more positively and proactively to messages of empowerment than to negative messages.  Be The Change, a scheme we launched in June, has quickly become the most popular ongoing initiative among University staff. It covers all areas of sustainability while making rewarding everyday actions, creating a step-by-step guide towards reducing our environmental impact both at home and in the workplace. The breadth of the scheme also means we can factor wellbeing in to our ability to have a positive impact, particularly as part of a wider community.”

5. Travel and transport

Amy Heritage is responsible for Transport at the University, including managing the University’s travel plan, facilities for people who walk or cycle to work or study, the University’s bus services (Bristol Unibus), including the new U2 bus service to Langford and initiatives/incentives to encourage behaviour change on all other modes of travel. “Our Staff and students are great at making sustainable travel choices. Our job is to make this as easy as possible.” She says that our travel plan is a key part in ensuring we are acknowledged as a good corporate citizen, and her team is looking at ways of improving the management of University vehicles and making it more attractive to replace meetings that would otherwise have required flights with video conferences.

Future plans

The team are starting the new academic year with plans for plans for efficiency savings on heating, laboratory ventilation and lighting, making sure we are compliant with new legislation, and collaborative work with Computer Science staff on how the operation of building services translates to staff and student wellbeing. There are plans for more renewable energy generation, smart controls for buildings, and adding to our electric vehicle fleet. “Once more, it’s a project about reducing our environmental impact while freeing up resources for excellent teaching and research, and staff and student wellbeing,” says Martin Wiles, “and that’s what we’re here to do.”

—————————–
This blog is written by John Brenton, Sustainability Manager in the University of Bristol’s Sustainability Team.

Read other blogs in this Green Great Britain Week series:
1. Just the tip of the iceberg: Climate research at the Bristol Glaciology Centre
2. Monitoring greenhouse gas emissions: Now more important than ever?
3. Digital future of renewable energy
4. The new carbon economy – transforming waste into a resource
5. Systems thinking: 5 ways to be a more sustainable university
6. Local students + local communities = action on the local environment

Digital future of renewable energy

As part of Green Great Britain Week, supported by BEIS, we are posting a series of blogs throughout the week highlighting what work is going on at the University of Bristol’s Cabot Institute for the Environment to help provide up to date climate science, technology and solutions for government and industry.  We will also be highlighting some of the big sustainability actions happening across the University and local community in order to do our part to mitigate the negative effects of global warming. Today our blog will look at ‘Technologies of the future: clean growth and innovation’.

1. Background

Today over 94% of the energy market in the UK is dominated by the Major Power Producers (MPP) who generate electricity and feed it to households and businesses over the grid [1].

Historically, to cut down on the fuel transportation costs, the major generation plants had to be located close to the fuel sources, i.e., where coal and oil were mined. The generated electricity would then be transmitted through power lines and distribution stations down to the households and businesses who would use the electricity up.

This structure of the industry was based on several constraints:

  • Electricity generation locations are constrained by the location of fossil sources (as it is cheaper and easier to transmit the generated electricity than to move fuel around);
  • Electricity generation requires large investments into large plants (due to economies of scale of the generation technology);
  • Electricity end users are only interested in consumption, and do not want to know much else about electricity itself.

Yet, technological advances as well as the societal understanding of the implications of the fossil fuel use have dramatically changed the framework within which the energy system operates:

  • Renewable generation technologies (such as solar panels, wind turbines, small hydro turbines) are now widely available for individual household and small community use.
  • As (most) renewable generation resources (e.g., solar or wind) are available where consumers are, it is technologically possible and economically affordable to generate and consume electricity locally, without centralised generation and transmission;
  • End users are increasingly interested in the environmental and social impact of the generated electricity, not only in consumption.

All the above, combined with the governmental subsidies for renewables installations (e.g., feed-in-tariffs) have led to a recent growth of micro-generation in the UK (i.e., individuals or organisations with small-scale energy generation, such as domestic wind or solar PV units). Such micro-generators consume their own generated energy and sell any excess back to the grid. Such generation offers the potential for a distributed model of energy generation and consumption that is not reliant on MPPs.

Challenge

Though presently, there is a successful renewables-based ecosystem in the UK, it has been largely driven by governmental subsidies. However, these subsides are now set to be withdrawn. As of March 2019 no new installations will be eligible to feed-in-tariffs. Will this result in fall of the renewables sector, as already experienced by solar PV sector in Spain [2] when their solar PV subsidies were removed? Or can UK micro-generators find another way of ensuring viability of renewable installations?

Opportunities

Research at the University of Bristol suggests that a subsidy-free localised renewables-based energy sector is not only possible but is also the best solution to the energy security and affordability dilemma. Our proposed model for the new, modernised UK energy sector is based around localised, but globally interconnected peer-to-peer energy markets underpinned by digital technology. This is illustrated in Figure 1 below:

Figure 1: Peninsula peer-to-peer energy market (from [6])


2. Peer-to-Peer energy market underpinned by digital platform

In a peer-to-peer energy market any two individuals/households can directly buy  from and sell to each other, without intermediating third parties. These households can be both prosumers (i.e., producing and consuming own renewables-based electricity, as well as selling the excess to others), on simply consumers (if they have not own generation). Yet, unlike most microgrids, this is not an islanded model – which would require complete internal balance of supply and demand –  but rather a “peninsula”. Where the locality experiences shortage or excess generation, the demand/supply are imbalance is resolved through trade with the other localities or the grid at large. The key advantages here are in providing avenues for:

  • Additional income streams to households with microgeneration – where the feed in tariff is no longer pays for the extra generation, the peers who use the energy do. Moreover, the price of the locally generated/consumed energy is more competitive than that of the grid supply as it does not need to pay the same full transmission, distribution, and utilities services charges. (Though I must underline that, as each locality remains interconnected with the gird, the energy costs will still include grid connection and maintenance changes. This is because the intermittency of the renewables generation must be insured against, and grid provides such an insurance and balancing services.)
  • Increasing value proposition of microgeneration and energy storage – the microgenerators are not only getting return to their generation investment, but are also supporting local communities’ energy needs, contributing to the decarbonisation and energy security efforts.
  • Increased control over source of supply – consumers are now able to express their preferences on energy purchase: do they wish to buy solar or wind, from the closest geographically located producer or from the cheapest supplier; do producers wish to donate their excess generation to the local school or to their extended family members, or to sell it to the highest bidder? All these options become viable when peers directly buy and sell from each other.

Such an energy system, however, cannot exist without a reliable and trusted digital platform which will both remove the 3rd party intermediation, and advertise the sale and purchase orders between the trading parties, undertake the users’ preferences-based matching of these orders, ensure security of the transitions, transparency of the trades, and accountability of the transaction participants.

To operate in such market:

  1. the consumers and prosumers would join the platform and publish their preferences (e.g., sell to the highest bidder, or buy solar energy only, etc.);
  2. the participants will they use their smart meter data to periodically (e.g., for every 15 min or half an hour) publish their sale and purchase orders on a digital platform;
  3. for each trading period (e.g., 15 min.) the platform will match best fitting sale and purchase orders, and settle transaction accounts.

Note, (as illustrated in Fig 2) while in the current intermediated market the utilities act as  the contracting parties between the prosumers, consumers and the energy market (see Fig. 2.a), in this peer-to-peer market each prosumer/consumer is the immediate contracting party itself (see Fig. 2.b).

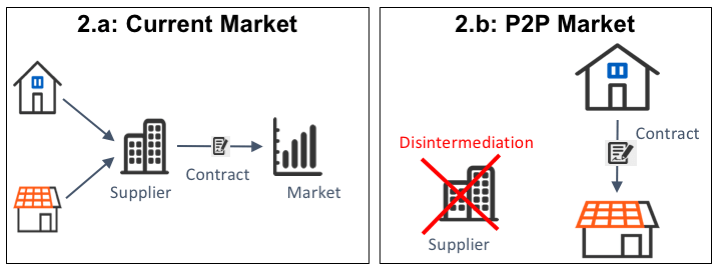
Figure 2: Energy Market Dis-intermediation (from [6])

To realise these demanding requirements, we advocate use of  distributed ledger technology for the energy trading platform [3, 4, 7]. Distributed ledgers (which incorporate blockchain and block-free technologies) are decentralised, distributed databases in which all transactions are immutably recorded. In other words, these are databases which are not controlled by any single company or individual, but are run and maintained by their participating membership. Data in these ledgers is redundantly stored in many locations, and cryptographically secured. As a result, once recorded, the data in the ledger cannot be changed and falsified [1].

The details on how to engineer this platform in such a way that engenders trust and participation is a topic of the HoSEM research project [5] and will be detailed in another blog post. For now, let’s assume that this platform is in successful operation. What are the implication of it on the UK energy market?

3. Implications on energy market

Move to a peer-to-peer energy trading over a distributed ledger will lead to several major changes in the UK’s energy system, to name a few:

  1. First and foremost, it changes the structure of the energy system itself – from centralised fossil-based generation to decentralised, distributed, local renewables–based generation and consumption set up;
  2. The digital technology-based market disintermediation (see section 2) deprecates the role of a trusted 3rd party (utilities in this case), reducing both the cost of transactions (i.e., energy) to the end users and allowing for the best possible preferences match to each participant. Now the suppliers are switched every trading period (e.g., every 15 min.), without any effort or cost to the market participants.
  3. This structure also radically changes the role of the energy user – from the passive consumer to an active prosumer. The end user now matters, as every unit of produced and consumed energy is different. It is different because it is produced in the users’ local area, or is originated from solar/wined/gas sources, or is bought from a friend… Then the price of each energy unit is also different and that difference is decided on basis of the participants preferences.

Clearly, many issues remain to be resolved before this shift to a digitally enabled peer to peer market becomes a reality. These include issues of regulation and licensing (presently households are not allowed to act as suppliers in the UK), grid safety (e.g., current frequency assurance), geographical and population density (e.g., rural areas have more renewable per-person than cities), fairness and pricing (more affluent individuals can afford more generation installations), to name a few. Yet, it is encouraging to see that technologically and economically this future can be here already today.

Footnote

[1] Theoretically it is possible, but practically it is improbable, as record falsification is designed to be prohibitively costly [3].

References

[1] Dep. of Energy and Climate Change Updated energy and emissions projections 2015 Tech. Rep., URL: https://www.gov.uk/government/publications/updated-energy-and-emissions-projections-2015

[2] The rise and fall of solar energy in Spain, URL: http://www.abacoadvisers.com/spain-explained/life-in-spain/news/rise-and-fall-solar-energy-in-spain

[3] R. Chitchyan, J. Murkin, Review of Blockchain Technology and its Expectations: Case of the Energy Sector, URL: https://arxiv.org/abs/1803.03567

[4] J. Murkin, R. Chitchyan, D. Ferguson, Goal-Based Automation of Peer-to-Peer Electricity Trading, URL: https://link.springer.com/chapter/10.1007/978-3-319-65687-8_13

[5] Household-Supplier Energy Market, URL: https://gtr.ukri.org/projects?ref=EP%2FP031838%2F1

[6] Used from J. Murkin, R. Chitchyan, D. Ferguson, Towards peer-to-peer electricity trading in the UK, Presented at All Energy 2018, URL: https://reedexpo.app.box.com/s/plwhcfaqp6pnhxc8mcjznh7jtkevg9h1/file/292636529562

[7] J.Murkin, Automation of peer-to-peer electricity trading, blog post at https://www.edfenergy.com/about/energy-innovation/innovation-blog/research-development-peer-to-peer-trading

———————————-
This blog is written by Cabot Institute member Ruzanna Chitchyan from the University of Bristol Faculty of Engineering and has been reposted from Refactoring Energy Systems blog.

Ruzanna Chitchyan

Read other blogs in this Green Great Britain Week series:
1. Just the tip of the iceberg: Climate research at the Bristol Glaciology Centre
2. Monitoring greenhouse gas emissions: Now more important than ever?
3. Digital future of renewable energy
4. The new carbon economy – transforming waste into a resource
5. Systems thinking: 5 ways to be a more sustainable university
6. Local students + local communities = action on the local environment

The new carbon economy – transforming waste into a resource

As part of Green Great Britain Week, supported by BEIS, we are posting a series of blogs throughout the week highlighting what work is going on at the University of Bristol’s Cabot Institute for the Environment to help provide up to date climate science, technology and solutions for government and industry.  We will also be highlighting some of the big sustainability actions happening across the University and local community in order to do our part to mitigate the negative effects of global warming. Today our blog will look at ‘Technologies of the future: clean growth and innovation’.

On Monday 8 October 2018, the IPCC released a special report which calls upon world governments to enact policies which will limit global warming to 1.5°C compared with pre-industrial levels, failure to do so will drastically increase the probability of ecosystem collapses, extreme weather events and complete melting of Arctic sea ice. Success will require “rapid and far-reaching” actions in the way we live, move, produce and consume.

So, what comes to mind when you hear carbon dioxide – a greenhouse gas? A waste product? You’re not wrong to think that given the predicament that our planet faces, but this article is going to tell the other side of the story which you already know but is often forgotten.

For over a billion years, carbon dioxide has been trapped and transformed, almost miraculously, into an innumerable, rich and complex family of organic molecules and materials by photosynthetic organisms. Without this process, life as we know simply would not have evolved. Look around you, – I dare say that the story of carbon dioxide is weaved, one way or another into all the objects you see around you in this moment. Whether it’s the carbon atoms within the material itself – or that old fossilised sourced of carbon was used to smelt, melt or fabricate it.

The great growth and development of the last two centuries has been defined by humanity’s use of fossilised carbon which drove the first and second industrial revolutions. But now – the limitations of those very revolutions are staring us in the face and a new revolution is already underway, albeit it quietly.

An industrial revolution is said to occur when there is a step change in three forms of technology, Information, Transport and Energy. The step change that I will discuss here is the use of carbon dioxide coupled with renewable energy systems to deliver a circular carbon economy that aims to be sustainable, carbon neutral at worst and carbon negative at best. This burgeoning field comes under the name carbon capture and utilisation (CCU). CCU, represents a broad range of chemical processes that will most directly impact energy storage and generation and the production of chemical commodities including plastics and building aggregates such as limestone.

In our research we are developing catalysts made of metal nanoparticles to activate and react CO2 to form chemicals such as carbon monoxide (CO), formic acid, methanol and acetate. They be simple molecules – but they have significant industrial relevance, are made on vast scales, are energy intensive to produce, and all originate in some way from coal. The methods that we are investigating while being more technically challenging, consume just three inputs – CO2, water and an electrical current. We use a device called an electrolyser, it uses electricity to break chemical bonds and form new ones. The catalyst sits on the electrodes. At the anode, water is broken into positively charged hydrogen ions called protons and oxygen, while at the opposite electrode, the cathode, CO2 reacts with the protons, H+, to form new molecules. It sounds simple but encouraging CO2 to react is not easy, compared to most molecules, CO2 is a stubborn reactant. It needs the right environment and some energy such as heat, electricity or light to activate it to form products of higher energy content. The chemicals that can be produced by this process are industrially significant, they are used in chemical synthesis, as solvents, reactants and many other things. CO for example can be built up to form cleaner burning petroleum/diesel-like fuels, oils, lubricants and other products derived by the petrochemical industry.

Formic acid and methanol may be used to generate energy, they can be oxidised back to CO2 and H2O using a device called a fuel cell to deliver electricity efficiently without combustion. One day we could see electrically driven cars not powered by batteries or compressed hydrogen but by methanol which has a higher volumetric energy density than both batteries and hydrogen. Batteries are heavy, too short-lived and use high quantities of low abundance metals such as lithium and cobalt – meaning their supply chains could suffer critical issues in the future. While the compression of hydrogen is an energy intensive process which poses greater safety challenges.

However, there are still many hurdles to overcome. I recently went to the Joint European Summer School on Fuel Cell, Electrolyser and Battery Technologies. There I learned about the technical and economic challenges from an academic and industrial perspective. In an introductory lecture, Jens Oluf Jensen was asked “When will we run out of fossil fuels?”, his answer “Not soon enough!”. An obvious answer but there is something I wish to unpick. The task for scientists is not just to make technologies like CO2 capture, CO2 conversion and fuel cells practical – which I would argue is already the case for some renewable technological processes. The greatest challenge is to make them cost competitive with their oil-based equivalents. A gamechanger in this field will be the day that politicians enact policies which incorporate the cost to the environment in the price of energy and materials derived from fossil fuels, and even go so far as to subsidise the cost of energy and materials-based on their ability to avoid or trap carbon dioxide.

Even without such political input there is still hope as we’ve seen the cost of solar and wind drop dramatically, lower than some fossil fuel-based power sources and only with limited government support. Already there are companies springing up in the CCU sector. Companies like Climeworks and Carbon Engineering are demonstrating technology that can trap CO2 using a process known as Direct Air Capture (DAC). Carbon Engineering is going even further and developing a technology they call Air to Fuels™. They use CO2 from the air, hydrogen split from water and clean electricity to generate synthetic transportation fuels such as gasoline, diesel or jet fuel. You may question why we should need these fuels given the rise of battery powered vehicles but a better solution for fuelling heavy goods vehicles, cargo ships and long-haul flights is at the very least a decade way.

In 1975, Primo Levi wrote a story about a carbon dioxide molecule and he said in relation to photosynthesis “dear colleagues, when we learn to do likewise we will be sicut Deus [like God], and we will have also solved the problem of hunger in the world.”. The circular carbon economy may still be in its infancy, but the seeds have sprouted. Unlike the first and second industrial revolution, the 3rd industrial revolution will not be dependent on one single energy source but will be a highly interdependent network of technologies that support and complement each other in the aim of sustainability, just like nature itself.

——————————————
This blog is written by Cabot Institute member Gaël Gobaille-Shaw, University of Bristol School of Chemistry. He is currently designing new electrocatalysts for the conversion of CO2 to liquid fuels.
For updates on this work, follow @CatalysisCDT @Gael_Gobaille and @UoB_Electrochem on Twitter.  Follow #GreenGB for updates on the Green Great Britain Week.

Gael Gobaille-Shaw

Read other blogs in this Green Great Britain Week series:
1. Just the tip of the iceberg: Climate research at the Bristol Glaciology Centre
2. Monitoring greenhouse gas emissions: Now more important than ever?
3. Digital future of renewable energy
4. The new carbon economy – transforming waste into a resource
5. Systems thinking: 5 ways to be a more sustainable university
6. Local students + local communities = action on the local environment


Monitoring greenhouse gas emissions: Now more important than ever?

As part of Green Great Britain Week, supported by BEIS, we are posting a series of blogs throughout the week highlighting what work is going on at the University of Bristol’s Cabot Institute for the Environment to help provide up to date climate science, technology and solutions for government and industry.  We will also be highlighting some of the big sustainability actions happening across the University and local community in order to do our part to mitigate the negative effects of global warming. Today our blog will look at ‘Explaining the latest science on climate change’.

The IPCC report

On 8 October 2018 the Intergovernmental Panel on Climate Change (IPCC) [1] published their special report on Global Warming of 1.5 ˚C. As little as 24 hours after the report had been published, the results of the report were already receiving extensive global coverage in the media, with BBC News describing the report as the “final call”. The BBC News article also explicitly mentions that this is “the most extensive warning yet on the risks of rising global temperatures. Their dramatic report on keeping that rise under 1.5 ˚C states that the world is now completely off track, heading instead towards 3 ˚C. Staying below 1.5 ˚C will require ‘rapid, far-reaching and unprecedented changes in all aspects of society’ [2].”

Reading the report has quite honestly been somewhat overwhelming but also necessary to understand exactly what we are in for. And as much as I understand the difficulty one might face either with the technical terms of the report or even the volume of information, I would really encourage you to give it a read. This special report covers a wide range of subjects from oceans, ice and flooding to crops, health and economy. However, if you do find that the chapters themselves are too lengthy or difficult, there is an amazing interactive, and very easy way that will help you explore the impacts of a 1.5 ˚C, 2 ˚C and beyond on Carbon Brief’s website.

There are two distinct parts in the IPCC special report. The full technical report that consists of 5 chapters and a short summary for policy makers (SPM). The SPM clearly states that “Estimated anthropogenic global warming matches the level of observed warming to within ±20 %” which translates into ‘almost 100 % of the warming is the result of human activity’ [3] [4].

We know for a fact that human activity is warming the planet

One outcome of this “human activity” that we often discuss is the emission of greenhouse gases (GHGs). Through various types of activities, whether that is agriculture, deforestation or burning fossil fuels, GHGs are emitted to the atmosphere. Without going too much into the chemistry and physics, what these GHGs do is change the mixing ratios within the atmosphere, resulting in greater absorbance of infrared radiation. And it is this change in the composition of our atmosphere that we refer to as the manmade greenhouse gas effect which also leads to the warming described in the IPCC report. But far more than the warming effect itself, global warming has all sorts of impacts most of which you can explore through the interactive link above.

Greenhouse gases and a long history of monitoring

Some of the ‘usual suspects’ in the discussion of GHG emissions are carbon dioxide (CO2), methane (CH4) and nitrous oxide (N2O) (often described as the ‘major’ greenhouse gases [5]). However, an often-overlooked set of halogenated greenhouse gases are playing an increasingly large role in anthropogenic driven climate change. Gases like perfluorocarbons (PFCs) and hydrofluorocarbons (HFCs) are compounds that are emitted through some form of human activity. In the case of PFCs for example, the GHGs CF4 and C2F6 are two of the most volatile and long-lived gases monitored under the Kyoto protocol [6] and they are both primarily emitted through or during industrial processes. In contrast, HFCs are used widely as coolants in refrigerators and air-conditioning units, as blowing agents in foam manufacture and propellants in aerosols. They were originally introduced to replace ozone-depleting gases such as chlorofluorocarbons (CFCs), but like their predecessors, are potent greenhouse gases. Given the long lifetime of many of these halogenated gases, current emissions will influence the climate system for decades to come.

In order to monitor the accumulation of these gases in atmosphere, high-precision measurements are required. Through projects such as the Advanced Global Atmospheric Gases Experiment (AGAGE) [7] (figure 1 [8]) that has been measuring the composition of the global atmosphere continuously since 1978 and the National Oceanic and Atmospheric Administration’s Earth System Research Laboratory Global Monitoring Division, scientists have tracked the atmospheric concentrations of climate forcing gases from as far back as 1950s [9].

Figure 1: The AGAGE network

The Atmospheric Chemistry Research Group (ACRG) Chemistry Department, University of Bristol

The ACRG carries out research in the UK and worldwide in collaboration with other atmospheric chemistry research centres, universities and third parties. In the UK, the ACRG runs the UK Deriving Emissions linked to Climate Change network (DECC) [10], funded by the Department for Business, Energy and Industrial Strategy (BEIS) to measure atmospheric GHG and ozone depleting substances over the UK. These measurements are used in elaborate mathematical models to create top-down emission estimates for the UK and verify the UK GHG inventories submitted to the United Nations Framework Convention for Climate Change (UNFCCC) as part of the Kyoto protocol. Worldwide, the group is involved in the AGAGE network, monitoring global background levels of a wide range of GHGs. The ACRG runs 2 of the 9 global background stations under the AGAGE programme. One of these is the Mace Head station (Figure 2) on the west coast of Ireland, which is ideally placed for resolving northern hemispheric baseline air amongst European pollution events. The other AGAGE research station managed by the ACRG is the site at Ragged Point, Barbados. This site just north of the tropics, sits on the eastern edge of the island of Barbados and is directly exposed to the Atlantic. The researchers in ACRG study a variety of GHGs and a very large range of topics from maintaining instrument suites to ensuring the quality of the resulting data so that it can be used in modelling studies.

Figure 2: The Mace Head Station (Credit: Dr Kieran Stanley)

Why are measuring stations and networks like AGAGE so valuable and more important than ever?

The answer to this question is straightforward. Without measurement stations and their underlying networks, we would have very few means [11] by which to measure the accumulation of GHGs in the global atmosphere, and consequently no way of evaluating their emissions without relying on statistics from the industries that emit them. The current IPCC report is underpinned by such measurements, which allow scientists to estimate the impact of anthropogenic activity on past, present and future climates.

From Mauna Loa and its 60 -year record of atmospheric CO2 [12], to unexpected growth in emissions of banned substances such as CFC – 11 [13] and monitoring the accumulation of extremely long-lived greenhouse gases in the global atmosphere, atmospheric measurements stations have been our inside man when it comes to keeping track of what is happening in our atmosphere and to what extent human activities are altering its composition.

Perhaps now more than ever, in the light of the IPCC report, we can appreciate the importance of the data that have been collected over decades but also, the efforts of those who have been directly or indirectly involved in this kind of work.  Continuing and expanding the measurement networks for these gases is and will be even more vital for a continued understanding of global and regional GHG emission trends.

References

[1] http://www.ipcc.ch/
[2]  https://www.bbc.co.uk/news/science-environment-45775309
[3]  http://report.ipcc.ch/sr15/pdf/sr15_spm_final.pdf
[4]  https://www.carbonbrief.org/analysis-why-scientists-think-100-of-global-warming-is-due-to-humans
[5]  https://www.c2es.org/content/main-greenhouse-gases/
[6]  https://www.atmos-chem-phys.net/10/5145/2010/acp-10-5145-2010.pdf
[7]  https://agage.mit.edu/
[8]  https://agage.mit.edu/
[9]  https://www.esrl.noaa.gov/gmd/about/aboutgmd.html
[10]  http://www.bristol.ac.uk/chemistry/research/acrg/current/decc.html
[11]  https://www.co2.earth/co2-ice-core-data
[12]  https://www.co2.earth/daily-co2
[13]  https://www.theguardian.com/environment/2018/may/16/mysterious-rise-in-banned-ozone-destroying-chemical-shocks-scientists

—————————-
This blog is written by Cabot Institute members Eleni Michalopoulou, Dr Dan SayDr Kieran Stanley and Professor Simon O’Doherty from the University of Bristol’s School of Chemistry.

Dan Say
Eleni Michalopoulou


Read other blogs in this Green Great Britain Week series:
1. Just the tip of the iceberg: Climate research at the Bristol Glaciology Centre
2. Monitoring greenhouse gas emissions: Now more important than ever?
3. Digital future of renewable energy
4. The new carbon economy – transforming waste into a resource
5. Systems thinking: 5 ways to be a more sustainable university
6. Local students + local communities = action on the local environment

Just the tip of the iceberg: Climate research at the Bristol Glaciology Centre

As part of Green Great Britain Week, supported by BEIS, we are posting a series of blogs throughout the week highlighting what work is going on at the University of Bristol’s Cabot Institute for the Environment to help provide up to date climate science, technology and solutions for government and industry.  We will also be highlighting some of the big sustainability actions happening across the University and local community in order to do our part to mitigate the negative effects of global warming. Today our blog will look at ‘Explaining the latest science on climate change’.

Last week the Intergovernmental Panel on Climate Change (IPCC) released its special report on the impact of global warming of 1.5˚C. Professor Tony Payne – Head of the University of Bristol’s School of Geographical Sciences and Bristol Glaciology Centre (BGC) member – is one of the lead authors on the report, which highlights the increased threats of a 2˚C versus 1.5˚C warmer world. The report also lays out the mitigation pathways that must be taken if we are to meet the challenge of keeping global warming to 1.5˚C above pre-industrial levels.

The core of the report is a synthesis of over 6000 scientific papers detailing our current understanding of the climate system, and here at the BGC our research is focused on the role of the cryosphere in that system. The cryosphere, which refers to all the snow, ice and permafrost on the planet, is changing rapidly under global warming, and understanding how it will continue to evolve is critical for predicting our future climate. This is primarily due to the positive feedback loops in which it is involved, whereby a small change in conditions sets off a sequence of processes that reinforce and amplify the initial change. Despite the name, in the context of our current climate these positive feedback loops are almost always bad news and are responsible for some of the “tipping points” that could lead to runaway changes in the climate system.

I hope this post will give you a quick tour of just some of the research being carried out by scientists at the BGC, studying the way in which mountain glaciers, sea ice and the two great ice sheets of Antarctica and Greenland are responding to and influencing our changing climate.

Ice sheets

My own research examines ice flow at the margins of Antarctica. The Antarctic ice sheet is fringed by floating ice shelves, fed by large glaciers and ice streams that flow from the heart of the ice sheet towards the coast (see Figure 1). These ice shelves can provide forces that resist the glaciers that flow into them, reducing their speed and the amount of ice that enters the ocean. Crucially, once ice flows off the land and begins to float it causes the sea level to rise. My work is in modelling the interaction between ice shelves and the rest of the ice sheet to better quantify the role that ice shelves have in restraining ice loss from the continent. This will help to reduce the uncertainty in our predictions of future sea level rise, as the thinning and collapse of Antarctic ice shelves that we have seen in recent decades looks set to continue.

Figure 1: Schematic of the Antarctic ice sheet grounding line. Image credit: Bethan Davies, www.AntarcticGlaciers.org

To model ice flow in Antarctica with any success it is crucial to know the exact location of the point at which the ice sheet begins to float, called the ‘grounding line’. Research on this within the BGC is being done by Dr Geoffrey Dawson and Professor Jonathan Bamber, using data from the European Space Agency’s CryoSat-2 satellite. Their method determines the location of the grounding line by measuring the rise and fall of the floating ice shelves under the influence of ocean tides. Recently published work from this project has improved our knowledge of the grounding line location near the Echelmeyer ice stream in West Antarctica and this method is currently being rolled out across the rest of the ice sheet [1].

In the Northern Hemisphere, the Black and Bloom project led by Professor Martyn Tranter is studying ice algae on the second largest ice mass on Earth, the Greenland Ice Sheet (GrIS). The large, dark regions that appear on the GrIS in the summer are, in part, down to blooms of algae growing in the presence of meltwater on the ice sheet (see Figure 2). This bloom is darker than the surrounding ice surface and so reduces the albedo (a measure, between 0 and 1, of a surface’s reflectivity). A reduced ice sheet albedo means more of the sun’s energy is absorbed and the surface becomes warmer, which produces more meltwater, and more algae, leading to more energy absorption in a classic example of a positive feedback loop. The aim of the project, a partnership between biologists and glaciologists within the BGC, is to take measurements of algal growth and to incorporate their effect on albedo into climate models. A recent paper from the group, led by Dr Chris Williamson, revealed the abundance and species of microbial life that are growing on the GrIS [2], and this summer the team returned to the field to extend their work to more northerly regions of the ice sheet.

Figure 2: Bags of surface ice collected on the Greenland Ice Sheet showing the change in albedo with (from left to right) low, medium and high amounts of algae present.

Sea ice

Moving from land-based ice and into the ocean, Arctic sea ice is also being studied within the BGC. Regions of the Arctic have warmed at over 3 times the global average during the last century and there has consequently been a dramatic decline in the amount of sea ice that survives the summer melt season. The minimum, summer Arctic sea ice extent is currently declining at 13.2% per decade. Predicting the future of Arctic sea ice is critical for understanding global climate change due to the presence of another positive feedback loop: reduced summer sea ice replaces the white, high albedo ice surface with the darker, low albedo, ocean surface. This means that more solar energy is absorbed, raising surface temperatures and increasing ice melt, leading to more exposed ocean and further warming.

Dr Jack Landy has used remote sensing data from satellites, including CryoSat-2 and ICESat, to measure the roughness of Arctic sea ice and to model the impact that changing roughness has on albedo (see Figure 3). The roughness of the sea ice controls the size of the meltwater ponds that can form on the surface. With less sea ice lasting through multiple summer melt seasons, the trend is for Arctic sea ice to become smoother, allowing larger and larger ponds to form which, again, have a lower albedo than the ice surface they sit on, creating yet another positive feedback loop [3].

Figure 3: Panels a and b are predictions for summer (June to August) Arctic sea ice albedo based upon ice roughness observations made in March of 2005 and 2007 respectively. Panels c and d show the actual, observed summer albedo in those years. Image credit: Dr Jack Landy [3].

Mountain glaciers

A third element of the cryosphere studied at the BGC are glaciers in high mountain regions such as the Andes and the Himalayas. Led by Professor Jemma Wadham, the new Director of the Cabot Institute, this work focuses on the biology and chemistry of the meltwater produced from these glaciers. This summer a team of postgraduate researchers from the BGC – Rory Burford, Sarah Tingey and Guillaume Lamarche-Gagnon – travelled to the Himalayas in partnership with Jawaharlal Nehru University, New Delhi, to collect meltwater samples from the streams emanating from the Chhota Shigri glacier. These streams eventually flow into the Indus river, a vital water source for agriculture and industry in Pakistan. It is therefore crucial to understand how the quality of this water source might change in a warmer climate. Mercury, for example, is precipitated out of the atmosphere by snowfall and can collect and become concentrated within these high mountain glaciers. In the shorter term, if these glaciers continue to melt more rapidly, larger amounts of mercury will be released into the environment and will impact the quality of water that supports millions of people. On longer time scales, the retreat and reduction in volume of the Himalayan glaciers will reduce the amount of water supplied to communities downstream, with huge implications for water security in the region.

Figure 4: Photo from Himalayan fieldwork. Image credit: Guillaume Lamarche-Gagnon

Outlook

This is just the tip of the BGC research iceberg, with field data from this summer currently being pored over and new questions being developed. This work will hopefully inform the upcoming IPCC special report on the oceans and cryosphere (due in 2019), which is set to be another significant chance to assess and share our understanding of the ice on our planet and what it means for the challenges we have set for ourselves in tackling climate change.

References

[1] Dawson, G. J., & Bamber, J. L. (2017). Antarctic grounding line mapping from CryoSat‐2 radar altimetry. Geophysical Research Letters, 44, 11,886–11,893. https://doi.org/10.1002/2017GL075589

[2] Williamson, C. J., Anesio, A. M., Cook, J., Tedstone, A., Poniecka, E., Holland, A., Fagan, D., Tranter, M., & Yallop, M. L. (2018). ‘Ice algal bloom development on the surface of the Greenland Ice Sheet’. FEMS Microbiology Ecology, 94,3. https://doi.org/10.1093/femsec/fiy025

[3] Landy, J. C., J. K. Ehn, and D. G. Barber (2015). Albedo feedback enhanced by smoother Arctic sea ice. Geophysical Research Letters, 42, 10,714–10,720. https://doi.org/10.1002/2015GL066712

——————————–
This blog was written by Cabot Institute member Tom Mitcham. He is a PhD student in the School of Geographical Sciences at the University of Bristol and is studying the ice dynamics of Antarctic ice shelves and their tributary glaciers.

Tom Mitcham

Read other blogs in this Green Great Britain Week series:
1. Just the tip of the iceberg: Climate research at the Bristol Glaciology Centre
2. Monitoring greenhouse gas emissions: Now more important than ever?
3. Digital future of renewable energy
4. The new carbon economy – transforming waste into a resource
5. Systems thinking: 5 ways to be a more sustainable university
6. Local students + local communities = action on the local environment

Micro Hydro manufacturing in Nepal: A visit to Nepal Yantra Shala Energy

Topaz Maitland with a micro hydro turbine

For nine months I am working at an NGO called People, Energy and Environment Development Association (PEEDA), in Kathmandu, Nepal. PEEDA is an NGO dedicated to improving the livelihoods of communities, particularly the poor, by collective utilization of renewable energy resources, while ensuring due care for the environment.

My primary project is the design of a micro hydro Turgo Turbine, a small turbine which is not commonly used in Nepal. The project aims to investigate this turbine, and its potential for us in Nepal.

Nepal Yantrashala Energy (NYSE) is one of the partners on this project. NYSE is a manufacturing company specialising in micro hydro systems and I went to visit their workshop to learn about how they operate.

Micro Hydro and NYSE

At NYSE, they manufacture Pelton, Crossflow and Propeller turbines. If a client comes to them with the required head (height over which the water will drop) and flow rate, NYSE can manufacture an appropriate turbine. Every turbine is unique to the site it will be installed into.

Rough cast of a  Pelton runner cup, alongside finished cups


A Pelton turbine runner


Crossflow runners are made using strips of pipe as blades and machined runner plates to hold the blades
A Crossflow turbine runner

The aim of this project is to develop a design for a Turgo turbine (an example turgo turbine system pictured below), so that NYSE might be able to manufacture one for any given head and flow. This means that engineers such as myself need to understand how our new optimised design will operate over a range of flows and heads.

Micro Hydro in Nepal

Nepal is second only to Brazil in term of hydropower potential (1). Despite this, crippling underdevelopment and a mixture of geographical, political and economical factors leave the country lacking the resources to exploit and develop this potential (1).

Dr. Suman Pradhan, Project Coordinator at NYSE, told us that the first ever Crossflow Turbine was installed in Nepal in 1961. His father was actually one of those involved in the project. Ironically, today Nepal has to import or buy the designs for such Crossflow turbines from abroad.

Universities in Nepal do have turbine testing facilities, but funding for PhDs and other hydropower research is still heavily dependent upon foreign investment. A key area of opportunity for Nepal is the development of such research facilities. With so much hydropower potential, good work could be done to improve the performance of hydropower to suit demand and manufacturers within Nepal.

Dr. Suman hopes that this new Turgo Turbine design, alongside other designs he is trying to obtain, may widen the hydropower options available and manufacturable in Nepal.

References

1) Sovacool, B. K., Dhakal, S., Gippner, O. & Bambawale, M. J., 2013. Peeling the Energy Pickle: Expert Perceptions on Overcoming Nepal’s Energy Crisis. South Asia: Journal of South Asian Studies.

———————
This blog was written by Topaz Maitland, a University of Bristol Engineering Design Student on 3rd year industry placement.