Detectable impacts of Climate Change in the UK; a new review for the next Climate Change Risk Assessment

2022 was another year of “unprecedented” weather. Provisional figures indicate that it was the warmest so far recorded, with almost every month hotter than average. Much of the country had a notably mild New Year, despite the cold snap in mid-December. This was preceded by the third warmest autumn on record, and that by a scorching summer, with the hottest day ever recorded in July. But summer’s heat waves were also accompanied by a rise in the number of daily deaths across the country. People around the world are becoming increasingly more aware of events like these, and their impact in the UK is particularly concerning amidst the ongoing cost-of-living, energy, and NHS crises.

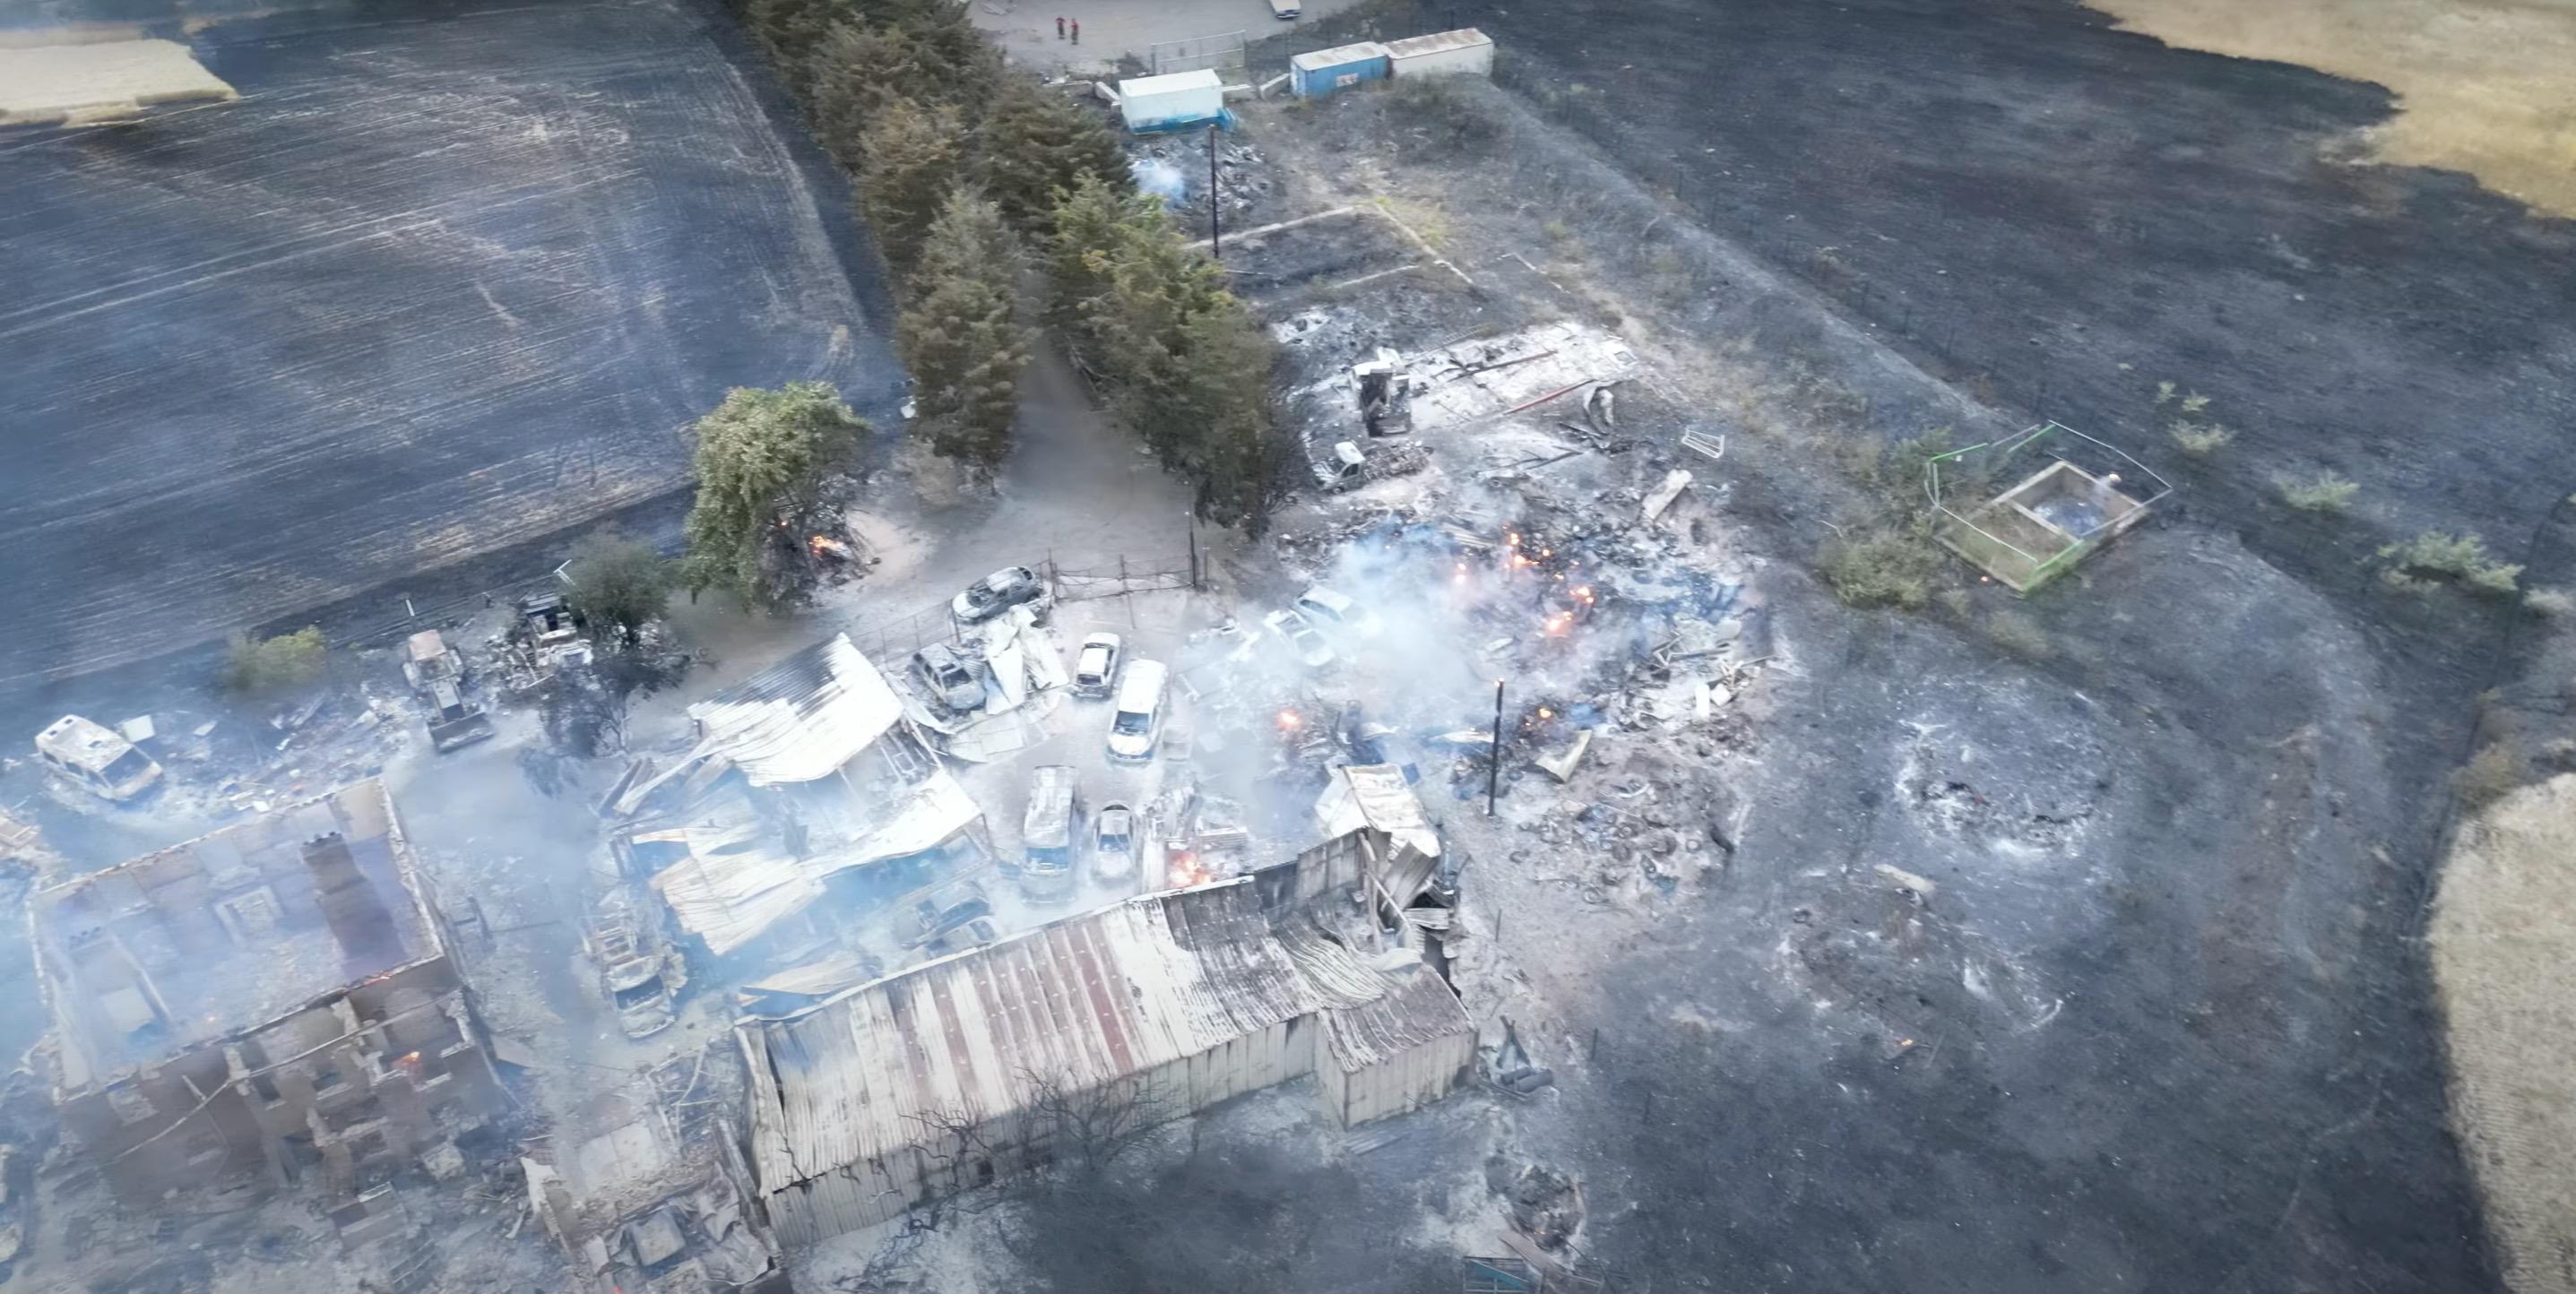
Aerial view of the Wennington wildfire, London, 19 July 2022. Source: Harrison Healey, Wikimedia Commons (CC BY 3.0).

Ahead of the Fourth UK Climate Change Risk Assessment (CCRA4), the Climate Change Committee (CCC) are asking what we know about the impact of past and present climate change on natural and human systems here in the UK specifically. At the global level, the 2021 IPCC sixth assessment working group I (AR6 WGI) report concluded: “It is unequivocal that human influence has warmed the atmosphere, ocean and land.” This single sentence has been informed by decades of research by people at the cutting edge of climate science, and the evidence to support it has grown stronger in every IPCC report since they began. The report goes on to say: “Human-induced climate change is already affecting many weather and climate extremes in every region across the globe.” In last year’s follow-up AR6 WGII report on impacts, adaptation, and vulnerability, an extensive assessment of the science led to the conclusion that the magnitude and proliferation of extremes caused by human-induced climate change were having widespread, adverse impacts on both nature and people. Last summer’s heatwaves, and the concurrent dangers to health, homes, and the environment, were a graphic illustration of the nature of such human-induced impacts.

The study of impacts that informed this conclusion is the remit of climate scientists who specialise in “detection and attribution”. This is about looking at what is changing around us and being able to pinpoint the cause(s) – and particularly, whether human-induced climate change is at the root. To inform CCRA4, the CCC have commissioned a joint Bristol and Exeter University team to conduct a comprehensive review of the detection and attribution of climate change in the UK. The first part will cover the detection and attribution of weather and climate changes in the UK, relevant to specific “Climate Impact Drivers”. The second will cover attribution of impacts on societal, infrastructural, economic, and biodiversity sectors. We aim to find out what studies have been done so far, where the gaps are, and whether they can be filled, or if they would require substantial new methodological or data advances. We aim to identify variables which are key drivers of multiple impacts, and, importantly, where further attribution analysis is needed – especially when the impacts are critical for UK risk.

Detection and attribution is a rapidly evolving field, with focus only relatively recently moving from meteorological attribution (e.g., weather extremes) to impact attribution (e.g., consequences for humans and ecosystems). Our systematic review of the literature and final report will be key to tying it all together, especially with the UK focus required by the CCC. But to be able to present the most up-to-date findings, and thus make informed recommendations, we need to ensure that we have considered all relevant studies. So, if you, or someone you know, has published on this topic – whether UK specific or not – we’d like to know about it! Help shape and inform the next UK Climate Change Risk Assessment.

————————-

This blog was written by Regan Mudhar, Professor Dann Mitchell (University of Bristol), Professor Richard Betts and Professor Peter Stott (University of Exeter/UK Met Office).

Climate change isn’t just making cyclones worse, it’s making the floods they cause worse too – new research

People take refuge on a sports ground following flooding caused by Cyclone Idai in Mozambique.
DFID/Flickr, CC BY-SA

Laurence Hawker, University of Bristol; Dann Mitchell, University of Bristol, and Natalie Lord, University of Bristol

Super cyclones, known as hurricanes or typhoons in different parts of the world, are among the most destructive weather events on our planet.

Although wind speeds within these storms can reach 270 km/h, the largest loss of life comes from the flooding they cause – known as a “storm surge” – when sea water is pushed onto the coast. Climate change is predicted to worsen these floods, swelling cyclone clouds with more water and driving rising sea levels that allow storm surges to be blown further inland.

In May 2020, Super Cyclone Amphan hit the India-Bangladesh border, bringing heavy rainfall and strong winds and affecting more than 13 million citizens. The cyclone also caused storm surges of 2-4 metres, flooding coastal regions in the Bay of Bengal.

While over the ocean, this category five storm – that’s a storm’s highest possible rating – became the strongest cyclone to have formed in the Bay of Bengal since 1999, reaching wind speeds of up to 260 km/h. Although it weakened to a category two storm following landfall, it remained the strongest cyclone to hit the Ganges Delta since 2007.

Amphan had severe consequences for people, agriculture, the local economy and the environment. It tragically resulted in more than 120 deaths, as well as damaging or destroying homes and power grids: leaving millions without electricity or communication in the midst of an ongoing pandemic.

Relief and aid efforts were hampered by flood damage to roads and bridges, as well as by coronavirus restrictions. Large areas of crops including rice, sesame and mangos were damaged, and fertile soils were either washed away or contaminated by saline sea water. Overall, Super Cyclone Amphan was the costliest event ever recorded in the North Indian Ocean, resulting in over $13 billion (£10 billion) of damage.

Two people assess a tree that has fallen across a road
In Kolkata, India, Super Cyclone Amphan caused widespread damage.
Indrajit Das/Wikimedia

In a recent study led by the University of Bristol and drawing on research from Bangladesh and France, we’ve investigated how the effects of storm surges like that caused by Amphan on the populations of India and Bangladesh might change under different future climate and population scenarios.

Amphan: Mark II

Rising sea levels – thanks largely to melting glaciers and ice sheets – appear to be behind the greatest uptick in future risk from cyclone flooding, since they allow storm surges to reach further inland. It’s therefore key to understand and predict how higher sea levels might exacerbate storm-driven flooding, in order to minimise loss and damage in coastal regions.

Our research used climate models from CMIP6, the latest in a series of projects aiming to improve our understanding of climate by comparing simulations produced by different modelling groups around the world. First we modelled future sea-level rise according to different future emissions scenarios, then we added that data to storm surge estimates taken from a model of Super Cyclone Amphan.

We ran three scenarios: a low emission scenario, a business-as-usual scenario and a high emission scenario. And in addition to modelling sea-level rise, we also estimated future populations across India and Bangladesh to assess how many more people storm surges could affect. In most cases, we found that populations are likely to rise: especially in urban areas.

Our findings were clear: exposure to flooding from cyclone storm surges is extremely likely to increase. In India, exposure increase ranged from 50-90% for the lowest emission scenario, to a 250% increase for the highest emission scenario. In Bangladesh, we found a 0-20% exposure increase for the lowest emission scenario and a 60-70% increase for the highest emission scenario. The difference in exposure between the two countries is mostly due to declining coastal populations as a result of urban migration inland.

Imagine we’re now in 2100. Even in a scenario where we’ve managed to keep global emissions relatively low, the local population exposed to storm surge flooding from an event like Amphan will have jumped by ~350,000. Compare this to a high emission scenario, where an extra 1.35 million people will now be exposed to flooding. And for flood depths of over one metre – a depth that poses immediate danger to life – almost half a million more people will be exposed to storm surge flooding in a high emission scenario, compared to a low emission scenario.

A composite satellite image of a large white cyclone
A satellite image shows Amphan approaching the coasts of India and Bangladesh.
Pierre Markuse/Wikimedia

This research provides yet more support for rapidly and permanently reducing our greenhouse gas emissions to keep global warming at 1.5°C above pre-industrial levels.

Although we’ve focused on storm surge flooding, other cyclone-related hazards are also projected to worsen, including deadly heatwaves following cyclones hitting land. And in the case of Amphan, interplay between climate change and coronavirus likely made the situation for people on the ground far worse. As the world warms, we mustn’t avoid the reality that pandemics and other climate-related crises are only forecast to increase.

Urgent action on emissions is vital to protect highly climate-vulnerable countries from the fatal effects of extreme weather. Amphan Mark II need not be as destructive as we’ve projected if the world’s governments act now to meet Paris agreement climate goals.The Conversation

—————————–

This blog is written by Cabot Institute for the Environment members Dr Laurence Hawker, Senior Research Associate in Geography, University of Bristol; Professor Dann Mitchell, Professor of Climate Science, University of Bristol, and Dr Natalie Lord, Honorary Research Associate in Climate Science, University of Bristol

This article is republished from The Conversation under a Creative Commons license. Read the original article.

Wheel of Time is set thousands of years from now, yet it’s still burdened with today’s climate change

The epic fantasy series has been turned into a tv show on Amazon.
JAN THIJS/AMAZON STUDIOS

Wheel of Time, the 14-book epic fantasy now turned into an Amazon Prime TV series, is a medieval-style adventure set in the Third Age of the World of the Wheel. While not explicit in the storyline, notes from the late author suggest that the First Age was actually modern-day Earth, which ended with a dramatic event (perhaps even climate change). From these notes, we estimate the show takes place around 18,000 years from today.

For climate scientists like us, this poses an interesting question: would today’s climate change still be experienced in the World of the Wheel, even after all those centuries?

About a quarter of carbon dioxide emitted today will remain in the atmosphere even 18,000 years from now. According to biogeochemistry models, carbon dioxide levels could be as high as 1,100 parts per million (ppm) at that point. That’s compared with a present-day value of 415ppm. This very high value assumes that the Paris climate goals will be exceeded and that many natural stores of carbon will also be released into the atmosphere (melting permafrost, for instance).

But the high carbon dioxide concentrations do not necessarily mean a warmer climate. That’s because, over such a long period, slow changes in the orbit and tilt of the planet become more important. This is known as the Milankovitch Cycle and each cycle lasts for around 100,000 years. Given that we are currently at the peak of such a cycle, the planet will naturally cool over the next 50,000 years and this is why scientists were once worried about a new ice age.

But will this be enough to offset the warming from the remaining carbon dioxide in the atmosphere? The image below shows a version of the classic warming stripes, a ubiquitous symbol of the past 150 years of climate change, but instead applied over 1 million years:

Annotated stripes
Warming stripes of Earth (and the World of the Wheel) for a million years. Today’s climate crisis will disrupt the Milankovitch cycle and its effects will last for many thousands of years.
Authors modified from Dan Lunt et al, Author provided

You can clearly see the 100,000 year Milankovitch cycles. Anything red can be considered anthropogenic climate change, and the events of the Wheel of Time are well within this period. Even the descending Milankovitch cycle won’t be enough to counteract the increased warming from carbon dioxide, and so the inhabitants of the World of the Wheel would still experience elevated temperatures from a climate crisis that occurred 18,000 years ago.

Simulating the weather of the World

However, some of the weather changes from the still-elevated temperatures could be offset by other factors. Those 18,000 years aren’t very long from a geological perspective, so in normal circumstances the landmasses would not change significantly. However, in this fantasy future magical channelers “broke” the world at the end of the Second Age, creating several new supercontinents.

To find out how the climate would work in the World of the Wheel, we used an exoplanet model. This complex computer program uses fundamental principles of physics to simulate the weather patterns on the hypothetical future planet, once we had fed in its topography based on hand-drawn maps of the world, and carbon dioxide levels of 830ppm based on one of the high potential future carbon pathways.

According to our model, the World of the Wheel would be warm all over the surface, with temperatures over land never being cold enough for snow apart from on the mountains. No chance of a white Christmas in this future. Here the story and the science diverge, as at times snow is mentioned in the Wheel of Time. The long-term effects of climate change may have surpassed the imagination of its author, the late great Robert Jordan.

An animated map with arrows
A simulation focused on where The Wheel of Time events take place, showing surface winds (white arrows).
climatearchive.org, Author provided

The World of the Wheel would have stronger and wavier high-altitude jet streams than modern-day Earth. This is likely because there are more mountain ranges in the World of the Wheel, which generate atmospheric waves called Rossby waves, causing oscillations in the jet. There is some limited evidence that the jet stream gets wavier with climate change as well, although this is likely to be less important than the mountain ranges. The jet would bring moisture from the western ocean on to land, and deposit it north of the Mountains of Dhoom. Surprising then, that this region (The Great Blight) is so desert-like in the books – perhaps there is some magic at play to explain this.

Our simulation of the World of the Wheel, showing the jet stream (red and yellow arrows), surface winds (white arrows) and cloud cover (white mist). Source: https://climatearchive.org/wot.

Winds would often revolve around two particularly enormous mountains, Dragonmount and Shayol Ghul, before blowing downslope and reaching far across the land masses. The peak of Dragonmount itself is nearly always surrounded by clouds, and this is because the mountain is so large the winds travelling up it force surface moisture to higher altitudes, thus cooling it, and forming clouds.

The fact winds would be so different from modern-day Earth is predominantly caused by topography, not the underlying increased temperatures from climate change. Nevertheless, in the World of the Wheel, it is clear that despite the extremely long time since carbon polluted the atmosphere, the inhabitants are still exposed to warmer than usual temperatures.

Acknowledging just how long the effects of climate change will persist for should be a catalyst for change. Yet, even after accepting the facts, we face psychological barriers to subsequent personal action, not least because comprehending the timescales of climate change requires a considerable degree of abstraction. But, given the known changes in extreme weather from climate change, and given how long these changes will remain, we must ask ourselves: how would the mysterious and powerful Aes Sedai stop the climate crisis?The Conversation

—————————

This blog is by Caboteers Professor Dann Mitchell, Professor of Climate Science, University of Bristol; Emily Ball, PhD Candidate, Climate Science, University of Bristol; Sebastian Steinig, Research Associate in Paleoclimate Modelling, University of Bristol; and Rebecca Áilish Atkinson, Research Fellow, Cognitive Psychology, University of Sussex.

This article is republished from The Conversation under a Creative Commons license. Read the original article.

Violence and mental health are likely to get worse in a warming world

As heat levels increase, mental health conditions are likely to worsen.
Pxfuel

Extreme weather has been the cause of some of the biggest public health crises across the world in recent years. In many cases, these have been enhanced by human-induced climate change. For instance, in 2003, high summer temperatures in Europe were believed to cause 50,000 to 70,000 excess deaths across 16 European countries.

Globally, it’s been estimated that a total of 296,000 deaths over the past two decades have been related to heat.

But heat doesn’t just affect physical health. It can have equally serious effects on mental health conditions. Research has shown that rising temperatures are associated with an increase in suicides and in violent behaviour, as well as exacerbating mood and anxiety disorders.

Studies in England and Wales conducted between 1993 and 2003 have revealed that, when temperatures were above 18°C, every 1°C rise in temperature was associated with a 3.8% increased risk of suicide across the population.

Between 1996 and 2013 in Finland, every 1°C increase in temperature accounted for a 1.7% increase in violent crime across the country. It has even been estimated that 1.2 million more assaults might occur in the United States between 2010 to 2099 than would without climate change.

The association between high temperatures and mental health is an active area of research. Scientists have found that some health consequences of increased heat, like disturbed sleep and levels of serotonin – a hormone critical for adjusting our feelings, emotions and behaviours – might play a role in triggering the appearance of mental health conditions.

A world map coloured red, with darker areas indicating greater temperature rises (up to 6°C).
This map shows the projected changes in daily temperature extremes at 1.5°C of global warming compared to the pre-industrial period (since 1861).
Author provided

Sleep deprivation often occurs during heatwaves, which then may lead to frustration, irritability, impulsive behaviours and even violence.

Extreme temperatures, such as those observed during heatwaves, are also found to be associated with some forms of dementia and disturbed mental health states, especially for those who are already in vulnerable conditions such as psychiatric patients.

And low levels of serotonin are associated with depression, anxiety, impulsivity, aggression and occurrence of violent incidents.

Implications

In the future, heatwaves will be hotter and last longer. Temperature records are likely to be broken ever more frequently as the world continues to warm. In north-west Asia, for example, temperatures could increase by 8.4°C by 2100.

A world that is on average 1.5°C warmer will see many average regional temperatures rise by more than this. This problem is compounded as the population – and therefore the number of people living in cities – increases. By 2050, it is projected that two thirds of the world’s population will live in urban areas.

A city in summer
Cities are often hotter than rural regions, exacerbating negative mental health effects caused by heat.
PedroFigueras/Pixabay

Urban environments are known to be warmer than their rural surroundings, a phenomenon known as the “urban heat island”. Climate projections show not only that cities will warm faster than rural areas, but that this effect is increased at night. This may further exacerbate the effects of heat extremes on our sleep.

Both adaptation to and mitigation of climate change will be necessary to lessen these potentially devastating effects as much as possible.

Options for adapting our lives to a warmer world could include increasing air circulation within buildings and adjusted work hours in times of extreme heat. Paris, for example, has already created a network of “cool islands”: green and blue spaces such as parks, ponds and swimming pools which provide places to seek refuge from the heat.

Most simply, educating people on the potential impacts of heat on mental health, aggression and violence – allowing them to understand exactly why it is so important to support initiatives that help keep our planet cool – could support better mental health at the same time as fighting the climate crisis.

—————————————–The Conversation

This blog is written by Cabot Institute for the Environment members Dr Mary Zhang, Senior Research Associate in Policy Studies, University of Bristol; Professor Dann Mitchell, Associate Professor in Atmospheric Sciences, University of Bristol, and Dr Vikki Thompson, Senior Research Associate in Geographical Sciences, University of Bristol

This article is republished from The Conversation under a Creative Commons license. Read the original article.

Dann Mitchell
Mary Zhang
Vikki Thompson


Read all blogs in our COP26 blog series:

Why snow days are becoming increasingly rare in the UK

A snowy start to the day at Watlington station, King’s Lynn. December 18 2009.
Lewis Collard/Wikipedia

Winter frost fairs were common on the frozen River Thames between the 17th and 19th centuries, but they’ve become unimaginable in our lifetime. Over decades and centuries, natural variability in the climate has plunged the UK into sub-zero temperatures from time to time. But global warming is tipping the odds away from the weather we once knew.

These days, people in the UK have become accustomed to much warmer, wetter winters. In fact, winter is warming faster than any other season. This is bad news for those holding out for a white Christmas – the Met Office reports that only four Christmases in over five decades recorded snow at more than 40% of UK weather stations.

Painting of people, tents and horse-drawn carriages on the frozen river.
A frost fair on the River Thames, painted by Thomas Wyke (1683-1684).
Thomas Wyke/Wikipedia

Christmas is a magical day for many, but meteorologically, it’s no different from other winter periods, when snow and ice are also becoming less common. The Met Office definition of a snow day at a given location in the UK is when snow lies on at least 50% of the ground at 9am. Currently, the Cairngorms around Aviemore receive over 70 snow-lying days per year – the most in the UK.

This amount is smaller than in previous decades though. Met Office data shows that, since 1979, the number of snow-lying days has generally decreased by up to five days per decade, and up to ten days per decade in the North Pennines, near Penrith. Around a fifth of the total area of the UK has experienced a significant drop in the prevalence of days with snow lying on the ground.

Two maps of the UK depicting the change in prevalence of snow days throughout the UK from 1971-2019.
Snow days are a rarer occasion in the UK today than they were five decades ago.
Met Office, Author provided

What causes snow days?

Snow days are often the result of a meandering jet stream, the fast-flowing current of air that’s between 9km and 16km above the Earth’s surface. The jet stream normally transports temperate weather from the Atlantic across the UK, but if it’s displaced southwards, it allows persistent high pressure systems of colder air from the north and east, originating in the Arctic or over the Eurasian continent, known as blocking high pressures, to settle over the UK for extended periods.

A number of atmospheric processes can cause the jet stream to meander, but perhaps the most dramatic is when the stratospheric polar vortex, a huge rotating air mass in the middle atmosphere, breaks down. This disruption causes the jet stream to weaken, leading to events such as the infamous 2018 Beast from the East, which brought widespread snowfall to the UK.

The winter of 2018 was not unique in this sense – 2009-2010 and 2013 both brought snowfall because of these dynamic “beasts”. So why is there still a decline in winter snow days in the UK?

The snows of yesteryear

There’s no strong evidence for a long-term trend in polar vortex disruptions, or other atmospheric processes that influence the jet stream. So the fact that people in the UK have fewer snow days to enjoy each year than they did in the past can’t be blamed on the invisible twists and turns above their heads.

But as the concentration of CO₂ in the atmosphere climbs, disruptions that do occur sit on top of increasing background temperatures, reducing the likelihood of the cold spells that bring widespread snowfall. Just as natural climate trends have lowered the severity of winters since the days of the frost fairs, man-made climate change will increasingly keep the UK’s average temperature above zero.

A heavy covering of snow can transform the country and our perception of it. Snow days, with the closures of schools and workplaces that they bring, evoke fond memories and bring out the child in many as hillslopes and parks become sledging highways. More tangibly, in Scotland, the snowsports industry is estimated to be worth over £30 million a year.

But wintry weather can be dangerous too. The cold affects our health, exacerbating heart and lung conditions and the spread of infectious diseases. In extreme cases, heavy snowfall can cause widespread livestock deaths, which happened in Northern Ireland in 2013. The inevitable disruption to travel and businesses can cause economic damage running into billions of pounds, with sectors like the construction industry halted entirely.

While the falling chances of a white Christmas might disappoint many, the current trajectory of less and less snow will at least come as a relief to some.The Conversation

————————-

This blog is written by Cabot Institute members Dr Alan Thomas Kennedy-Asser, Research Associate in Climate Science, University of Bristol; Dr Dann Mitchell, Met Office Co-Chair in Climate Hazards, University of Bristol, and Dr Eunice Lo, Research Associate in Climate Science, University of Bristol.

This article is republished from The Conversation under a Creative Commons license. Read the original article.

Dann Mitchell
Alan Kennedy-Asser
Eunice Lo


Predicting the hazards of weather and climate; the partnering of Bristol and the Met Office

Image credit Federico Respini on Unsplash

When people think of the University of Bristol University, or indeed any university, they sometimes think of academics sitting in their ivy towers, researching into obscurities that are three stages removed from reality, and never applicable to the world they live in. Conversely, the perception of the Met Office is often one of purely applied science, forecasting the weather; hours, days, and weeks ahead of time. The reality is far from this, and today, on the rather apt Earth Day 2020, I am delighted to announce a clear example of the multidisciplinary nature of both institutes with our newly formed academic partnership.

This new and exciting partnership brings together the Met Office’s gold standard weather forecasts and climate projections, with Bristol’s world leading impact and hazard models. Our partnership goal is to expand on the advice we already give decision makers around the globe, allowing them to make evidence-based decisions on weather-related impacts, across a range of timescales.

By combining the weather and climate data from the Met Office with our hazard and impact models at Bristol, we could, for instance, model the flooding impact from a storm forecasted a week ahead, or estimate the potential health burden from heat waves in a decade’s time. This kind of advanced knowledge is crucial for decision makers in many sectors. For instance, if we were able to forecast which villages might be flooded from an incoming storm, we could prioritise emergency relief and flood defenses in that area days ahead of time. Or, if we projected that hospital admissions would increase by 10% due to more major heatwaves in London in the 2030s, then decision makers could include the need for more resilient housing and infrastructure in their planning. Infrastructure often lasts decades, so these sorts of decisions can have a long memory, and we want our decision makers to be proactive, rather than reactive in these cases.

While the examples I give are UK focussed, both the University of Bristol and the Met Office are internationally facing and work with stakeholders all over the world. Only last year, while holding a workshop in the Caribbean on island resilience to tropical cyclones; seeing the importance of our work the prime minister of Jamaica invited us to his residence for a celebration. While I don’t see this happening with Boris Johnson anytime soon, it goes to show the different behaviours and levels of engagement policy makers have in different countries. It’s all very well being able to do science around the world, but if you don’t get the culture, they won’t get your science. It is this local knowledge and connection that is essential for an international facing partnership to work, and that is where both Bristol and the Met Office can pool their experience.

To ensure we get the most out of this partnership we will launch a number of new joint Bristol-Met Office academic positions, ranging from doctoral studentships all the way to full professorships. These positions will work with our Research Advisory Group (RAP), made up of academics across the university, and be associated with both institutes. The new positions will sit in this cross-disciplinary space between theory and application; taking a combined approach to addressing some of the most pressing environmental issues of our time.

As the newly appointed Met Office Joint Chair I will be leading this partnership at Bristol over the coming years, and I welcome discussions and ideas from academics across the university; some of the best collaborations I’ve had have come from a random knock on the door, so don’t be shy in sharing your thoughts.

———————————
This blog is written by Dr Dann Mitchell – Met Office Joint Chair and co-lead of the Cabot Institute for the Environment’s Natural Hazards and Disaster Risk research.
You can follow him on Twitter @ClimateDann.

Dann Mitchell

World Water Day: Climate change and flash floods in Small Island Developing States

Pluvial flash flooding (otherwise known as flash flooding caused by rain) is a major hazard globally, but a particularly acute problem for Small Island Developing States (SIDS). Many SIDS experience extreme rainfall events associated with tropical cyclones (often referred to as hurricanes) which trigger excess surface water runoff and lead to pluvial flash flooding.

Following record-breaking hurricanes in the Caribbean such as Hurricane Maria in 2017 and Hurricane Dorian in 2019, the severe risk facing SIDS has been reaffirmed and labelled by many as a sign of the ‘new normal’ due to rising global temperatures under climate change. Nonetheless, in the Disaster Risk Reduction community there is a limited understanding of both current tropical-cyclone induced flood hazard and how this might change under different climate change scenarios, which inhibits attempts to build adaptive capacity and resilience to these events.

As part of the first year of my PhD research, I am applying rainfall data that has been produced by Emily Vosper and Dr Dann Mitchell in the University of Bristol BRIDGE group using a tropical cyclone rainfall model. This model uses climate model data to simulate a large number of tropical cyclone events in the Caribbean, which are used to understand how the statistics of tropical cyclone-induced rainfall might change under the 1.5C and 2C Paris Agreement scenarios. This rainfall data will be input into the hydrodynamic model LISFLOOD-FP to simulate pluvial flash flooding associated with hurricanes in Puerto Rico.

Investigating changes in flood hazard associated with different rainfall scenarios will help us to understand how flash flooding, associated with hurricanes, emerges under current conditions and how this might change under future climate change in Puerto Rico. Paired with data identifying exposure and vulnerability, my research hopes to provide some insight into how flood risk related to hurricanes could be estimated, and how resilience could be improved under future climate change.

————————————-
This blog is written by Cabot Institute member Leanne Archer, School of Geographical Sciences,  University of Bristol.
Leanne Archer

The Paris Agreement – where are we now?

Cabot Annual Lecture 2018

This year the Cabot Institute Annual Lecture posed a critical question: where are we with current efforts to tackle global climate change? The event brought together over 800 people to hear from leading Cabot Institute experts in climate science, policy, and justice, Dr Jo House, Dr Dann Mitchell, Dr Alix Dietzel and Professor Tony Payne. It was both an appraisal of the findings of the recently published report of the Intergovernmental Panel on Climate Change (IPCC), and a grounded call to climate action.

Paris commitments

In 2015 world leaders adopted the Paris Agreement committing all parties to limiting global average temperatures to well below 2 °C above pre-industrial levels and to pursue efforts to limit warming to 1.5 °C. All countries undertook to achieve global peaking of greenhouse gas emissions as soon as possible and to enact increasingly ambitious mitigation measures in line with the overarching temperature goals. The Paris Agreement, in contrast to the preceding Kyoto Protocol, is not based on legally binding reductions targets for developed countries, but on a voluntary system of pledges known as ‘nationally determined contributions’ for all parties which will be subject to a stocktake of global progress every five years, beginning in 2023.

Although the Paris Agreement initially offered great promise with pledges being made by both developed and developing countries, a report by the UN Environment Programme in November 2017 examining progress towards the global temperature goals found that even if all current pledges are honoured, we remain on track for some 3 °C of warming by 2100. In light of this, and under the Presidency of Fiji, the first Small Island State to preside over a Conference of the Parties at COP23 last year, the focus has been on building momentum for more urgent action through the facilitative ‘Talanoa dialogue’ and on hashing out the final operating procedures for the Agreement. The findings of the IPCC Report on Global Warming of 1.5°C, published on 8 October represent a further important piece of the picture of global progress, which three of the Cabot speakers shed light upon as contributing authors.

Why 0.5°C of warming matters

The findings of the report are significant in illustrating the projected differences in climate change impacts between the 1.5°C and 2°C temperature thresholds. Dr Dann Mitchell outlined the evidence for increases in regional mean temperatures and for the increasing likelihood of temperature extremes of the kind witnessed during this summer’s European heatwave, which we could see occur almost every year at 2°C of warming. These extremes, together with the projected intensification of storms presented in the report, are closely linked to human risks to health, wellbeing and livelihoods.

Cabot Annual Lecture 2018
Dr Dann Mitchell

Professor Tony Payne echoed these concerns with respect to the findings of the report on sea-level rise which predict an extra 10cm rise between the 1.5°C and 2°C temperature thresholds, equating, in turn, to an additional 10 million people at risk of related impacts including inundation and displacement. The destabilisation of the ice sheets is set to become more likely beyond 1.5°C, entailing risks of much greater sea-level rise in the future. Professor Payne further outlined the strikingly severe consequences for coral reefs of the two temperature thresholds, with projections that at 2°C all coral in the oceans will die, while by limiting temperature to 1.5°C, some 10-30% of coral will survive. Reefs are not only crucial for the maintenance of healthy marine ecosystems, but also for the millions of people around the world who depend upon those ecosystems for their food security and livelihoods.

Cabot Annual Lecture 2018
Professor Tony Payne

A call for action

Against these stark warnings on the significance of limiting global temperatures to 1.5°C, Dr Jo House outlined some key recommendations for how we can get on track. The IPCC report sets out a number of pathways for action, each calling for changes across a broad spectrum of policy sectors with the aim of rapidly reducing greenhouse gas emissions and enhancing the absorption of existing carbon in the atmosphere. These changes include moving away from fossil fuels to renewable sources of energy, greening the transport sector, replanting forests, and investing in carbon capture and storage technologies. Dr House underlined the importance of action at all levels of governance to meet these goals. At the national level in the UK under the provisions of the Climate Change Act we are already committed to an 80% reduction on 1990 levels by 2050, while at the city level in Bristol, the Climate and Energy Security Framework commits to the same target, with a 50% reduction to be achieved by 2025.

Cabot Annual Lecture 2018
Dr Jo House

This action in climate policy is increasingly being driven by sub-state actors and Dr Alix Dietzel highlighted the crucial role that local government, civil society groups, citizens initiatives, corporations, and individuals are playing in this. Dr Dietzel expressed cause for hope in the reaction of sub-state actors to the announcement of the withdrawal of the United States from the Paris Agreement, with the ‘WE ARE STILL IN’ movement garnering support from city mayors, governors, tribal leaders, universities, and businesses for continuing commitment to the Paris goals. At the individual level, the actions we can all take within the boundaries of our own capabilities were discussed, outlining our capacity to affect change through our consumption and lifestyle choices. The need to consider the ethical questions surrounding our responsibilities as individuals and global citizens remains crucial, particularly in light of the disproportionately harmful effects that climate impacts will have upon those who have contributed least to the problem.

Cabot Annual Lecture 2018
Dr Alix Dietzel

The risks of inaction on the 1.5°C threshold were balanced against the opportunities and benefits of action by the panel. The successful lobbying efforts of climate-vulnerable states to embed the 1.5°C threshold within the Paris framework, alongside the commitment of many governments and sub-state actors to meet it, are cause for hope but we still have a long way to go.

——————————
This blog was written by Cabot Institute member Alice Venn, a PhD Candidate in Environment, Energy & Resilience at the University of Bristol’s Law School.

Alice Venn

Listen again to the Annual Lecture
View the presentation slides
View the photos on Flickr 
View our Moments or check out #CabotLecture2018 on Twitter.

Will July’s heat become the new normal?

Saddleworth Moor fire near Stalybridge, England, 2018.  Image credit: NASA

For the past month, Europe has experienced a significant heatwave, with both high temperatures and low levels of rainfall, especially in the North. Over this period, we’ve seen a rise in heat-related deaths in major cities, wildfires in Greece, Spain and Portugal, and a distinct ‘browning’ of the European landscape visible from space.

As we sit sweltering in our offices, the question on everyone’s lips seems to be “are we going to keep experiencing heatwaves like this as the climate changes?” or, to put it another way, “Is this heat the new norm?”

Leo Hickman, Ed Hawkins, and others, have spurred a great deal of social media interest with posts highlighting how climate events that are currently considered ‘extreme’, will at some point be called ‘typical’ as the climate evolves.

As part of a two-year project on how future climate impacts different sectors (www.happimip.org), my colleagues and I have been developing complex computer simulations to explore our current climate as well as possible future climates. Specifically, we’re comparing what the world will look like if we meet the targets set out in the Paris agreement: to limit the global average temperature rise to a maximum of 2.0 degrees warming above pre-industrial levels but with the ambition of limiting warming to 1.5 degrees.

The world is already around 1 degree warmer on average than pre-industrial levels, and the evidence to date shows that every 0.5 degree of additional warming will make a significant difference to the weather we experience in the future.

So, we’ve been able to take those simulations and ask the question: What’s the probability of us experiencing European temperatures like July 2018 again if:

  1. We don’t emit any further greenhouse gases and things stay as they are (1 degree above pre-industrial levels).
  2. Greenhouse gas emissions are aggressively reduced, restricting global average temperature rise to 1.5 degrees above pre-industrial levels.
  3. Greenhouse gas emissions are reduced to a lesser extent, restricting global average temperature rise by 2 degrees above pre-industrial levels.

What we’ve found is that European heat of at least the temperatures we have experienced this July are likely to re-occur about once every 5-6 years, on average, in our current climate. While this seems often, remember we have already experienced 1C of global increase in temperature. We’ve also considered the temperature over the whole of Europe, not just focusing on the more extreme parts of the heatwave. If we considered only the hottest regions, this would push our current temperature re-occurrence times closer to 10-20 years. However, using this Europe-wide definition of the current heat event, we find that in the 1.5C future world, temperatures at least this high would occur every other year, and in a 2C world, four out of five summers would likely have heat events that are at least as hot as our current one. Worryingly, our current greenhouse gas emission trajectory is leading us closer to 3C, so urgent and coordinated action is still needed from our politicians around the world.

Our climate models are not perfect, and they cannot capture all aspects of the current heatwave, especially concerning the large-scale weather pattern that ‘blocked’ the cooler air from ending our current heatwave. These deficiencies increase the uncertainty in our future projections, but we still trust the ball-park figures.

Whilst these results are not peer-reviewed, and should be considered as preliminary findings, it is clear that the current increased heat experienced over Europe has a significant impact on society, and that there will be even more significant impacts if we were to begin experiencing these conditions as much as our analysis suggests.

Cutting our emissions now will save us a hell of a headache later.

—————————–
This blog is written by Dr Dann Mitchell (@ClimateDann) and Peter Uhe from the University of Bristol Geographical Sciences department and the Cabot Institute for the Environment.

Dann Mitchell