Why 40°C is bearable in a desert but lethal in the tropics

Phew: heat plus humidity can make Bangkok an uncomfortable place in a heatwave.
Pavel V.Khon/SHutterstock

This year, even before the northern hemisphere hot season began, temperature records were being shattered. Spain for instance saw temperatures in April (38.8°C) that would be out of the ordinary even at the peak of summer. South and south-east Asia in particular were hammered by a very persistent heatwave, and all-time record temperatures were experienced in countries such as Vietnam and Thailand (44°C and 45°C respectively). In Singapore, the more modest record was also broken, as temperatures hit 37°C. And in China, Shanghai just recorded its highest May temperature for over a century at 36.7°C.

We know that climate change makes these temperatures more likely, but also that heatwaves of similar magnitudes can have very different impacts depending on factors like humidity or how prepared an area is for extreme heat. So, how does a humid country like Vietnam cope with a 44°C heatwave, and how does it compare with dry heat, or a less hot heatwave in even-more-humid Singapore?

Weather and physiology

The recent heatwave in south-east Asia may well be remembered for its level of heat-induced stress on the body. Heat stress is mostly caused by temperature, but other weather-related factors such as humidity, radiation and wind are also important.

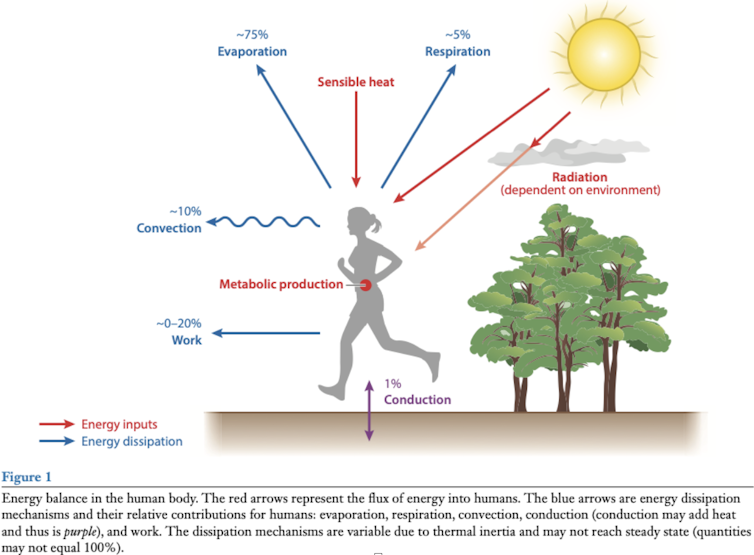
Our bodies gain heat from the air around us, from the sun, or from our own internal processes such as digestion and exercise. In response to this, our bodies must lose some heat. Some of this we lose directly to the air around us and some through breathing. But most heat is lost through sweating, as when the sweat on the surface of our skin evaporates it takes in energy from our skin and the air around us in the form of latent heat.

annotated diagram of person
How humans heat up and cool down.
Take from Buzan and Huber (2020) Annual Review of Earth and Planetary Sciences, Author provided

Meteorological factors affect all this. For example, being deprived of shade exposes the body to heat from direct sunlight, while higher humidity means that the rate of evaporation from our skin will decrease.

It’s this humidity that meant the recent heatwave in south-east Asia was so dangerous, as it’s already an extremely humid part of the world.

The limit of heat stress

Underlying health conditions and other personal circumstances can lead to some people being more vulnerable to heat stress. Yet heat stress can reach a limit above which all humans, even those who are not obviously vulnerable to heat risk – that is, people who are fit, healthy and well acclimatised – simply cannot survive even at a moderate level of exertion.

One way to assess heat stress is the so-called Wet Bulb Globe Temperature. In full sun conditions, that is approximately equivalent to 39°C in temperature combined with 50% relative humidity. This limit will likely have been exceeded in some places in the recent heatwave across south-east Asia.

In less humid places far from the tropics, the humidity and thus the wet bulb temperature and danger will be much lower. Spain’s heatwave in April with maximum temperatures of 38.8°C had WBGT values of “only” around 30°C, the 2022 heatwave in the UK, when temperatures exceeded 40°C, had a humidity of less than 20% and WBGT values of around 32°C.

Two of us (Eunice and Dann) were part of a team who recently used climate data to map heat stress around the world. The research highlighted regions most at risk of exceeding these thresholds, with literal hotspots including India and Pakistan, south-east Asia, the Arabian peninsula, equatorial Africa, equatorial South America and Australia. In these regions, heat stress thresholds are exceeded with increased frequency with greater global warming.

In reality, most people are already vulnerable well below the survivability thresholds, which is why we can see large death tolls in significantly cooler heat waves. Furthermore, these global analyses often do not capture some very localised extremes caused by microclimate processes. For example a certain neighbourhood in a city might trap heat more efficiently than its surroundings, or might be ventilated by a cool sea breeze, or be in the “rain shadow” of a local hill, making it less humid.

Variability and acclimatisation

The tropics typically have less variable temperatures. For example, Singapore sits almost on the equator and its daily maximum is about 32°C year round, while a typical maximum in London in mid summer is just 24°C. Yet London has a higher record temperature (40°C vs 37°C in Singapore).

Given that regions such as south-east Asia consistently have high heat stress already, perhaps that suggests that people will be well acclimatised to deal with heat. Initial reporting suggests the intense heat stress of the recent heatwave lead to surprisingly few direct deaths – but accurate reporting of deaths from indirect causes is not yet available.

On the other hand, due to the relative stability in year-round warmth, perhaps there is less preparedness for the large swings in temperature associated with the recent heatwave. Given that it is not unreasonable, even in the absence of climate change, that natural weather variability can produce significant heatwaves that break local records by several degrees Celsius, even nearing a physiological limit might be a very risky line to tread.

—————————–


This blog is written by Cabot Institute for the Environment members: Dr Alan Thomas Kennedy-Asser, Research Associate in Climate Science; Professor Dann Mitchell, Professor of Climate Science, and Dr Eunice Lo, Research Fellow in Climate Change and Health, University of Bristol. This article is republished from The Conversation under a Creative Commons license. Read the original article.

Alan Kennedy-Asser
Alan Kennedy-Asser
Dann Mitchell
Dann Mitchell
Eunice Lo
Eunice Lo

Cost of living crisis: the health risks of not turning the heating on in winter

People in the UK might be tempted to keep their heating turned off to offset the large increases in energy bills this winter. A recent YouGov poll, revealed that 21% of respondents would not turn their heating on until at least November. Could the health of these people be endangered?

Before COVID, an average of 25,000 extra deaths occurred between December and March compared with any other four-month period of the year. Even if COVID did not exist, the cost of living crisis could result in the toll from the coming winter being worse than usual.

The Marmot review (a report investigating the effects of cold homes and fuel poverty) estimated that 21.5% of all excess winter deaths could be attributed to the coldest 25% of homes in the UK population.

This would suggest that 5,000 extra deaths occur in winter because people live in cold homes. But this does not mean the cold homes cause the deaths. People who live in cold homes may have other disadvantages, making them less able to survive winter.

Would it make any difference whether they leave their heating on or off? Studies suggest temperatures should be kept to at least 18℃ to minimise the risk to health, but how easy is it to maintain this if homes are poorly insulated?

Research into what is best for people’s health ideally relies on randomised controlled trials to tell us about cause and effect. But it would be unethical to conduct a trial where some people were told to leave their heating off and others were told to keep it on to see if it had any effect on mortality. Instead, we have to rely on what are known as “longitudinal studies” where people are followed over many years and respond regularly to questionnaires.

In one such study in the 1970s, the British Regional Heart Study recruited thousands of men, then in middle age, from across Great Britain. In 2014, around 1,400 of these men, then aged 74-96 years, answered a questionnaire that included questions on home heating.

One question asked whether, during the previous winter, the respondent had: “Turned off the heating, even when you were cold because you were worried about the cost?” One hundred and thirty men (9.4%) said yes. These men seemed no more likely to die in the following two years than men who had replied no.

A larger study would have given a more robust answer. And in the absence of other direct evidence, we have to draw conclusions from indirect evidence, such as this.

The most vulnerable

Recently, researchers in Sweden tried to assess a range of questions about the effects of energy use, fuel poverty and energy efficiency improvements on people’s health. They systematically reviewed all the relevant studies on the topic. One of their findings showed consistently across four studies the link between fuel poverty and premature death.

The British Regional Heart Study showed that fuel poverty was more likely to be found among people who were single, poor and working class. This suggests that people who are the most financially vulnerable will be those most likely to leave the heating off. As with climate change, the poorest are hit hardest.

So far I have only discussed effects on health in terms of death, which in the UK concerns mainly older people. The winter deaths that occur are usually the result of heart disease, stroke and respiratory disease. Yet increasing attention has also been paid to the strong effects of the cold on mental health.

The Marmot review quoted studies that drew attention to the depressive effect of living in a cold home. Children in adolescent years may seek respite and privacy away from home, with consequent exposure to mental health risks. The misery caused by financial pressures only add to this burden.

Because the most financially vulnerable people are also the most vulnerable in their health, it should follow that interventions at government level are urgently needed to offset the likely health crisis looming from increased energy costs.

The most vulnerable will need the most help. Yet a common paradox seen in public health is that interventions applying to the whole population will lead to more lives saved than those targeted only to those at greatest risk.

This is because there are far more people in the population at moderate risk than at high risk. Only a modest proportion of people at moderate risk will benefit. Yet because this group is so much larger than the high-risk group, more lives may be saved among those at moderate risk.

Buildings in the UK clearly need to be better insulated, but these sorts of interventions will come too late for this winter. Mitigating the rising costs of energy must be the only way forward to allow homes to be heated to a comfortable level and prevent a tidal wave of excess winter deaths.The Conversation

—————————-

This blog is written by Cabot Institute for the Environment member Richard Morris, Honorary Professor in Medical Statistics, University of Bristol

This article is republished from The Conversation under a Creative Commons license. Read the original article.

Richard Morris

Watch Richard speak more about this issue in our Cabot Conversations video on Heatwaves and Health.


India heatwave: why the region should prepare for even more extreme heat in the near future

An extreme heatwave in India and Pakistan has left more than a billion people in one of the most densely populated parts of the world facing temperatures well above 40℃. Although this has not broken all-time records for the regions, the hottest part of the year is yet to come.

Though the heatwave is already testing people’s ability to survive, and has led to crop failures and power blackouts, the really scary thing is that it could be worse: based on what has happened elsewhere at some point India is “due” an even more intense heatwave.

Together with a few other climate scientists, we recently looked for the most extreme heatwaves globally over the past 60 years – based on the greatest difference from expected temperature variability in that area, rather than by maximum heat alone. India and Pakistan do not feature in our results, now published in the journal Science Advances. Despite regularly having extremely high temperatures and levels of heat stress in absolute terms, when defined in terms of deviation from the local normal, heatwaves in India and Pakistan to date have not been all that extreme.

In fact, we highlighted India as a region with a particularly low greatest historical extreme. In the data we assessed, we didn’t find any heatwaves in India or Pakistan outside three standard deviations from the mean, when statistically such an event would be expected once every 30 or so years. The most severe heatwave we identified, in southeast Asia in 1998, was five standard deviations from the mean. An equivalent outlier heatwave in India today would mean temperatures of over 50℃ across large swaths of the country – such temperatures have only been seen at localised points so far.

Our work therefore suggests India may experience even more extreme heat. Assuming the statistical distribution of daily maximum temperatures is broadly the same across the world, statistically a record-breaking heatwave is likely to occur in India at some point. The region has not yet had reason to adapt to such temperatures, so may be particularly vulnerable.

Harvests and health

Although the current heatwave has not broken any all-time records, it is still exceptional. Many parts of India have experienced their hottest April on record. Such heat this early in the year will have devastating impacts on crops in a region where many rely on the wheat harvest both to eat and to earn a living. Usually, extreme heat in this area is closely followed by cooling monsoons – but these are still months away.

It is not just crop harvests that will bear the brunt, as heatwaves affect infrastructure, ecosystems and human health. The impacts on human health are complex as both meteorological factors (how hot and humid it is) and socioeconomic factors (how people live and how they are able to adapt) come into play. We do know that heat stress can lead to long-term health issues such as cardiovascular diseases, kidney failure, respiratory distress and liver failure, though we will be unable to know exactly how many people will die in this heatwave due to the lack of necessary health data from India and Pakistan.

What the future holds

To consider the impact of extreme heat over the next few decades, we have to look at both climate change and population growth, since it is a combination of the two that will amplify the human-health impacts of heat extremes in the Indian subcontinent.

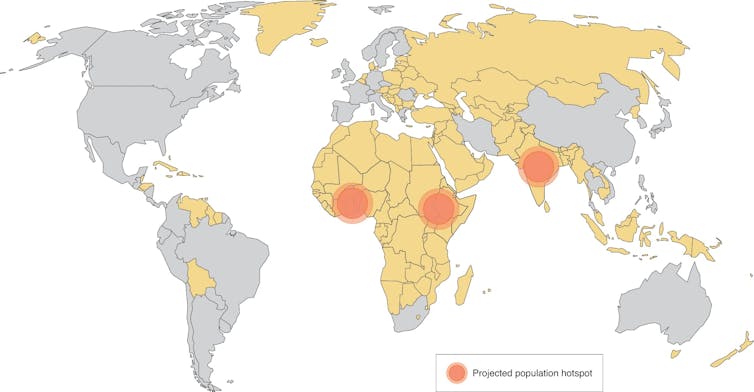
world map with some countries shaded yellow
Hotspots of population increases over the next 50 years (red circles), all coincide with locations where no daily mortality data exists (yellow).
Mitchell, Nature Climate Change (2021), CC BY-SA

In our new study, we investigated how extremes are projected to increase in the future. We used a large ensemble of climate model simulations, which gave us many times more data than is available for the real world. We found that the statistical distribution of extremes, relative to a shift in the underlying climate as it generally gets warmer, does not change. In the climate models the daily temperature extremes increase at the same rate as the shift in the mean climate. The IPCC’s latest report stated that heat waves will become more intense and more frequent in south Asia this century. Our results support this.

The current heatwave is affecting over 1.5 billion people and over the next 50 years the population of the Indian subcontinent is projected to increase by a further 30%. That means hundreds of millions more people will be born into a region that is likely to experience more frequent and more severe heatwaves. With even larger numbers of people being affected by even greater heat extremes in the future, measures to adapt to climate change must be accelerated – urgently.The Conversation

————————-

This blog is written by Cabot Institute for the Environment members Dr Vikki Thompson, Senior Research Associate in Geographical Sciences, University of Bristol and Dr Alan Thomas Kennedy-Asser, Research Associate in Climate Science, University of Bristol.

This article is republished from The Conversation under a Creative Commons license. Read the original article.

Telling the story of temperature


Image credit: Brigstow Institute


What is the most extreme temperature you have experienced?

Take your time and have a moment to think about it.

What was happening that day? Where were you? Which of your senses feature in the memory? Do any emotions come back to you?

While you’re thinking about it, I’ll tell you a little bit about the Temperature Life Stories project that I brought to COP26 on 1st November 2021.

We all experience temperature differently. The hottest day I remember might be very different from the hottest day you remember. Where we have been, when we were there and our specific circumstances at a given moment all affect the physical temperatures we have lived through. We have lived different temperature life stories.

Why does this matter? Even in the UK, in Glasgow where world leaders will be meeting for COP26, which we often think of as being cold and driech, some people will be at risk from extreme temperatures. Meanwhile, for some of us that have always lived in and become acclimatised to temperate climate zones, we may never appreciate the searing strength of heat experienced by others on a daily basis. What does “1.5 °C or 2 °C of global warming above pre-industrial temperatures” even mean for ourselves or individuals like us elsewhere in the world? Expressing our differences in circumstances in creative ways can help build new understandings and narratives of how we will live with temperature extremes in a warming world.

The Temperature Life Stories project explored these questions. By digging into global temperature data, the same data that informs global temperature targets, we produced temperature life story graphs for both individuals and our collective of research participants. As individuals we may never ‘feel’ the global average temperature, but our experience is part of that bigger picture. Memories and experiences of temperature were explored through poetry, with exercises designed by Caleb Parkin (Bristol City Poet, 2020-2022), and a host of other creative methods from the wonderful (and hidden) talents of our research participants.

Of course, there were and will be contradictions too. The temperature that the data says we lived through might not match what we remember as being the most extreme of days. But that’s okay: unreliable narrators are part of storytelling, aren’t they?

So back to COP26, what was Temperature Life Stories doing there? Of course, I would have loved to have run a series of poetry workshops with international COP26 delegates to take the temperature of the conference, but unfortunately for them, time is more of the essence. For that reason, I settled for a providing a tiny morsel of the project as a taster at the COP26 Green Zone.

I asked attendees to spare just one key memory from their temperature life story. Something that stood out for them. I asked for them to describe it in just a few lines, which could be as poetic or as factual as they pleased. I asked them where and when the memory occurred (being as specific as they could or wanted to be).

Often, relative warmth appears in the memories: perhaps not extreme in a global sense, but enough to seem unusual to locals and visitors alike in Yorkshire, the Hebridies, alpine and polar environments. Sometimes a lack of snow says as much as burnt brown grass. Travel appears regularly, making up a key part of temperature life stories – both the biting cold of northern climates after a lifetime spent nearer the tropics and vice versa. Even a momentary blast of air changing connecting flights in Qatar can give a glimpse of what temperatures are possible. We don’t expect similar blasts of heat to hit us getting off the train in Birmingham, but recent summer heatwaves featured regularly in memories too, and in with them that same wall of heat. Finally, there are emotions too: nostalgia about climates of home or childhood not being the same when people return after time spent away, sadness for places of significance lost in wildfires, weeks of unbroken heat and sunshine “both amazing and terrifying”.

Using this collection of memories, a bespoke map of experience, emotions and stories in space and time will be produced for the COP26 conference. An alternative story of a warming world. Keep an eye on Brigstow channels in the coming weeks for this.

So what about you? Have you been thinking of your memory of temperature? Maybe it was during last summer’s heatwave. Maybe you were on holiday. Maybe you were stuck in an unairconditioned bus in a traffic jam. Maybe the heat was emotional, not physical: passion, anger or embarrassment. There is no right or wrong answers – every story is different.

If you have a memory and want to add it to our collective COP26 story, you can add it here (https://forms.office.com/r/HnwesuwJqg). We’ll ask you for the same information as the Green Zone participants an all memories and data recorded is anonymous.

Together we can rewrite a new story of our warming world. One which shows our vulnerabilities, frailties and fears but also our lighter moments, hopes, achievements. We have a complex relationship with the weather and climate we experience. Sometimes a graph can’t say it all.

———————–

This blog is written by Cabot Institute member Dr Alan Kennedy-Asser from Brigstow Institute funded Experimental Partnership “Temperature Life Stories: Feeling the heat”. This blog has been reposted from the Bristow Institute blog with kind permission from the Brigstow Institute. View the original blog.

Is extreme heat an underestimated risk in Bristol?

Evidence that the Earth is warming at an alarming rate is indisputable, having almost doubled per decade since 1981 (relative to 1880-1981). In many countries, this warming has been accompanied by more frequent and severe heatwaves – prolonged periods of significantly above-average temperatures – especially during summer months.

Heatwaves pose significant threats to human health including discomfort, heatstroke and in extreme cases, death. In the summer of 2003 (one that I am sure many remember for its tropical temperatures), these threats were clear. A European heatwave event killed over 70,000 people across the continent – over 2,000 of these deaths were in England alone. As if these statistics weren’t alarming enough, projections suggest that by 2050, such summers could occur every other year and by 2080, a similar heatwave could kill three times as many people.

Cities face heightened risks

Heat-health risks are not equally distributed. Cities face heightened risks due to the urban heat island (UHI) effect, where urban areas exhibit warmer temperatures than surrounding rural areas. This is primarily due to the concentration of dark, impervious surfaces. In the event of a heatwave, cities are therefore not only threatened by even warmer temperatures, but also by high population densities which creates greater exposure to such extreme heat.

UHIs have been observed and modelled across several of the UK’s largest cities. For example, in Birmingham an UHI intensity (the difference between urban and rural temperatures) of 9°C has been recorded. Some estimates for Manchester and London reach 10°C. However, little research has been conducted into the UK’s smaller cities, including Bristol, despite their rapidly growing populations.

Heat vulnerability

In the UK an ageing population implies that heat vulnerability will increase, especially in light of warming projections. Several other contributors to heat vulnerability are also well-established, including underlying health conditions and income. However, the relative influence of different factors is extremely context specific. What drives heat vulnerability in one city may play an insignificant role in another, making the development of tailored risk mitigation policies particularly difficult without location-specific research.

Climate resilience in Bristol

In 2018, Bristol declared ambitious intentions to be climate resilient by 2030. To achieve this, several specific targets have been put in place, including:

  • The adaptation of infrastructure to cope with extreme heat
  • The avoidance of heat-related deaths

Yet, the same report that outlines these goals also highlights an insufficient understanding of hotspots and heat risk in Bristol. This poses the question – how will Bristol achieve these targets without knowing where to target resources?

Bristol’s urban heat island

Considering the above, over the summer I worked on my MSc dissertation with two broad aims:

  1. Quantify Bristol’s urban heat island
  2. Map heat vulnerability across Bristol wards

Using a cloud-free Landsat image from a heatwave day in June 2018, I produced one of the first high-resolution maps of Bristol’s UHI (see below). The results were alarming, with several hotspots of 7-9°C in the central wards of Lawrence Hill, Easton and Southville. Maximum UHI intensity was almost 12°C, recorded at a warehouse in Avonmouth and Lawrence Weston. Though this magnitude may be amplified by the heatwave event, these findings still suggest Bristol exhibits an UHI similar to that of much larger cities including London, Birmingham and even Paris.

Image credit: Vicky Norton

Heat vulnerability in Bristol

Exploratory statistics revealed two principal determinants of an individual’s vulnerability to extreme heat in Bristol:

  1. Their socioeconomic status
  2. The combined effects of isolation, minority status and housing type.

These determinants were scored for each ward and compiled to create a heat vulnerability index (HVI). Even more concerning than Bristol’s surprising UHI intensity is that wards exhibiting the greatest heat vulnerability coincide with areas of greatest UHI intensity – Lawrence Hill and Easton (see below).

What’s also interesting about these findings is the composition of heat vulnerability in Bristol. Whilst socioeconomic status is a common determinant in many studies, the influential role of minority status and housing type appears particularly specific to Bristol. Unlike general UK projections, old age was also deemed an insignificant contributor to heat vulnerability in Bristol. Instead, the prevalence of a younger population suggests those under five years of age are of greater concern.

Image credit: Vicky Norton

Implications

But what do these findings mean for Bristol’s climate resilience endeavours? Firstly, they suggest Bristol’s UHI may be a much greater concern than previously thought, necessitating more immediate, effective mitigation efforts. Secondly, they reiterate the context specific nature of heat vulnerability and the importance of conducting location specific research. Considering UHI intensity and ward-level heat vulnerability, these findings provide a starting point for guiding adaptive and mitigative resource allocation. If Bristol is to achieve climate resilience by 2030, initial action may be best targeted towards areas most at risk – Lawrence Hill and Easton – and tailored to those most vulnerable.

—————————

This blog is written by Vicky Norton, who has recently completed an MSc in Environmental Policy and Management run by Caboteer Dr Sean Fox.

Vicky Norton


Siberia heatwave: why the Arctic is warming so much faster than the rest of the world

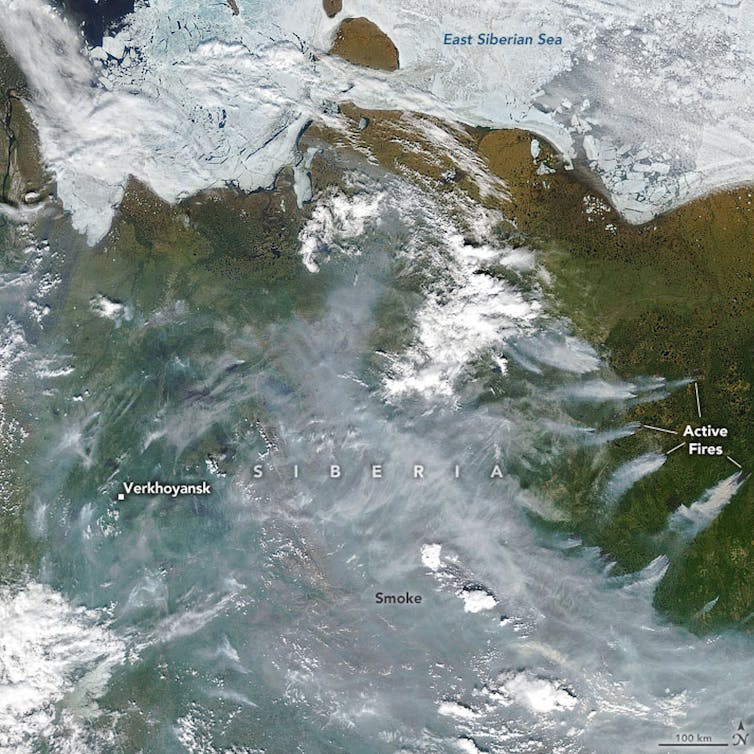
Smoke from wildfires cloaks the skies over Siberia, June 23 2020.
EPA-EFE/NASA

On the eve of the summer solstice, something very worrying happened in the Arctic Circle. For the first time in recorded history, temperatures reached 38°C (101°F) in a remote Siberian town – 18°C warmer than the maximum daily average for June in this part of the world, and the all-time temperature record for the region.

New records are being set every year, and not just for maximum temperatures, but for melting ice and wildfires too. That’s because air temperatures across the Arctic have been increasing at a rate that is about twice the global average.

All that heat has consequences. Siberia’s recent heatwave, and high summer temperatures in previous years, have been accelerating the melting of Arctic permafrost. This is the permanently frozen ground which has a thin surface layer that melts and refreezes each year. As temperatures rise, the surface layer gets deeper and structures embedded in it start to fail as the ground beneath them expands and contracts. This is what is partly to blame for the catastrophic oil spill that occurred in Siberia in June 2020, when a fuel reservoir collapsed and released more than 21,000 tonnes of fuel – the largest ever spill in the Arctic.

So what is wrong with the Arctic, and why does climate change here seem so much more severe compared to the rest of the world?

The warming models predicted

Scientists have developed models of the global climate system, called general circulation models, or GCMs for short, that reproduce the major patterns seen in weather observations. This helps us track and predict the behaviour of climate phenomena such as the Indian monsoon, El Niño, Southern Oscillations and ocean circulation such as the gulf stream.

GCMs have been used to project changes to the climate in a world with more atmospheric CO₂ since the 1990s. A common feature of these models is an effect called polar amplification. This is where warming is intensified in the polar regions and especially in the Arctic. The amplification can be between two and two and a half, meaning that for every degree of global warming, the Arctic will see double or more. This is a robust feature of our climate models, but why does it happen?

Fresh snow is the brightest natural surface on the planet. It has an albedo of about 0.85, which means that 85% of solar radiation falling on it is reflected back out to space. The ocean is the opposite – it’s the darkest natural surface on the planet and reflects just 10% of radiation (it has an albedo of 0.1). In winter, the Arctic Ocean, which covers the North Pole, is covered in sea ice and that sea ice has an insulating layer of snow on it. It’s like a huge, bright thermal blanket protecting the dark ocean underneath. As temperatures rise in spring, sea ice melts, exposing the dark ocean underneath, which absorbs even more solar radiation, increasing warming of the region, which melts even more ice. This is a positive feedback loop which is often referred to as the ice-albedo feedback mechanism.

Melting Arctic sea ice is increasing warming in the region.
Jonathan Bamber, Author provided

This ice-albedo (really snow-albedo) feedback is particular potent in the Arctic because the Arctic Ocean is almost landlocked by Eurasia and North America, and it’s less easy (compared to the Antarctic) for ocean currents to move the sea ice around and out of the region. As a result, sea ice that stays in the Arctic for longer than a year has been declining at a rate of about 13% per decade since satellite records began in the late 1970s.

In fact, there is evidence to indicate that sea ice extent has not been this low for at least the last 1,500 years. Extreme melt events over the Greenland Ice Sheet, that used to occur once in every 150 years, have been seen in 2012 and now 2019. Ice core data shows that the enhanced surface melting on the ice sheet over the past decade is unprecedented over the past three and a half centuries and potentially over the past 7,000 years.

In other words, the record-breaking temperatures seen this summer in the Arctic are not a “one-off”. They are part of a long-term trend that was predicted by climate models decades ago. Today, we’re seeing the results, with permafrost thaw and sea ice and ice sheet melting. The Arctic has sometimes been described as the canary in the coal mine for climate breakdown. Well it’s singing pretty loudly right now and it will get louder and louder in years to come.The Conversation

——————————-
This blog is written by Cabot Institute member Jonathan Bamber, Professor of Physical Geography, University of BristolThis article is republished from The Conversation under a Creative Commons license. Read the original article.

Professor Jonathan Bamber

Uncomfortable home truths: Why Britain urgently needs a low carbon heat strategy


A new report backed by MPs and launched by Minister for Climate Change Lord Duncan on 15 October 2019, calls for an urgent Green Heat Roadmap by 2020 to scale low carbon heating technologies and help Britain’s homeowners access the advice they need to take smarter greener choices on heating their homes.  The year-long study by UK think-tank Policy Connect warns that the UK will miss its 2050 net-zero climate target “unless radical changes in housing policy, energy policy and climate policy are prioritised”. Dr Colin Nolden was at the launch on behalf of the Cabot Institute for the Environment and blogs here on the most interesting highlights of the report and questions raised.

———————————-

Policy Connect had invited a range of industry, policy, academic and civil society representatives to the launch of their Uncomfortable Home Truths report. The keynote, no less than Lord Duncan of Springbank, Minister for Climate Change, and the high-level panel consisting of Maxine Frerk, Grid Edge Policy (Chair), Alan Brown MP, House of Commons (SNP), Dr Alan Whitehead MP, House of Commons (Labour), Dhara Vyas, Citizens Advice, Adam Turk, BAXI Heating (sponsor) and Mike Foster, EUA (Energy & Utilities Alliance), (sponsor), had been briefed to answer tough questions from the crowd given the UK’s poor track record in the area of heat and home decarbonisation.

The event started with an introduction by Jonathan Shaw, Chief Executive of Policy Connect, who introduced the panel and officially launched the report. Uncomfortable Home Truths is the third report of the Future Gas Series, the first two of which focused on low-carbon gas options. This last report of the series shifts the focus from particular technologies and vectors towards heating, households and consumers. Jonathan subsequently introduced the keynote speaker Lord Duncan of Springbank, Minister for Climate Change.

Lord Duncan supported the publication of this report as timely and relevant especially in relation to the heat policy roadmap that government intends to publish in 2020. He stressed the importance of a cultural shift which needs to take place to start addressing the issue of heat at household and consumer level. He was adamant that the government was aligning its policies and strategies with its zero-carbon target according to the Committee on Climate Change and guided by science and policy. In this context he bemoaned the drive by some country representatives to put into question the targets of the Paris Agreement on Climate Change which he had witnessed as the UK’s key representative at the run-up to COP25 in Chile. The 2020 roadmap will report on the decisions which will need to be taken in homes and in technology networks, ranging from heat pumps to hydrogen and low-carbon electricity to support their decarbonisation. It requires cross-party support while depending on more research and learning from successful examples in other European countries.

Although Lord Duncan suggested that ‘it’s easier to decarbonise a power plant than a terraced house’, he told the audience to take encouragement from the fuel shift from coal towards gas starting half a century ago. But in this context he once again stressed the cultural shift which needs to go hand-in-hand with government commitment and technological progression, using the example of TV-chefs shunning electric hobs as an indication of our cultural affinity for gas. As long as heating and cooking are framed around fossil fuels, there is little space in the cultural imagination to encourage a shift towards more sustainable energy sources.

“The example of TV-chefs shunning electric hobs is an indication of our cultural affinity for gas”. Image source.

Among the questions following the keynote, one quizzed Lord Duncan about the process and politics of outsourcing carbon emissions. Lord Duncan stressed his support of Border Carbon Adjustments compliant with EU and global carbon policy ‘in lock-step with our partners’ to ensure that carbon emissions are not simply exported, which appears to support the carbon club concept. Another question targeted the UK’s favourable regulatory environment that has been created around gas, which has resulted in the EU’s lowest gas prices, while electricity prices are highest in Europe, due, among other things, to Climate Change Levies, which do not apply to gas, increasing by 46% on 1 April 2019. Lord Duncan pointed towards the ongoing review of policies ahead of the publication of the 2020 heat roadmap which will hopefully take a more vector- and technology-neutral approach. A subsequent rebuttal by a Committee on Climate Change (CCC) representative stressed the CCCs recommendation to balance policy cost between gas and electricity as on average only 20,000 heat pumps are sold in the UK every year (compared to 7 times as many in Sweden) yet the Renewable Heat Incentive is about to be terminated without an adequate replacement to support the diffusion of low-carbon electric heating technologies.

Lord Duncan stressed the need to create a simple ‘road’ which does not fall with changes in policy and once again emphasized the need for a cross-party road to support the creation of a low-carbon heating pathway. A UKERC representative asked about the government approach to real-world data as opposed to modelling exercises and their support for collaborative research projects as both modelling and competitive approaches have failed, especially in relation to Carbon Capture and Storage. Lord Duncan responded that the UK is already collaborating with Denmark and Norway on CCS and that more money is being invested into scalable and replicable demonstrators.

Following an admission wrapped in metaphors that a change in government might be around the corner and that roadmaps need to outlast such changes, Lord Duncan departed to make way for Joanna Furtado, lead author of the Policy Connect report. She gave a very concise overview of the main findings and recommendations in the report:

  • The 80% 2050 carbon emission reduction target relative to 1990 already required over 20,000 households to switch to low-carbon heating every week between 2025 and 2050. The zero-carbon target requires even more rapid decarbonisation yet the most successful policy constellations to date have only succeeded in encouraging 2,000 households to switch to low-carbon heating every week.
  • This emphasizes the importance of households and citizens but many barriers to their engagement persist such as privacy issues, disruption associated with implementation, uncertainly, low priority, lack of awareness and confusion around best approaches, opportunities, regulations and support.
  • Despite the focus on households, large-scale rollout also requires the development of supply chains so at-scale demonstrations need to go hand-in-hand with protection and engagement of households by increasing the visibility of successful approaches. Community-led and local approaches have an important role to play but better monitoring is required to differentiate between more and less successful approaches.
  • Protection needs to be changed to facilitate the inclusion of innovative technologies which are rarely covered while installers need to be trained to build confidence in their installations.
  • Regional intermediaries, such as those in Scotland and Wales, need to be established to coordinate these efforts locally while at national level a central delivery body such as the one established for the 2020 Olympics in London needs to coordinate the actions of the regional intermediaries.
  • Ultimately, social aspects are critical to the delivery of low-carbon heat, ranging from the central delivery body through regional intermediaries down to households and citizens.


Image source.

Chaired by Maxine Frerk of Grid Edge Policy, the panel discussion kicked off with Alan Brown who stressed the urgency of the heating decarbonisation issue as encapsulated by Greta Thunberg and Extinction Rebellion and the need to operationalize the climate emergency into actions. He called for innovation in the gas grid in line with cautions Health and Safety Regulation alterations. Costs also need to be socialised to ensure that the low-carbon transition does not increase fuel poverty. His final point stressed the need reorganize government to make climate change and decarbonisation a number 1 priority.

Dr Alan Whitehead, who has been involved with the APPCCG from the beginning, emphasized how discussions around heat decarbonisation have progressed significantly in recent years and especially since the publication of the first report of this series. He suggested that the newest report writes the government roadmap for them. In relation to the wider context of decarbonising heat, Alan Whitehead encouraged a mainstreaming of heating literacy similar to the growing awareness of plastic. He also stressed how far the UK is lagging behind compared to other countries and this will be reflected in upcoming policies and roadmaps. As his final point Alan Whitehead cautioned that the low-intrusion option of gas-boiler upgrades from biomethane to hydrogen ignores the fact that greater change is necessary for the achievement of the zero-carbon target although he conceded that customer acceptance of gas engineer intervention appears to be high.

Dhara Vyas presented Citizens Advice perspective by stressing the importance of the citizen-consumer focus. Their research has revealed a lack of understanding among landlords and tenants of the rules and regulations that govern heat. She suggested that engagement with the public from the outset is essential to protect consumers as people are not sufficiently engaged with heating and energy in general. Even for experts it is very difficult to navigate all aspects of energy due to the high transaction costs associated with engagement to enable a transition on the scale required by government targets.

Finally, representatives of the two sponsors BAXI and the Energy & Utility Alliance made a rallying call for the transition of the gas grid towards hydrogen. Adam Turk emphasized the need to legislate and innovate appropriately to ensure that the 84% of households that are connected to the gas grid can receive upgrades to their boilers to make them hydrogen ready. Similarly, Mike Foster suggested that such an upgrade now takes less than 1 hour and that the gas industry already engages around 2 million consumers a year. Both suggested that the gas industry is well placed to put consumers at the heart of action. They were supported by several members of the audience who pointed towards the 150,000 trained gas service engineers and the ongoing distribution infrastructure upgrades towards plastic piping which facilitate a transition towards hydrogen. Other members of the audience, on the other hand, placed more emphasis on energy efficiency and the question of trust.

Sponsorship of the Institution of Gas Engineers & Managers, EUC (Energy & Utility Alliance) and BAXI Heating was evident in the title Future Gas Series and support for hydrogen and ‘minimal homeowner disruption’ boiler conversion to support this vector shift among members of the audience was evident. Nevertheless, several panel members, members of the audience and, above all, Lord Duncan of Springbank, stressed the need to consider a wider range of options to achieve the zero-carbon target. Electrification and heat pumps in particular were the most prominent among these options. Energy efficiency and reductions in energy demand, as is usual at such events, barely received a mention. I guess it’s difficult to cut a ribbon when there’s less of something as opposed to something new and shiny?

———————————————-
This blog is written by Dr Colin Nolden, Vice-Chancellor’s Fellow, University of Bristol Law School and Cabot Institute for the Environment.

Colin Nolden

UK Climate Projections 2018: From science to policy making

On a sunny day earlier this week, I attended the UK Climate Projections 2018: From science to policy making, meeting in Westminster on behalf of the Cabot Institute. Co-hosted by the All-Party Parliamentary Climate Change Group and the UK Met Office, the main purpose of this event was to forge discussions between scientists involved in producing the latest UK Climate Projections (UKCP18) and users from various sectors about the role of UKCP18 in increasing the UK’s preparedness of future climate change.

Many people in my constituency come and ask about climate change every day.

The event began with an opening remark by Rebecca Pow, the MP for Taunton Deane in Somerset. Somerset has seen some devastating floods over the years, and a new land drainage bill was passed a week prior to manage flood risk in the area. Constantly faced with questions from her constituents about climate change, Rebecca is particularly interested in regional climate change, both at present and in the future, and any opportunities that may arise from it.

Everyone would like a model of their back garden.

Prof Sir Brian Hoskins, the Founding Director and Chair of the Grantham Institute for Climate Change and the Environment, and Professor in Meteorology at the University of Reading, gave an overview on climate projection. He listed three main sources of uncertainty in 21st century climate projection: internal variability, model uncertainty, and human activity uncertainty. Climate scientists deal with these uncertainties by using large ensembles of simulations, a range of climate models, and a range of climate scenarios. However, there is always tension between model resolution, complexity and the need for many model runs in global climate projections due to constraints in computer resources. Regional climate models can be embedded in global domains to provide local weather and climate information, but they cannot correct large scale errors. The peer-reviewed UKCP18 provide both the statistics of global climate by combining data from different climate models and runs, and regional daily data for the UK and Europe.

A greater chance of warmer, wetter winters and hotter, drier summers.

This was one of the headline results from UKCP18 shown by Prof Jason Lowe, Head of Climate Services for Government at the Met Office Hadley Centre. UKCP18 is an update from its predecessor, UKCP09, but with constraints from new observations and data from more climate models from around the world. The horizontal resolution of regional climate projections for the UK and Europe has increased from 25 km in UKCP09 to 12 km in UKCP18, with an even higher resolution (2.2 km) dataset coming out in summer 2019. UKCP18 results show that all areas of the UK are projected to experience warming, with greater warming in the summer than the winter. Summer rainfall is expected to decrease in the UK, whereas winter precipitation is expected to increase. However, when it rains in summer it may rain harder. Sea-level rise will continue under all greenhouse gas emission scenarios at all locations around the UK, impacting extreme water levels in the future.

Heat and health inter-connections are complex.

Prof Sarah Lindley, Professor of Geography at the University of Manchester, shared how UKCP18 could be used to study the health effects of climate change and urban heat in the UK. Many of us would remember how hot it was last summer; by 2050, hot summers of that type may happen every other year, even under a low greenhouse gas emission scenario. The most extreme heat-related hazards are in cities due to the Urban Heat Island effect (UHI), i.e. urban areas are often warmer than surrounding rural areas. For instance, Manchester’s UHI intensity (difference between urban and rural temperatures) has increased significantly since the late 1990s. By the end of this century, the city of Manchester is projected to be 2.4ºC warmer than its surrounding rural area in a UKCP09 medium emission scenario. With an aging population, UK’s vulnerability to heat may increase in the future. Both exposure and vulnerability to heat contribute to heat disadvantage. High-resolution UKCP18 data, together with social vulnerability maps of the UK, provide new opportunities to heat disadvantage and adaptation research.

European birds will need to shift about 550 km north-east under 3ºC warming.

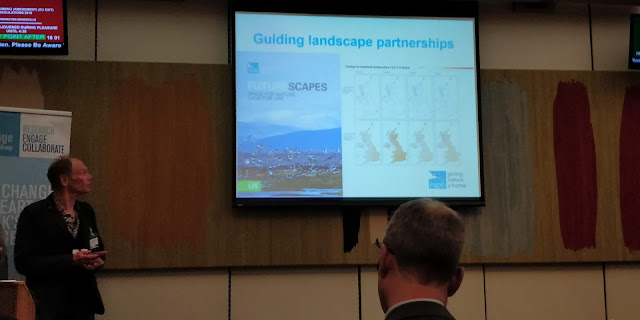
The next speaker was Dr Olly Watts, Senior Climate Change Policy Officer for the RSPB, the largest nature conservation charity in the UK. Climate adaptation is an important aspect of nature conservation work, as it should be in everyone’s work. The Climatic Atlas of European Breeding Birds finds that not only will European birds shift 550 km under a likely 3ºC increase in global average temperature, but also a quarter of the bird species will be at high risk. Currently 5000 bird species are changing species distribution, and they face an uncertain future. The UKCP18 data of 2-4ºC warmer worlds could be used to derive qualitative strategies to build wildlife resilience against climate change. Adaptation strategies including informing nature reserve management will be in place across the RSPB conservation programme. The RSPB will also use UKCP18 data to raise public awareness of climate change.

Water demand can increase by 30% on a hot day.

Dr Geoff Darch, Water Resources Strategy Manager at Anglian Water, began his talk by highlighting the inherent climate vulnerabilities in water management in the East of England. It is a “water stressed” region that has low lying and extensive coastline, sensitive habitats, and vulnerable soils. On a hot day, water demand can go up by 30%. Climate change alone is expected to have a total impact of 55 Ml/day on water supplies in the region by 2045. A growing risk of severe drought means an additional impact of 26 Ml/day is expected, not to mention the impacts of population growth. The water industry is proactively adapting to these challenges by setting up plans to reduce leakage and install smart meters for customers. UKCP09 has been used extensively for climate change risk assessment across the water sector; the latest UKCP18 could be used in hydrological modelling, demand modelling, storm impact modelling, flood risk assessment, and sensitivity testing to assess the robustness of water resources management solutions under a range of climate scenarios.

————————————-
This blog was written by Cabot Institute member Dr Eunice Lo, from the School of Geographical Sciences at the University of Bristol. Her research focusses on climate change, extreme weather and human health.

Dr Eunice Lo


Back to the Future ‘Hothouse’

Our current global warming target and the trajectory it places us on, towards a future ‘Hothouse Earth’, has been the subject of much recent discussion, stimulated by a paper by Will Steffen and colleagues.  In many respects, the key contribution of this paper and similar work is to extend the temporal framing of our climate discussions, beyond 2100 for several centuries or more.  Analogously, it is useful to extend our perspective backwards to similar time periods, to reflect on the last time Earth experienced such a Hothouse state and what it means.

The Steffen et al paper allows for a variety of framings, all related to the range of natural physical, biological and chemical feedbacks that will amplify or mitigate the human intervention in climate.  [Note: the authors frame their paper around the concept of a limited number of steady state scenarios/temperatures for the Earth.  They then argue that aiming for 2C, potentially an unstable state, could trigger feedbacks tipping the world towards the 4C warmer Hothouse.  I find that to be somewhat simplistic given the diversity of climate states that have existed, if even transiently, over the past 15 million years, but that is a discussion for another day.] From my perspective, the most useful framing – and one that remains true to the spirit of the paper is this: We have set a global warming limit of 2C by 2100, with an associated carbon budget. What feedback processes will that carbon budget and warming actually unleash over the coming century,  how much additional warming will they add, and when?

That is a challenging set of questions that comes with a host of caveats, most related to the profound uncertainty in the interlinked biogeochemical processes that underpin climate feedbacks. For example, as global warming thaws the permafrost, will it release methane (with a high global warming potential than carbon dioxide)? Will the thawed organic matter oxidise to carbon dioxide or will it be washed and buried in the ocean? And will the increased growth of plants under warmer conditions lead instead to the sequestration of carbon dioxide? The authors refer to previous studies that suggest a permafrost feedback yielding an additional 0.1C warming by the end of the century; but there is great uncertainty in both the magnitude of that impact and its timing.

And timing is the great question at the heart of this perspective piece.  I welcome it, because too often our perspective is fixed on the arbitrary date of 2100, knowing full well that the Earth will continue to warm and ice continue to melt long after that date.  In this sense, Steffen et al is not a contradiction to what has been reported from the IPCC but an expansion on it.

Classically, we discuss these issues in terms of fast and slow feedbacks, but in fact there is a continuum between near instantaneous feedbacks and those that act over hundreds, thousands or even millions of years.  A warmer atmosphere will almost immediately hold more water vapour, providing a rapid positive feedback on warming – and one that is included in all of those IPCC projections.  More slowly, soil carbon, including permafrost, will begin to oxidise, with microbial activity stimulated and accelerated under warmer conditions – a feedback that is only just now being included in Earth system models.  And longer term, all manner of processes will come into play – and eventually, they will include the negative feedbacks that have helped regulate Earth’s climate for the past 4 billion years.

There is enough uncertainty in these processes to express caution in some of the press’s more exuberant reporting of this topic.  But lessons from the past certainly underscore the concerns articulated by Steffen et al.  We think that the last time Earth had 410 ppm CO2, a level similar to what you are breathing right now, was the Pliocene about 3 million years ago.  This was a world that was 1 to 2C warmer than today (i.e. 2 to 3C warmer than the pre-industrial Earth) and with sea levels about 10 m higher.  This suggests that we are already locked into a world that far exceeds the ambitions and targets of the Paris Agreement.  This is not certain as we live on a different planet and one where the great ice sheets of Greenland and Antarctica might not only be victims of climate change but climate stabilisers through ice-sheet hysteresis. And even if a Pliocene future is fixed, it might take centuries for that warming and sea level change to be realised.

But that analogue does suggest caution, as advocated by the Hothouse Earth authors.

It also prompts us to ask what the Earth was like the last time its atmosphere held about 500 ppm CO2, similar to the level needed to achieve the Paris Agreement to limit end-of-century warming below 2C.  A useful analogue for those greenhouse gas levels is the Middle Miocene Climate Optimum, which occurred from 17 to 14.7 million years ago.

Figure showing changes in ocean temperature (based on oxygen isotopic compositions of benthic foraminifera) and pCO2 over the past 60 million years (from Palaeo-CO2).  Solid symbols are from the d11B isotope proxy and muted symbols are from the alkenone-based algal carbon isotope fractional proxy. Note the spike in pCO2 associated with the MMCO at about 15 million years ago.

As one would expect for a world with markedly higher carbon dioxide levels, the Miocene was hotter than the climate of today.  And consistent with many of Steffen et al.’s arguments, it was about 4C hotter rather than a mere 2C, likely due to the range of carbon cycle and ice-albedo feedbacks they describe.  But such warmth was not uniform – globally warmer temperatures of 4C manifest as far hotter temperatures in some parts of the world and only slightly warmer temperatures elsewhere. Pollen and microbial molecular fossils from the North Sea, for example, indicate that Northern Europe experienced sub-tropical climates.

But what were the impacts of this warmth?  What is a 4C warmer world like?  To understand that, we also need to understand the other ways in which the Miocene world differed from ours, not just due to carbon dioxide concentrations but also the ongoing movement of the continents and the continuing evolution of life.  In both respects, the Miocene was broadly similar to today.  The continents were in similar positions, and the geography of the Miocene is one we would recognise. But there were subtle differences, including the ongoing uplift of the Himalayas and the yet-to-be-closed gateway between North and South America, and these subtle differences could have had major impacts on Asian climate and the North Atlantic circulation, respectively.

Similarly, the major animal groups had evolved by this point, and mammals had firmly established their dominance in a world separated by 50 million years from the dinosaurs.  Remnant groups from earlier times (hell pigs!) still terrorised the landscape, but many of the groups were the same or closely related to those we would recognise today.  And although hominins would not appear until the end of the Miocene, the apes had become well established, represented by as many as a 100 species. In the oceans, the differences were perhaps more apparent, the seas thriving with the greatest diversity of cetaceans in the history of our planet and associated with them the gigantic macro-predators such as Charcharadon megalodon (The MegTM).

Smithsonian mural showing Miocene Fauna and landscape.

But it is the plants that exhibit the most pronounced differences between modern and Miocene life. Grasses had only recent proliferated across the planet at the time of the MMCO, and the C4 plants had yet to expand to their current dominance. And in this regard, the long-term evolution of Earth’s climate likely played a crucial role.  There are about 8100 species of C4 plants (although this comprises only 3% of the plant species known to us) and most of these are grasses with other notable species being maize and sugar cane. They are distinguished from the dominant C3 plants, which comprise almost all other species, by virtue of their carbon dioxide assimilation biochemistry (the Hatch-Slack mechanism) and their leaf cellular physiology (the Kranz leaf anatomy).  It is a collective package that is exceptionally well adapted to low carbon dioxide conditions, and their global expansion about 7 million years ago was almost certainly related to the long-term decline in carbon dioxide from the high levels of the Middle Miocene. Although C4 plants only represent a small proportion of modern plant species, the Miocene world, bereft of them, would have looked far different than today – lacking nearly half of our modern grass species and by extension clear analogues to the vast African savannahs.

Aside from these, the most profound differences between the Miocene world and that of today would have been the direct impacts of higher global temperatures.  There is strong evidence that the Greenland ice sheet was far reduced in size compared to that of today, and its extent and even whether or not it was a persistent ice sheet or an ephemeral one remains the subject of debate. Similarly, West Antarctica was likely devoid of permanent ice, and the East Antarctic Ice Sheet was probably smaller – perhaps far smaller – than it is today.  And collectively, these smaller ice sheets were associated with a sea level that was about 40 m higher than that of today.

The hot Miocene world would have been different in other ways, including the hydrological cycle.  Although less studied than for other ancient intervals, it is almost certain that elevated warmth – and markedly smaller equator-to-pole temperature differences – would have impacted the global distribution of water.  More water was evidently exported to the high latitudes, resulting in a warmer and vegetated Antarctica where the ice had retreated. It was also likely associated with far more extreme rainfall events, with the hot air able to hold greater quantities of water.  More work is needed, but it is tempting to imagine the impact of these hot temperatures and extreme rainfall events.  They would have eroded the soil and flushed nutrients to the sea, perhaps bringing about the spread of anoxic dead zones, similar to the Oceanic Anoxic Events of the Mesozoic or the dead zones of modern oceans caused by agricultural run-off. Indeed, the Miocene is characterised by the deposition of some very organic-rich rocks, including the North Pacific Monterey Formation, speaking to the occurrence of reduced oxygen levels in parts of these ancient oceans.

****************************************************

It is unclear if our ambitions to limit global warming to 2C by the end of this century really have put us on a trajectory for 4C. It is unclear if we are destined to return to the Miocene.

But if so, the Miocene world is one both similar to but markedly distinct from our own – a world of hotter temperatures, extremes of climate, fewer grasslands, Antarctic vegetation, Arctic forests and far higher sea levels. Crucially, it is not the world for which our current society, its roads, cities, power plants, dams, borders, farmlands and treaties, has been designed.

Moreover, the MMCO Earth is a world that slowly evolved from an even warmer one over millions of years*; and that then evolved over further millions of years to the one in which we now inhabit. It is not a world that formed in a hundred or even a thousand years.  And that leaves us three final lessons from the past.  First, we do not know how the life of this planet, from coral reefs to the great savannahs, will respond to such geologically rapid change.  Second, we do not know how we will respond to such rapid change; if we must adapt, we must learn how to do so creatively, flexibly and equitably.  And third, it is probably not too late to prevent such a future from materialising, but even if it is, we still must act to slow down that rate of change to which we must adapt.

And we still must act to ensure that our future world is only 4C hotter and analogous to the Miocene; if we fail to act, the world will be even hotter, and we will have to extend our geological search 10s of millions of years further into the past, back to the Eocene, to find an even hotter and extreme analogue for our future Hothouse World.

*The final jump into the MMCO appears to have been somewhat more sudden, but still spanned around two-hundred thousand years.  A fast event geologically but not on the timescales of human history.

——————————-
This blog is written by Cabot Institute member Professor Rich Pancost, Head of Earth Sciences at the University of Bristol. This blog has been reposted with kind permission from Rich’s original blog.

Rich Pancost

Will July’s heat become the new normal?

Saddleworth Moor fire near Stalybridge, England, 2018.  Image credit: NASA

For the past month, Europe has experienced a significant heatwave, with both high temperatures and low levels of rainfall, especially in the North. Over this period, we’ve seen a rise in heat-related deaths in major cities, wildfires in Greece, Spain and Portugal, and a distinct ‘browning’ of the European landscape visible from space.

As we sit sweltering in our offices, the question on everyone’s lips seems to be “are we going to keep experiencing heatwaves like this as the climate changes?” or, to put it another way, “Is this heat the new norm?”

Leo Hickman, Ed Hawkins, and others, have spurred a great deal of social media interest with posts highlighting how climate events that are currently considered ‘extreme’, will at some point be called ‘typical’ as the climate evolves.

As part of a two-year project on how future climate impacts different sectors (www.happimip.org), my colleagues and I have been developing complex computer simulations to explore our current climate as well as possible future climates. Specifically, we’re comparing what the world will look like if we meet the targets set out in the Paris agreement: to limit the global average temperature rise to a maximum of 2.0 degrees warming above pre-industrial levels but with the ambition of limiting warming to 1.5 degrees.

The world is already around 1 degree warmer on average than pre-industrial levels, and the evidence to date shows that every 0.5 degree of additional warming will make a significant difference to the weather we experience in the future.

So, we’ve been able to take those simulations and ask the question: What’s the probability of us experiencing European temperatures like July 2018 again if:

  1. We don’t emit any further greenhouse gases and things stay as they are (1 degree above pre-industrial levels).
  2. Greenhouse gas emissions are aggressively reduced, restricting global average temperature rise to 1.5 degrees above pre-industrial levels.
  3. Greenhouse gas emissions are reduced to a lesser extent, restricting global average temperature rise by 2 degrees above pre-industrial levels.

What we’ve found is that European heat of at least the temperatures we have experienced this July are likely to re-occur about once every 5-6 years, on average, in our current climate. While this seems often, remember we have already experienced 1C of global increase in temperature. We’ve also considered the temperature over the whole of Europe, not just focusing on the more extreme parts of the heatwave. If we considered only the hottest regions, this would push our current temperature re-occurrence times closer to 10-20 years. However, using this Europe-wide definition of the current heat event, we find that in the 1.5C future world, temperatures at least this high would occur every other year, and in a 2C world, four out of five summers would likely have heat events that are at least as hot as our current one. Worryingly, our current greenhouse gas emission trajectory is leading us closer to 3C, so urgent and coordinated action is still needed from our politicians around the world.

Our climate models are not perfect, and they cannot capture all aspects of the current heatwave, especially concerning the large-scale weather pattern that ‘blocked’ the cooler air from ending our current heatwave. These deficiencies increase the uncertainty in our future projections, but we still trust the ball-park figures.

Whilst these results are not peer-reviewed, and should be considered as preliminary findings, it is clear that the current increased heat experienced over Europe has a significant impact on society, and that there will be even more significant impacts if we were to begin experiencing these conditions as much as our analysis suggests.

Cutting our emissions now will save us a hell of a headache later.

—————————–
This blog is written by Dr Dann Mitchell (@ClimateDann) and Peter Uhe from the University of Bristol Geographical Sciences department and the Cabot Institute for the Environment.

Dann Mitchell