Earth’s greatest mass extinction 250 million years ago shows what happens when El Niño gets out of control – new study

252 million years ago, there was only one supercontinent: Pangaea.
ManuMata / shutterstock

Around 252 million years ago, the world suddenly heated up. Over a geologically brief period of tens of thousands of years, 90% of species were wiped out. Even insects, which are rarely touched by such events, suffered catastrophic losses. The Permian-Triassic mass extinction, as it’s known, was the greatest of the “big five” mass extinctions in Earth’s history.

Scientists have generally blamed the mass extinction on greenhouse gases released from a vast network of volcanoes which covered much of modern day Siberia in lava. But the volcanic explanation was incomplete. In our new study, we show that an enormous El Niño weather pattern in the world’s major ocean added to climate chaos and led to extinctions spreading across the globe.

It’s easy to see why volcanoes were blamed. The onset of extinction coincides almost perfectly with the beginning of the second phase of volcanism in the region known as the Siberian Traps. This led to acid rain, oceans losing their oxygen and, most notably, temperatures beyond the tolerance levels of almost all organisms. It was the greatest episode of global warming in the past 500 million years.

The world 252 million years ago

Map of world with one big supercontinent
Alex Farnsworth

However, there were outstanding questions for proponents of this seemingly simple extinction scenario: when the tropics became too hot, why did species not just migrate to cooler, higher latitudes (as is happening today)? If warming was sudden and rapid, why did species on land die off tens of thousands of years before those in the sea?

There have also been many instances of volcanic eruptions of similar scale, and even other episodes of rapid warming, but why did none of these cause a similarly catastrophic mass extinction?

Our new study reveals that the oceans rapidly heated up all across the world’s low and mid latitudes. Normally, it gets cooler as you move away from the tropics, but not this time. It simply became too hot for life in too many places.

A world prone to extremes

Using a state-of-the-art computer program, we were able to simulate what the weather and climate was like 252 million years ago. We found that, even before the rapid warming, the world would have been prone to extremes of temperature and rainfall.

That’s a consequence of all the land at the time forming into one large supercontinent, Pangaea. This meant that the climates we see today at the centre of continents – dry, with hot summers and freezing winters – were magnified.

Pangaea was surrounded by a vast ocean, Panthalassa, the surface of which would fluctuate between warm and cool periods over the years, much like the El Niño phenomenon in the Pacific today. Yet once the mass Siberian volcanism started and carbon dioxide in the atmosphere increased, those prehistoric El Niños became more intense and lasted longer thanks to the larger Panthalassa ocean being able to store more heat.

An El Niño far stronger than anything today

chart of el nino fluctuations
Change in sea surface temperature (SST) compared to the long-term average. El Niño conditions are red, La Niña (or its prehistoric equivalent) is blue. Left = modern day pre-industrial Pacific Ocean. Centre = 252 million years ago, before the Siberian Traps volcanism. Right = at the peak of the mass extinction.
Alex Farnsworth

These El Niños had a profound impact on life on land, and kicked off a sequence of events that made the climate more and more extreme. Temperatures got hotter, especially in the tropics, and huge droughts and fires caused tropical forests to die off.

This in turn was bad news for the climate, as less carbon was stored by trees, allowing more to linger in the atmosphere, leading to further warming, and even stronger and longer El Niños.

252 million years ago, pre crisis:

Animated map of temperature 252m years ago
Before the Siberian Traps volcanism 252 million years ago, the world was slightly hotter than today. (Animation shows average monthly temperatures according to the authors’ climate model).
Alex Farnsworth

These stronger El Niños caused the extreme temperatures and droughts to push outside of the tropics towards the poles, and more vegetation died off and more carbon was released. Over tens of thousands of years, extreme temperatures spread over much of the world’s surface. Eventually, the warming began to harm life in the oceans, particularly tiny organisms at the bottom of the food chain.

…and at the peak of the extinction:

Animated map of temperature 252m years ago
At the peak of the extinction, temperatures regularly soared far above 40°C.
Alex Farnsworth

During the peak of the crisis, in a world that was already warming thanks to volcanic gases, an El Niño would boost average temperatures by a further 4°C. That’s more than three times the total warming we have caused over the past few centuries. Back then, the El Niño-charged climate would have regularly seen peak daytime temperatures on land of 60°C or more.

The future of El Niño

In recent years El Niños have caused major changes to rainfall and temperature patterns, around the Pacific and even further afield. A strong El Niño was a factor in record-breaking temperatures through 2023 and 2024.

Fortunately, such events typically only last a few years. However, on top of human-caused warming, even these smaller scale El Niños of the present day may be enough to push fragile ecosystems beyond their limit.

El Niño is predicted to become more variable as the climate changes, though we should note that the oceans are still yet to fully respond to current warming rates. At present, nobody is forecasting another mass extinction on the scale of the one 252 million years ago, but that event provides a worrying snapshot of what happens when El Niño gets out of control.The Conversation

———————————

This blog is written by Dr Alex Farnsworth, Senior Research Associate in Meteorology, University of Bristol; David Bond, Palaeoenvironmental Scientist, University of Hull, and Paul Wignall, Professor of Palaeoenvironments, University of LeedsThis article is republished from The Conversation under a Creative Commons license. Read the original article.

East Africa must prepare for more extreme rainfall during the short rainy season – new study

Rainy season in Kenya

East Africa has recently had an unprecedented series of failed rains. But some rainy seasons are bringing the opposite: huge amounts of rainfall.

In the last few months of 2023, the rainy season known as the “short rains” was much wetter than normal. It brought severe flooding to Kenya, Somalia and Tanzania. In Somalia, more than 2 million people were affected, with over 100 killed and 750,000 displaced from their homes. Tens of thousands of people in northern Kenya lost livestock, farmland and homes.

The very wet short rainy seasons are linked to a climate event known as a positive Indian Ocean Dipole (known as the “IOD”). And climate model projections show an increasing trend of extreme Indian Ocean dipoles.

In a new research paper, we set out to investigate what effect more frequent extreme Indian Ocean Dipole events would have on rainfall in east Africa. We did this using a large number of climate simulations and models.

Our results show that they increase the likelihood of very wet days – therefore making very wet seasons.

This could lead to extreme weather events, even more extreme than the floods of 1997, which led to 10 million people requiring emergency assistance, or those of 2019, when hundreds of thousands were displaced.

We recommend that decision-makers plan for this kind of extreme rainfall, and the resulting devastating floods.

How the Indian Ocean Dipole works

Indian Ocean Dipole events tend to occur in the second half of the year, and can last for months. They have two phases: positive and negative.

Positive events occur when the temperature of the sea surface in the western Indian Ocean is warmer than normal and the temperature in the eastern Indian Ocean is cooler than normal. Put simply, this temperature difference happens when winds move warmer water away from the ocean surface in the eastern region, allowing cooler water to rise.

In the warmer western Indian Ocean, more heated air will rise, along with water vapour. This forms clouds, bringing rain. Meanwhile, the eastern part of the Indian Ocean will be cooler and drier. This is why flooding in east Africa can happen at the same time as bushfires in Australia.

The opposite is true for negative dipole events: drier in the western Indian Ocean and wetter in the east.

Under climate change we’re expecting to see more frequent and more extreme positive dipole events – bigger differences between east and west. This is shown by climate model projections. They are believed to be driven by different paces of warming across the tropical Indian Ocean – with western and northern regions projected to warm faster than eastern parts.

Often heavy rain seasons in east Africa are attributed to El Niño, but recent research has shown that the direct impact of El Niño on east African rainfall is actually relatively modest. El Niño’s principal influence lies in its capacity to bring about positive dipole events. This occurs since El Niño events tend to cool the water in the western Pacific Ocean – around Indonesia – which also helps to cool down the water in the eastern Indian Ocean. These cooler temperatures then help kick-start a positive Indian Ocean Dipole.

Examining unprecedented events

Extreme positive Indian Ocean Dipole events are rare in the recent climate record. So to examine their potential impacts on rainfall extremes, we used a large set of climate simulations. The data allowed us to diagnose the sensitivity of rainfall to larger Indian Ocean Dipole events in a statistically robust way.

Our results show that as positive dipole events become more extreme, more wet days during the short rains season can be expected. This effect was found to be largest for the frequency of extremely wet days. Additionally, we found that as the dipole strength increases, the influence on the most extreme days becomes even larger. This means that dipole events which are even slightly “record-breaking” could lead to unprecedented levels of seasonal rainfall.

Ultimately, if positive Indian Ocean Dipole seasons increase in frequency, as predicted, regular seasons of flooding impacts will become a new normal.

One aspect not included in our analysis is the influence of a warmer atmosphere on rainfall extremes. A warmer atmosphere holds more moisture, allowing for the development of more intense rain storms. This effect could combine with the influence of extreme positive dipoles to bring unprecedented levels of rainfall to the Horn of Africa.

2023 was a year of record-breaking temperatures driven both by El Niño and global warming. We might expect that this warmer air could have intensified rain storms during the season. Indeed, evidence from a recent assessment suggests that climate change-driven warming is highly likely responsible for increased rainfall totals.

Responding to an unprecedented future

Policymakers need to plan for this.

In the long term it is crucial to ensure that any new infrastructure is robust to withstand more frequent and heavier rains, and that government, development and humanitarian actors have the capacity to respond to the challenges.

Better use of technology, such as innovations in disseminating satellite rainfall monitoring via mobile phones, can communicate immediate risk. New frontiers in AI-based weather prediction could improve the ability to anticipate localised rain storms, including initiatives focusing on eastern Africa specifically.

Linking rainfall information with hydrological models designed for dryland environments is also essential. These will help to translate weather forecasts into impact forecasts, such as identifying risks of flash flooding down normally dry channels or bank overflow of key rivers in drylands.

These technological improvements are crucial. But better use of the forecast information we already have can also make a big difference. For instance, initiatives like “forecast-based financing”, pioneered by the Red Cross Red Crescent movement, link forecast triggers to pre-approved financing and predefined action plans, helping communities protect themselves before hazards have even started.

For these endeavours to succeed, there must be dialogue between the science and practitioner communities. The scientific community can work with practitioners to integrate key insights into decisions, while practitioners can help to ensure research efforts target critical needs. With this, we can effectively build resilience to natural hazards and resist the increasing risks of our changing climate.The Conversation

———————————

This blog is written by David MacLeod, Lecturer in Climate Risk, Cardiff University; Erik W. Kolstad, Research professor, Uni Research; Cabot Institute for the Environment member Katerina Michaelides, Professor of Dryland Hydrology, School of Geographical Sciences, University of Bristol, and Michael Singer, Professor of Hydrology and Geomorphology, Cardiff University. This article is republished from The Conversation under a Creative Commons license. Read the original article.

Insects will struggle to keep pace with global temperature rise – which could be bad news for humans

Animals can only endure temperatures within a given range. The upper and lower temperatures of this range are called its critical thermal limits. As these limits are exceeded, an animal must either adjust or migrate to a cooler climate.

However, temperatures are rising across the world at a rapid pace. The record-breaking heatwaves experienced across Europe this summer are indicative of this. Heatwaves such as these can cause temperatures to regularly surpass critical thermal limits, endangering many species.

In a new study, my colleagues and I assessed how well 102 species of insect can adjust their critical thermal limits to survive temperature extremes. We found that insects have a weak capacity to do so, making them particularly vulnerable to climate change.

The impact of climate change on insects could have profound consequences for human life. Many insect species serve important ecological functions while the movement of others can disrupt the balance of ecosystems.

How do animals adjust to temperature extremes?

An animal can extend its critical thermal limits through either acclimation or adaptation.

Acclimation occurs within an animal’s lifetime (often within hours). It’s the process by which previous exposure helps give an animal or insect protection against later environmental stress. Humans acclimate to intense UV exposure through gradual tanning which later protects skin against harmful UV rays.

One way insects acclimate is by producing heat shock proteins in response to heat exposure. This prevents cells dying under temperature extremes.

A ladybird drinking a speck of water on a narrow leaf.
Insects in warmer environments develop fewer spots to reduce heat retention.
mehmetkrc/Shutterstock

Some insects can also use colour to acclimate. Ladybirds that develop in warm environments emerge from the pupal stage with less spots than insects that develop in the cold. As darker spots absorb heat, having fewer spots keeps the insect cooler.

Adaptation occurs when useful genes are passed through generations via evolution. There are multiple examples of animals evolving in response to climate change.

Over the past 150 years, some Australian parrot species such as gang-gang cockatoos and red-rumped parrots have evolved larger beaks. As a greater quantity of blood can be diverted to a larger beak, more heat can be lost into the surrounding environment.

A colourful red-rumped parrot perched on a branch.
The red-rumped parrot has evolved a larger beak to cope with higher temperatures.
Alamin-Khan/Shutterstock

But evolution occurs over a longer period than acclimation and may not allow critical thermal limits to adjust in line with the current pace of global temperature rise. Upper thermal limits are particularly slow to evolve, which may be due to the large genetic changes required for greater heat tolerance.

Research into how acclimation might help animals survive exceptional temperature rise has therefore become an area of growing scientific interest.

A weak ability to adjust to temperature extremes

When exposed to a 1℃ change in temperature, we found that insects could only modify their upper thermal limit by around 10% and their lower limit by around 15% on average. In comparison, a separate study found that fish and crustaceans could modify their limits by around 30%.

But we found that there are windows during development where an insect has a greater tolerance towards heat. As juvenile insects are less mobile than adults, they are less able to use their behaviour to modify their temperature. A caterpillar in its cocoon stage, for example, cannot move into the shade to escape the heat.

Exposed to greater temperature variations, this immobile life stage has faced strong evolutionary pressure to develop mechanisms to withstand temperature stress. Juvenile insects generally had a greater capacity for acclimating to rising temperatures than adult insects. Juveniles were able to modify their upper thermal limit by 11% on average, compared to 7% for adults.

But given that their capacity to acclimate is still relatively weak and may fall as an insect leaves this life stage, the impact is likely to be limited for adjusting to future climate change.

What does this mean for the future?

A weak ability to adjust to higher temperatures will mean many insects will need to migrate to cooler climates in order to survive. The movement of insects into new environments could upset the delicate balance of ecosystems.

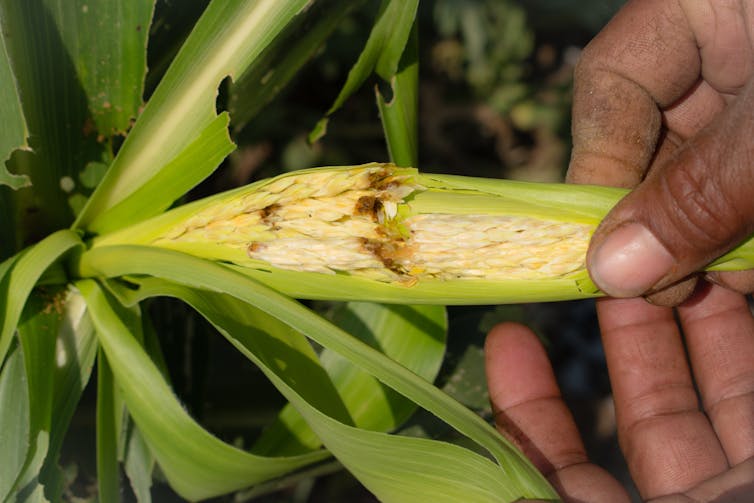
Insect pests account for the loss of 40% of global crop production. As their geographical distribution changes, pests could further threaten food security. A UN report from 2021 concluded that fall armyworm populations, which feed on crops such as maize, have already expanded their range due to climate change.

A damaged corn crop following an attack by fall armyworms.
The fall armyworm is a damaging crop pest which is spreading due to climate change.
Alchemist from India/Shutterstock

Insect migration may also carry profound impacts on human health. Many of the major diseases affecting humans, including malaria, are transmitted by insects. The movement of insects over time increases the possibility of introducing infectious diseases to higher latitudes.

There have been over 770 cases of West Nile virus recorded in Europe this year. Italy’s Veneto region, where the majority of the cases originate, has emerged as an ideal habitat for Culex mosquitoes, which can host and transmit the virus. Earlier this year, scientists found that the number of mosquitoes in the region had increased by 27%.

Insect species incapable of migrating may also become extinct. This is of concern because many insects perform important ecological functions. Three quarters of the crops produced globally are fertilised by pollinators. Their loss could cause a sharp reduction in global food production.

The vulnerability of insects to temperature extremes means that we face an uncertain and worrying future if we cannot curb the pace of climate change. A clear way of protecting these species is to slow the pace of climate change by reducing fossil fuel consumption. On a smaller scale, the creation of shady habitats, which contain cooler microclimates, could provide essential respite for insects facing rising temperatures.The Conversation

—————————-

This blog is written by Hester Weaving, PhD Candidate in Entomology, University of BristolThis article is republished from The Conversation under a Creative Commons license. Read the original article.
Hester Weaving


India heatwave: why the region should prepare for even more extreme heat in the near future

An extreme heatwave in India and Pakistan has left more than a billion people in one of the most densely populated parts of the world facing temperatures well above 40℃. Although this has not broken all-time records for the regions, the hottest part of the year is yet to come.

Though the heatwave is already testing people’s ability to survive, and has led to crop failures and power blackouts, the really scary thing is that it could be worse: based on what has happened elsewhere at some point India is “due” an even more intense heatwave.

Together with a few other climate scientists, we recently looked for the most extreme heatwaves globally over the past 60 years – based on the greatest difference from expected temperature variability in that area, rather than by maximum heat alone. India and Pakistan do not feature in our results, now published in the journal Science Advances. Despite regularly having extremely high temperatures and levels of heat stress in absolute terms, when defined in terms of deviation from the local normal, heatwaves in India and Pakistan to date have not been all that extreme.

In fact, we highlighted India as a region with a particularly low greatest historical extreme. In the data we assessed, we didn’t find any heatwaves in India or Pakistan outside three standard deviations from the mean, when statistically such an event would be expected once every 30 or so years. The most severe heatwave we identified, in southeast Asia in 1998, was five standard deviations from the mean. An equivalent outlier heatwave in India today would mean temperatures of over 50℃ across large swaths of the country – such temperatures have only been seen at localised points so far.

Our work therefore suggests India may experience even more extreme heat. Assuming the statistical distribution of daily maximum temperatures is broadly the same across the world, statistically a record-breaking heatwave is likely to occur in India at some point. The region has not yet had reason to adapt to such temperatures, so may be particularly vulnerable.

Harvests and health

Although the current heatwave has not broken any all-time records, it is still exceptional. Many parts of India have experienced their hottest April on record. Such heat this early in the year will have devastating impacts on crops in a region where many rely on the wheat harvest both to eat and to earn a living. Usually, extreme heat in this area is closely followed by cooling monsoons – but these are still months away.

It is not just crop harvests that will bear the brunt, as heatwaves affect infrastructure, ecosystems and human health. The impacts on human health are complex as both meteorological factors (how hot and humid it is) and socioeconomic factors (how people live and how they are able to adapt) come into play. We do know that heat stress can lead to long-term health issues such as cardiovascular diseases, kidney failure, respiratory distress and liver failure, though we will be unable to know exactly how many people will die in this heatwave due to the lack of necessary health data from India and Pakistan.

What the future holds

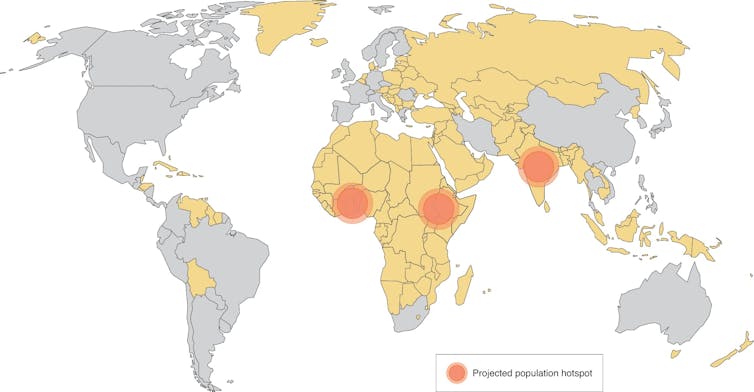
To consider the impact of extreme heat over the next few decades, we have to look at both climate change and population growth, since it is a combination of the two that will amplify the human-health impacts of heat extremes in the Indian subcontinent.

world map with some countries shaded yellow
Hotspots of population increases over the next 50 years (red circles), all coincide with locations where no daily mortality data exists (yellow).
Mitchell, Nature Climate Change (2021), CC BY-SA

In our new study, we investigated how extremes are projected to increase in the future. We used a large ensemble of climate model simulations, which gave us many times more data than is available for the real world. We found that the statistical distribution of extremes, relative to a shift in the underlying climate as it generally gets warmer, does not change. In the climate models the daily temperature extremes increase at the same rate as the shift in the mean climate. The IPCC’s latest report stated that heat waves will become more intense and more frequent in south Asia this century. Our results support this.

The current heatwave is affecting over 1.5 billion people and over the next 50 years the population of the Indian subcontinent is projected to increase by a further 30%. That means hundreds of millions more people will be born into a region that is likely to experience more frequent and more severe heatwaves. With even larger numbers of people being affected by even greater heat extremes in the future, measures to adapt to climate change must be accelerated – urgently.The Conversation

————————-

This blog is written by Cabot Institute for the Environment members Dr Vikki Thompson, Senior Research Associate in Geographical Sciences, University of Bristol and Dr Alan Thomas Kennedy-Asser, Research Associate in Climate Science, University of Bristol.

This article is republished from The Conversation under a Creative Commons license. Read the original article.
Beast from the East 2? What ‘sudden stratospheric warming’ involves and why it can cause freezing surface weather


Darryl Fonseka / shutterstock

A “sudden stratospheric warming” event took place in early January 2021, according to the Met Office, the UK’s national weather service. These events are some of the most extreme of atmospheric phenomena, and I study them as part of my academic research. The stratosphere is the layer of the atmosphere from around 10km to 50km above the Earth’s surface, and sudden warming up there can lead to very cold weather over Europe and Siberia, with an increased possibility of snow storms.


In winter the polar regions are in darkness 24 hours a day, and so the stratosphere over the north pole drops to -60℃ or even lower. The pole is surrounded by strong westerly winds, forming what is known as the polar vortex, a normal occurrence which develops every winter. However, about six times a decade, this vortex can break down in dramatic fashion. This can lead to temperatures over the pole increasing by up to 50°C over a few days, although temperatures are so low that they still remain below freezing. The average wind direction around the pole may also reverse, in which case a “sudden stratospheric warming” event has occurred.

The disturbance in the stratosphere can then be transmitted downward through the atmosphere. If this disturbance reaches the lower levels of the atmosphere it can affect the jet stream, a current of air which normally snakes eastwards around the planet, dividing colder polar air from warmer air to the south.

Where the jet stream crosses the Atlantic it usually points towards the British Isles, but sudden stratospheric warming can lead it to shift towards the equator. As air currents are temporarily rearranged, warmer Atlantic air is replaced by cold air from Siberia or the Arctic, and Europe and Northern Asia may experience unusually cold weather. This is what happened when the infamous “Beast from the East” passed through Europe in 2018, causing huge snowstorms and dozens of deaths.

It can take a number of weeks for the impact of stratospheric warming to reach the surface, or the process may only take a few days. These events are hard to predict in advance. Some can only be predicted a few days ahead while others may be forecast from around two weeks before.

A number of factors including a La Niña event in the tropical Pacific contributed to a strong vortex in early winter 2020/21. Strong vortices are hard to shift, meaning a sudden stratospheric warming event was not looking particularly likely. However, from just before Christmas, weather forecast model predictions began to converge on a likely stratospheric warming event in early January.

From stratosphere to surface

Around two thirds of stratospheric warming events have a detectable surface impact, up to 40 days after the onset of the event. This is usually marked by lower than normal temperatures across Northern Europe and Asia, extending into western Europe, but with warmer temperatures over the eastern Canadian Arctic.

It’s not yet clear why some stratospheric warming events take weeks to impact the surface while others are felt days later, but it may be related to how the polar vortex changes around the onset of a warming event. The vortex can split into two smaller “child vortices”, or it can be displaced from its more usual position centred near the pole, to being over northern Siberia.

Early indications suggested that 2021’s event was more likely to be split, but it subsequently showed more features of a displacement. It is not unusual for the vortex to show such mixed signals.

Colleagues and I recently developed a new method for tracking the impact of a warming event from its onset in the stratosphere to when its effect reaches the surface. We analysed 40 such events from the past 60 years, to try and figure out when we might expect extreme surface weather.

Most importantly, we found that warming events in which the stratospheric polar vortex splits in two generally lead to surface impacts appearing faster and stronger. So although there is an increased chance of snow and extreme cold in mid to late January 2021, other confounding factors may act to reduce this impact.

There are always competing forces at work in the atmosphere. Few people noticed the sudden stratospheric warming of January 2019 for example, which had little impact on the European winter. In that instance, there was a westerly influence on the North Atlantic winds, which originated in the tropics. This may have acted to oppose any stratospheric effect favouring easterly winds. In 2021, the battle is between the stratospheric warming and La Niña.

Sudden stratospheric warming events are a natural atmospheric fluctuation, not caused by climate change. So even with climate change, these events will still occur, which means that we need to be adaptable to an even more extreme range of temperatures.The Conversation

———————————

This blog is written by Cabot Institute member Dr Richard Hall, Research Associate, Climate Dynamics Group, University of BristolThis article is republished from The Conversation under a Creative Commons license. Read the original article.

Dr Richard Hall


Climate-driven extreme weather is threatening old bridges with collapse

The recent collapse of a bridge in Grinton, North Yorkshire, raises lots of questions about how prepared we are for these sorts of risks. The bridge, which was due to be on the route of the cycling world championships in September, collapsed after a month’s worth of rain fell in just four hours, causing flash flooding.

Grinton is the latest in a series of such collapses. In 2015, first Storm Eva and then Storm Frank caused flooding which collapsed the 18th century Tadcaster bridge, also in North Yorkshire, and badly damaged the medieval-era Eamont bridge in nearby Cumbria. Floods in 2009 collapsed or severely damaged 29 bridges in Cumbria alone.

With climate change making this sort of intense rainfall more common in future, people are right to wonder whether we’ll see many more such bridge collapses. And if so – which bridges are most at risk?

In 2014 the Tour de France passed over the now-destroyed bridge near Grinton. Tim Goode/PA

We know that bridges can collapse for various reasons. Some are simply old and already crumbling. Others fall down because of defective materials or environmental processes such as flooding, corrosion or earthquakes. Bridges have even collapsed after ships crash into them.

Europe’s first major roads and bridges were built by the Romans. This infrastructure developed hugely during the industrial revolution, then much of it was rebuilt and transformed after World War II. But since then, various factors have increased the pressure on bridges and other critical structures.
For instance, when many bridges were first built, traffic mostly consisted of pedestrians, animals and carts – an insignificant load for heavy-weight bridges. Yet over the decades private cars and trucks have got bigger, heavier and faster, while the sheer number of vehicles has massively increased.

Different bridges run different risks

Engineers in many countries think that numerous bridges could have reached the end of their expected life spans (between 50-100 years). However, we do not know which bridges are most at risk. This is because there is no national database or method for identifying structures at risk. Since different types of bridges are sensitive to different failure mechanisms, having awareness of the bridge stock is the first step for an effective risk management of the assets.


Newcastle’s various bridges all have different risks. Shaun Dodds / shutterstock

In Newcastle, for example, seven bridges over the river Tyne connect the city to the town of Gateshead. These bridges vary in function (pedestrian, road and railway), material (from steel to concrete) and age (17 to 150 years old). The risk and type of failure for each bridge is therefore very different.

Intense rain will become more common

Flooding is recognised as a major threat in the UK’s National Risk Register of Civil Emergencies. And though the Met Office’s latest set of climate projections shows an increase in average rainfall in winter and a decrease in average rainfall in summer, rainfall is naturally very variable. Flooding is caused by particularly heavy rain so it is important to look at how the extremes are changing, not just the averages.

Warmer air can hold more moisture and so it is likely that we will see increases in heavy rainfall, like the rain that caused the flash floods at Grinton. High resolution climate models and observational studies also show an intensification of extreme rainfall. This all means that bridge collapse from flooding is more likely in the future.

To reduce future disasters, we need an overview of our infrastructure, including assessments of change of use, ageing and climate change. A national bridge database would enable scientists and engineers to identify and compare risks to bridges across the country, on the basis of threats from climate change.


This blog is written by Cabot Institute member Dr Maria Pregnolato, Lecturer in Civil Engineering, University of Bristol and Elizabeth Lewis, Lecturer in Computational Hydrology, Newcastle University.  This article is republished from The Conversation under a Creative Commons license. Read the original article.