Why 40°C is bearable in a desert but lethal in the tropics

Phew: heat plus humidity can make Bangkok an uncomfortable place in a heatwave.
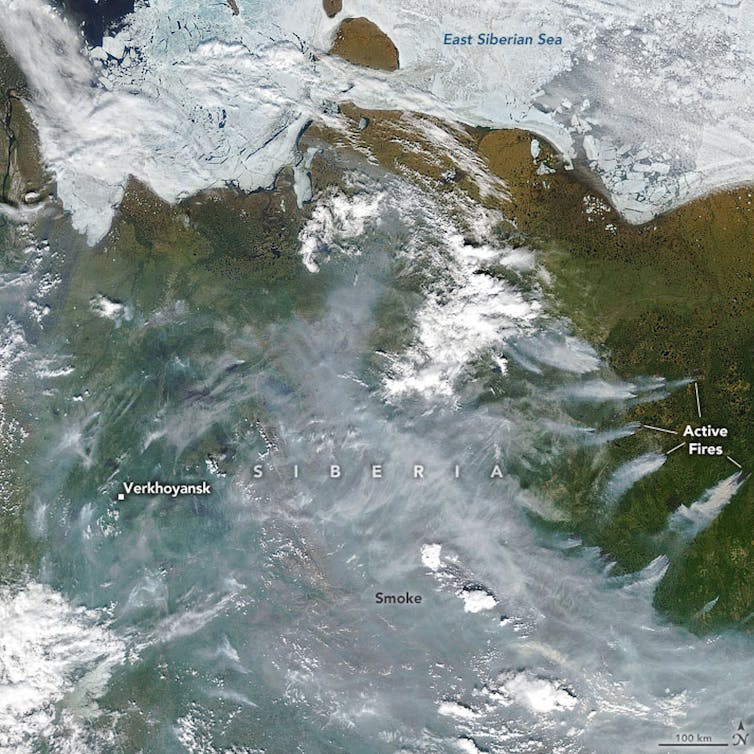
Pavel V.Khon/SHutterstock

This year, even before the northern hemisphere hot season began, temperature records were being shattered. Spain for instance saw temperatures in April (38.8°C) that would be out of the ordinary even at the peak of summer. South and south-east Asia in particular were hammered by a very persistent heatwave, and all-time record temperatures were experienced in countries such as Vietnam and Thailand (44°C and 45°C respectively). In Singapore, the more modest record was also broken, as temperatures hit 37°C. And in China, Shanghai just recorded its highest May temperature for over a century at 36.7°C.

We know that climate change makes these temperatures more likely, but also that heatwaves of similar magnitudes can have very different impacts depending on factors like humidity or how prepared an area is for extreme heat. So, how does a humid country like Vietnam cope with a 44°C heatwave, and how does it compare with dry heat, or a less hot heatwave in even-more-humid Singapore?

Weather and physiology

The recent heatwave in south-east Asia may well be remembered for its level of heat-induced stress on the body. Heat stress is mostly caused by temperature, but other weather-related factors such as humidity, radiation and wind are also important.

Our bodies gain heat from the air around us, from the sun, or from our own internal processes such as digestion and exercise. In response to this, our bodies must lose some heat. Some of this we lose directly to the air around us and some through breathing. But most heat is lost through sweating, as when the sweat on the surface of our skin evaporates it takes in energy from our skin and the air around us in the form of latent heat.

annotated diagram of person
How humans heat up and cool down.
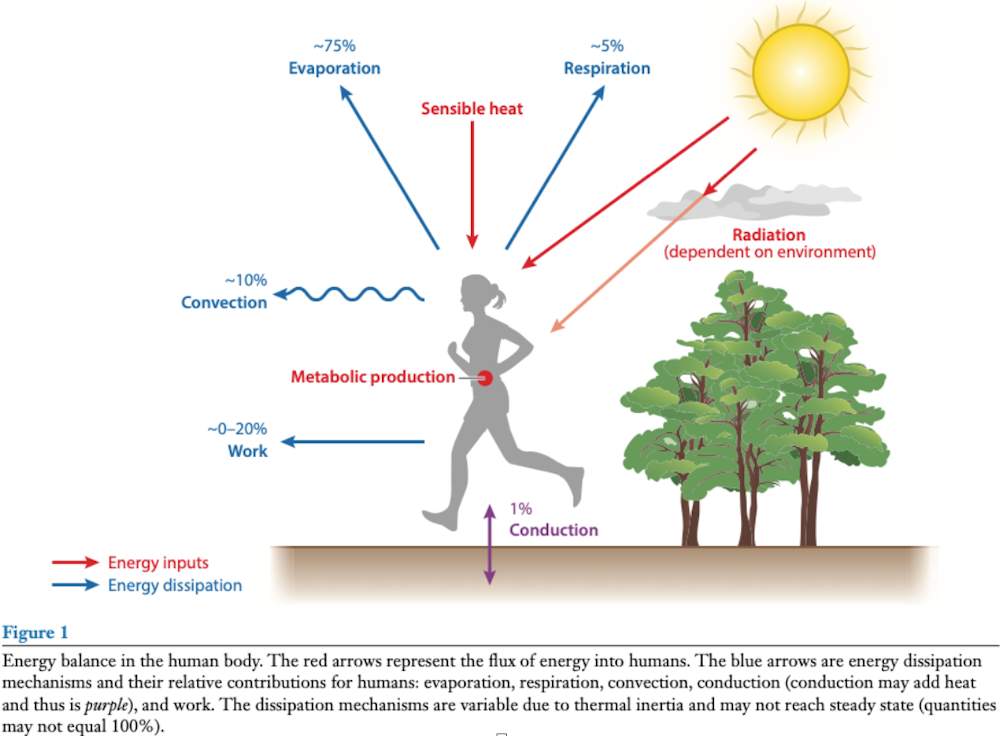
Take from Buzan and Huber (2020) Annual Review of Earth and Planetary Sciences, Author provided

Meteorological factors affect all this. For example, being deprived of shade exposes the body to heat from direct sunlight, while higher humidity means that the rate of evaporation from our skin will decrease.

It’s this humidity that meant the recent heatwave in south-east Asia was so dangerous, as it’s already an extremely humid part of the world.

The limit of heat stress

Underlying health conditions and other personal circumstances can lead to some people being more vulnerable to heat stress. Yet heat stress can reach a limit above which all humans, even those who are not obviously vulnerable to heat risk – that is, people who are fit, healthy and well acclimatised – simply cannot survive even at a moderate level of exertion.

One way to assess heat stress is the so-called Wet Bulb Globe Temperature. In full sun conditions, that is approximately equivalent to 39°C in temperature combined with 50% relative humidity. This limit will likely have been exceeded in some places in the recent heatwave across south-east Asia.

In less humid places far from the tropics, the humidity and thus the wet bulb temperature and danger will be much lower. Spain’s heatwave in April with maximum temperatures of 38.8°C had WBGT values of “only” around 30°C, the 2022 heatwave in the UK, when temperatures exceeded 40°C, had a humidity of less than 20% and WBGT values of around 32°C.

Two of us (Eunice and Dann) were part of a team who recently used climate data to map heat stress around the world. The research highlighted regions most at risk of exceeding these thresholds, with literal hotspots including India and Pakistan, south-east Asia, the Arabian peninsula, equatorial Africa, equatorial South America and Australia. In these regions, heat stress thresholds are exceeded with increased frequency with greater global warming.

In reality, most people are already vulnerable well below the survivability thresholds, which is why we can see large death tolls in significantly cooler heat waves. Furthermore, these global analyses often do not capture some very localised extremes caused by microclimate processes. For example a certain neighbourhood in a city might trap heat more efficiently than its surroundings, or might be ventilated by a cool sea breeze, or be in the “rain shadow” of a local hill, making it less humid.

Variability and acclimatisation

The tropics typically have less variable temperatures. For example, Singapore sits almost on the equator and its daily maximum is about 32°C year round, while a typical maximum in London in mid summer is just 24°C. Yet London has a higher record temperature (40°C vs 37°C in Singapore).

Given that regions such as south-east Asia consistently have high heat stress already, perhaps that suggests that people will be well acclimatised to deal with heat. Initial reporting suggests the intense heat stress of the recent heatwave lead to surprisingly few direct deaths – but accurate reporting of deaths from indirect causes is not yet available.

On the other hand, due to the relative stability in year-round warmth, perhaps there is less preparedness for the large swings in temperature associated with the recent heatwave. Given that it is not unreasonable, even in the absence of climate change, that natural weather variability can produce significant heatwaves that break local records by several degrees Celsius, even nearing a physiological limit might be a very risky line to tread.

—————————–


This blog is written by Cabot Institute for the Environment members: Dr Alan Thomas Kennedy-Asser, Research Associate in Climate Science; Professor Dann Mitchell, Professor of Climate Science, and Dr Eunice Lo, Research Fellow in Climate Change and Health, University of Bristol. This article is republished from The Conversation under a Creative Commons license. Read the original article.

Alan Kennedy-Asser
Alan Kennedy-Asser
Dann Mitchell
Dann Mitchell
Eunice Lo
Eunice Lo

Prehistoric Planet: TV show asked us to explore what weather the dinosaurs lived through

Apple TV+, CC BY-NC-SA

When conjuring up images of when dinosaurs ruled the planet we often think of hot and humid landscapes in a world very different from our own. However, the new TV series Prehistoric Planet, narrated by Sir David Attenborough, shows dinosaurs living and indeed thriving in many types of environments, including colder regions where snowstorms, freezing fog and sea-ice were commonplace.

When the show’s producers first approached us to help understand the kinds of weather and environment that dinosaurs lived in before being wiped out around 66 million years ago, it prompted us to tackle a problem that has existed in palaeoclimate modelling for decades. That was, when scientists like us used computers to simulate, or “model”, the climate of prehistoric Earth, the models tended to make the poles much colder than evidence from fossils and rocks suggested they had actually been.

For the TV series, not only have we improved our models, but we have run the computer programmes for longer than anybody else has ever done to get the models as close to ancient “reality” as possible.

Prehistoric Planet depicts CGI dinosaurs based on the latest research.
AppleTV+, CC BY-NC-SA

The producers, the BBC’s Natural History Unit, needed to know about the weather so they could film “real world” locations similar to those that existed in the past where dinosaurs lived. But most of what we know about the climate that long ago comes from indirect “proxy” evidence, such as leaf fossils and traces of certain chemicals in rocks, which can only reconstruct the average climate over decades or centuries. This is where the narrative of a much hotter and more humid Cretaceous world comes from.

This narrative isn’t exactly wrong, but it doesn’t tell the whole story since weather and climate behave differently. For instance, even in today’s warming world a place like Texas, largely hot and humid, recently experienced widespread snowfall. Geologists a million years from now will spot the sudden global warming – but not the freak snowstorm. Nonetheless, modelling the the prehistoric equivalent of these snowstorms is important since we know warmer worlds will experience greater weather extremes. And these extremes will have largely determined which regions were completely inhospitable to dinosaurs.

Surface wind speed and precipitation through a typical year 69m years ago. An index of 1 means no visibility beyond 10 metres.

How do we know what the weather was like?

Unfortunately, although fossils give us many clues as to past climate, most cannot directly tell us what the weather was on a day to day basis.

So, for a given place on Earth, how do we know what the weather was on, say, May 27 some 66 million years ago? To do this we need to employ a computer simulation of the climate, similar to the ones used to look at future climate change today. These models are based on fundamental physical and biological processes which remain constant with time. It is therefore possible to adjust them for ancient worlds, even if we don’t know precise details like where or how high the mountains were, or exactly how much carbon dioxide was in the atmosphere.

We can then check these models using some of the ancient climate proxies, such as fossilised leaves, coral or rocks which contain traces of what conditions were like at the time. If our model matches up with the proxies – and it did – then we can be confident it is simulating typical weather at the time.

So what did we learn from modelling the climate of 66m years ago?

Our model found there would have been intense blizzards in Antarctica, for instance, “category six” hurricanes (something we are likely to see in our lifetimes) buffeting the mid and low latitudes and extensive, ever present, fog banks creating murky winters under polar cloud caps.

In a warmer world the water cycle is intensified over the poles. This meant more water in the air, and large parts of the planet would have been very foggy almost all the time (Source: modelling work by the authors)

This doesn’t immediately sound like a dinosaur-friendly environment. However, the old misconception that dinosaurs were cold blooded, thus requiring a warm climate for survival has for the most part already been dismissed. The new paradigm is that dinosaurs were warm blooded, and could to some extent regulate their internal temperature, like mammals do today.

This would be essential to survive large swings in temperature, driven by varied weather patterns, particularly in the polar regions. Our modelling therefore backs up recent fossil discoveries which show that some dinosaur species were cold-adapted, could see in low light conditions (useful in those huge fog banks), and thrived year-round near the poles.

Dinosaur in snow
Pachyrhinosaurus surviving and thriving.
AppleTV+, CC BY-NC-SA

The Prehistoric Planet scenes with the chilly Pachyrhinosaurus were set in Alaska, and demonstrate why the show wanted check its accuracy with climate models. We have an idea what the conditions would have been like there 66m years ago thanks to detailed fossils of plants, dinosaurs and other animals, yet the old models would have predicted intensely-cold and lifeless tundra.

Our model instead matches up with the fossil evidence, and predicts forests right up to the margins of the Arctic Ocean at 82°N – much further north than any trees today. In the summer, dinosaur food would have been abundant, but in the long dark winters it would have been more difficult to find, particularly as both fossils and modelling suggests it was so foggy.

Dinosaurs survived for a remarkable 165 million years. Tyrannosaurus Rex lived much closer to present day humans than it did to Stegosauruses, for instance. They managed to survive so long because they were resilient and adaptable to changeable environmental conditions, much like mammals are today. Our work for Prehistoric Planet shows that they were able to survive through greater extremes in temperature, stormier weather, and more extreme droughts than humans have experienced – so far.The Conversation

————————–

This blog is written by Cabot Institute for the Environment members Dr Alex Farnsworth, Senior Research Associate in Meteorology, and Paul Valdes, Professor of Physical Geography, University of Bristol; and Robert Spicer, Emeritus Professor of Earth Sciences, The Open University

This article is republished from The Conversation under a Creative Commons license. Read the original article.

Climate change isn’t just making cyclones worse, it’s making the floods they cause worse too – new research

People take refuge on a sports ground following flooding caused by Cyclone Idai in Mozambique.
DFID/Flickr, CC BY-SA

Laurence Hawker, University of Bristol; Dann Mitchell, University of Bristol, and Natalie Lord, University of Bristol

Super cyclones, known as hurricanes or typhoons in different parts of the world, are among the most destructive weather events on our planet.

Although wind speeds within these storms can reach 270 km/h, the largest loss of life comes from the flooding they cause – known as a “storm surge” – when sea water is pushed onto the coast. Climate change is predicted to worsen these floods, swelling cyclone clouds with more water and driving rising sea levels that allow storm surges to be blown further inland.

In May 2020, Super Cyclone Amphan hit the India-Bangladesh border, bringing heavy rainfall and strong winds and affecting more than 13 million citizens. The cyclone also caused storm surges of 2-4 metres, flooding coastal regions in the Bay of Bengal.

While over the ocean, this category five storm – that’s a storm’s highest possible rating – became the strongest cyclone to have formed in the Bay of Bengal since 1999, reaching wind speeds of up to 260 km/h. Although it weakened to a category two storm following landfall, it remained the strongest cyclone to hit the Ganges Delta since 2007.

Amphan had severe consequences for people, agriculture, the local economy and the environment. It tragically resulted in more than 120 deaths, as well as damaging or destroying homes and power grids: leaving millions without electricity or communication in the midst of an ongoing pandemic.

Relief and aid efforts were hampered by flood damage to roads and bridges, as well as by coronavirus restrictions. Large areas of crops including rice, sesame and mangos were damaged, and fertile soils were either washed away or contaminated by saline sea water. Overall, Super Cyclone Amphan was the costliest event ever recorded in the North Indian Ocean, resulting in over $13 billion (£10 billion) of damage.

Two people assess a tree that has fallen across a road
In Kolkata, India, Super Cyclone Amphan caused widespread damage.
Indrajit Das/Wikimedia

In a recent study led by the University of Bristol and drawing on research from Bangladesh and France, we’ve investigated how the effects of storm surges like that caused by Amphan on the populations of India and Bangladesh might change under different future climate and population scenarios.

Amphan: Mark II

Rising sea levels – thanks largely to melting glaciers and ice sheets – appear to be behind the greatest uptick in future risk from cyclone flooding, since they allow storm surges to reach further inland. It’s therefore key to understand and predict how higher sea levels might exacerbate storm-driven flooding, in order to minimise loss and damage in coastal regions.

Our research used climate models from CMIP6, the latest in a series of projects aiming to improve our understanding of climate by comparing simulations produced by different modelling groups around the world. First we modelled future sea-level rise according to different future emissions scenarios, then we added that data to storm surge estimates taken from a model of Super Cyclone Amphan.

We ran three scenarios: a low emission scenario, a business-as-usual scenario and a high emission scenario. And in addition to modelling sea-level rise, we also estimated future populations across India and Bangladesh to assess how many more people storm surges could affect. In most cases, we found that populations are likely to rise: especially in urban areas.

Our findings were clear: exposure to flooding from cyclone storm surges is extremely likely to increase. In India, exposure increase ranged from 50-90% for the lowest emission scenario, to a 250% increase for the highest emission scenario. In Bangladesh, we found a 0-20% exposure increase for the lowest emission scenario and a 60-70% increase for the highest emission scenario. The difference in exposure between the two countries is mostly due to declining coastal populations as a result of urban migration inland.

Imagine we’re now in 2100. Even in a scenario where we’ve managed to keep global emissions relatively low, the local population exposed to storm surge flooding from an event like Amphan will have jumped by ~350,000. Compare this to a high emission scenario, where an extra 1.35 million people will now be exposed to flooding. And for flood depths of over one metre – a depth that poses immediate danger to life – almost half a million more people will be exposed to storm surge flooding in a high emission scenario, compared to a low emission scenario.

A composite satellite image of a large white cyclone
A satellite image shows Amphan approaching the coasts of India and Bangladesh.
Pierre Markuse/Wikimedia

This research provides yet more support for rapidly and permanently reducing our greenhouse gas emissions to keep global warming at 1.5°C above pre-industrial levels.

Although we’ve focused on storm surge flooding, other cyclone-related hazards are also projected to worsen, including deadly heatwaves following cyclones hitting land. And in the case of Amphan, interplay between climate change and coronavirus likely made the situation for people on the ground far worse. As the world warms, we mustn’t avoid the reality that pandemics and other climate-related crises are only forecast to increase.

Urgent action on emissions is vital to protect highly climate-vulnerable countries from the fatal effects of extreme weather. Amphan Mark II need not be as destructive as we’ve projected if the world’s governments act now to meet Paris agreement climate goals.The Conversation

—————————–

This blog is written by Cabot Institute for the Environment members Dr Laurence Hawker, Senior Research Associate in Geography, University of Bristol; Professor Dann Mitchell, Professor of Climate Science, University of Bristol, and Dr Natalie Lord, Honorary Research Associate in Climate Science, University of Bristol

This article is republished from The Conversation under a Creative Commons license. Read the original article.

Dune: we simulated the desert planet of Arrakis to see if humans could survive there

Dune, the epic series of sci-fi books by Frank Herbert, now turned into a movie of the same name, is set in the far future on the desert planet of Arrakis. Herbert outlined a richly-detailed world that, at first glance, seems so real we could imagine ourselves within it.

However, if such a world did exist, what would it actually be like?

We are scientists with specific expertise in climate modelling, so we simulated the climate of Arrakis to find out. We wanted to know if the physics and environment of such a world would stack up against a real climate model.

Here’s a visualisation of our climate model of Arrakis:

You can zoom in on particular features and highlight things like temperature or wind speed at our website Climate Archive.

When we were done, we were very pleased to discover that Herbert had envisioned an environment that for the most part meets expectations. We might need to occasionally suspend disbelief, but much of Arrakis itself would indeed be habitable, albeit inhospitable.

How do you build a fantasy world like Arrakis?

We started with a climate model commonly used to predict weather and climate here on Earth. To use these sorts of models you have to decide on the physical laws (well-known in the case of planet Earth) and then input data on everything from the shape of mountains to the strength of the sun or the makeup of the atmosphere. The model can then simulate the climate and tell you roughly what the weather might be like.

We decided to keep the same fundamental physical laws that govern weather and climate here on Earth. If our model presented something completely strange and exotic, this could suggest those laws were different on Arrakis, or Frank Herbert’s fantastical vision of Arrakis was just that, fantasy.

Height map (in metres) of Arrakis.
Farnsworth et al, Author provided

We then needed to tell the climate model certain things about Arrakis, based on the detailed information found in the main novels and the accompanying Dune Encyclopedia. These included the planet’s topography and its orbit, which was was essentially circular, akin to the Earth today. The shape of an orbit can really impact the climate: see the long and irregular winters in Game of Thrones.

Finally, we told the model what the atmosphere was made of. For the most part it is quite similar to that of the Earth today, although with less carbon dioxide (350 parts per million as opposed to our 417 ppm). The biggest difference is the ozone concentration. On Earth, there is very little ozone in the lower atmosphere, only around 0.000001%. On Arrakis it is 0.5%. Ozone is important as it is around 65 times more effective at warming the atmosphere than CO₂ over a 20-year period.

Having fed in all the necessary data, we then sat back and waited. Complex models like this take time to run, in this case more than three weeks. We needed a huge supercomputer to be able to crunch the hundreds of thousands of calculations required to simulate Arrakis. However, what we found was worth the wait.

Arrakis’s climate is basically plausible

The books and film describe a planet with unforgiving sun and desolate wastelands of sand and rock. However, as you move closer to the polar regions towards the cities of Arrakeen and Carthag, the climate in the book begins to change into something that might be inferred as more hospitable.

Yet our model tells a different story. In our model of Arrakis, the warmest months in the tropics hit around 45°C, whereas in the coldest months they do not drop below 15°C. Similar to that of Earth. The most extreme temperatures would actually occur in the mid-latitudes and polar regions. Here summer can be as hot as 70°C on the sand (also suggested in the book). Winters are just as extreme, as low as -40°C in the mid-latitudes and down to -75°C in the poles.

This is counter intuitive as the equatorial region receives more energy from the sun. However, in the model the polar regions of Arrakis have significantly more atmospheric moisture and high cloud cover which acts to warm the climate since water vapour is a greenhouse gas.

gif of temperatures
Monthly temperatures on Arrakis, according to the model. Both poles have very cold winters and very hot summers.
Author provided

The book says that there is no rain on Arrakis. However, our model does suggest that very small amounts of rainfall would occur, confined to just the higher latitudes in the summer and autumn, and only on mountains and plateaus. There would be some clouds in the tropics as well as polar latitudes, varying from season to season.

The book also mentions that polar ice caps exist, at least in the northern hemisphere, and have for a long time. But this is where the books perhaps differ the most from our model, which suggests summer temperatures would melt any polar ice, and there would be no snowfall to replenish the ice caps in winter.

Hot but habitable

Could humans survive on such a desert planet? First, we must make an assumption that the human-like people in the book and film share similar thermal tolerances to humans today. If that’s the case then, contrary to the book and film, it seems the tropics would be the most habitable area. As there is so little humidity there, survivable wet-bulb temperatures – a measure of “habitability” that combines temperature and humidity – are never exceeded.

The mid-latitudes, where most people on Arrakis live, are actually the most dangerous in terms of heat. In the lowlands, monthly average temperatures are often above 50-60°C, with maximum daily temperatures even higher. Such temperatures are deadly for humans.

Four people in black rubbery suits in desert
Stillsuit models, autumn 10191 collection.
Chiabella James / Warner Bros

We do know that all humanoid life on Arrakis outside of habitable places must wear “stillsuits”, designed to keep the wearer cool and reclaim body moisture from sweating, urination and breathing to provide drinkable water. This is important as stated in the book that there is no rainfall on Arrakis, no standing bodies of open water and little atmospheric moisture that can be reclaimed.

The planet also gets very cold outside of the tropics, with winter temperatures that would also be uninhabitable without technology. Cities like Arrakeen and Carthag would suffer from both heat and cold stress, like a more extreme version of parts of Siberia on Earth which can have both uncomfortably hot summers and brutally cold winters.

It’s important to remember that Herbert wrote the first Dune novel way back in 1965. This was two years before recent Nobel-winner Syukuro Manabe published his seminal first climate model, and Herbert did not have the advantage of modern supercomputers, or indeed any computer. Given that, the world he created looks remarkably consistent six decades on.


The authors modified a well-used climate model for exoplanet research and applied it to the planet in Dune. The work was carried out in their spare time and is intended as an appropriate outreach piece to demonstrate how climate scientists use mathematical models to better understand our world and exoplanets. It will feed into future academic outputs on desert worlds and exoplanets.The Conversation

This blog is written by Cabot Institute for the Environment members, Dr Alex Farnsworth, Senior Research Associate in Meteorology and Dr Sebastian Steinig, Research Associate in Paleoclimate Modelling, University of Bristol; and Michael Farnsworth, Research Lead Future Electrical Machines Manufacturing Hub, University of Sheffield.

This article is republished from The Conversation under a Creative Commons license. Read the original article.

Are you a journalist looking for climate experts? We’ve got you covered

We’ve got lots of media trained climate change experts. If you need an expert for an interview, here is a list of Caboteers you can approach. All media enquiries should be made via Victoria Tagg, our dedicated Media and PR Manager at the University of Bristol. Email victoria.tagg@bristol.ac.uk or call +44 (0)117 428 2489.

Climate change / climate emergency / climate science / climate-induced disasters

Dr Eunice Lo – expert in changes in extreme weather events such as heatwaves and cold spells, and how these changes translate to negative health outcomes including illnesses and deaths. Follow on Twitter @EuniceLoClimate.

Professor Daniela Schmidt – expert in the causes and effects of climate change on marine systems. Dani is also a Lead Author on the IPCC reports. Dani will be at COP26.

Dr Katerina Michalides – expert in drylands, drought and desertification and helping East African rural communities to adapt to droughts and future climate change. Follow on Twitter @_kmichaelides.

Professor Dann Mitchell – expert in how climate change alters the atmospheric circulation, extreme events, and impacts on human health. Dann is also a Met Office Chair. Dann will be at COP26. Follow on Twitter @ClimateDann.

Professor Dan Lunt – expert on past climate change, with a focus on understanding how and why climate has changed in the past and what we can learn about the future from the past. Dan is also a Lead Author on IPCC AR6. Dan will be at COP26. Follow on Twitter @ClimateSamwell.

Professor Jonathan Bamber – expert on the impact of melting land ice on sea level rise (SLR) and the response of the ocean to changes in freshwater forcing. Jonathan will be at COP26. Follow on Twitter @jlbamber

Professor Paul Bates CBE – expert in the science of flooding, risk and reducing threats to life and economic losses worldwide. Follow on Twitter @paul_d_bates

Professor Tony Payne – expert in the effects of climate change on earth systems and glaciers.

Dr Matt Palmer – expert in sea level and ocean heat content research at the Met Office Hadley Centre and University of Bristol. Follow on Twitter @mpclimate.

Net Zero / Energy / Renewables

Professor Valeska Ting – Engineer and expert in net zero, low carbon technologies, low carbon energy and flying. Also an accomplished STEM communicator, is an BAME Expert Voice for the BBC Academy. Follow on Twitter @ProfValeskaTing.

Professor Philip Taylor – Expert in net zero, energy systems, energy storage, utilities, electric power distribution. Also Pro-Vice Chancellor at the University of Bristol. Philip will be at COP26. Follow on Twitter @rolyatlihp.

Dr Colin Nolden – expert in sustainable energy policy, regulation and business models and interactions with secondary markets such as carbon markets and other sectors such as mobility. Colin will be at COP26.

Climate finance

Dr Rachel James – Expert in climate finance, damage, loss and decision making. Also has expertise in African climate systems and contemporary and future climate change. Follow on Twitter @_RachelJames

Climate justice

Dr Alix Dietzel – climate justice and climate policy expert. Focusing on the global and local scale and interested in how just the response to climate change is and how we can ensure a just transition. Alix will be at COP26. Follow on Twitter @alixdietzel

Dr Ed Atkins – expert on environmental and energy policy, politics and governance and how they must be equitable and inclusive. Also interested in local politics of climate change policies and energy generation and consumption. Follow on Twitter @edatkins_.

Climate activism / Extinction Rebellion

Dr Oscar Berglund – expert on climate change activism and particularly Extinction Rebellion (XR) and the use of civil disobedience. Follow on Twitter @berglund_oscar.

Air pollution / Greenhouse gases

Dr Aoife Grant – expert in greenhouse gases and methane. Has set up a monitoring station at Glasgow for COP26 to record emissions.

Professor Matt Rigby – expert on sources and sinks of greenhouse gases and ozone depleting substances. Follow on Twitter @TheOtherMRigby.

Land, nature and food

Dr Jo House – expert on land and climate interactions, including emissions of carbon dioxide from land use change (e.g. deforestation), climate mitigation potential from the land (e.g. afforestation, bioenergy), and implications of science for policy. Previously Government Office for Science’s Head of Climate Advice. Follow on Twitter @Drjohouse.
Dr Taro Takahashi – expert on farming, livestock production systems as well as progamme evaluation and general equilibrium modelling of pasture and livestock-based economies.

Climate change and infrastructure

Dr Maria Pregnolato – expert on effects of climate change and flooding on infrastructure. Follow on Twitter @MariaPregnolat1.

Plastic and the environment

Dr Charlotte Lloyd – expert on the fate of chemicals in the terrestrial environment, including plastics, bioplastics and agricultural wastes. Follow on Twitter @DrCharlLloyd.

What else the Cabot Institute for the Environment is up to for COP26

Find out what we’re doing for COP26 on our website at bristol.ac.uk/cabot/cop26.
Watch our Cabot Conversations – 10 conversations between 2 experts on a climate change issue, all whilst an artist listens in the background and interprets the conversation into a beautiful piece of art in real time. Find out more at bristol.ac.uk/cabot/conversations.
——————————
This blog was written by Amanda Woodman-Hardy, Communications and Engagement Officer at the Cabot Institute for the Environment. Follow on Twitter @Enviro_Mand and @cabotinstitute.
 

University of Bristol welcomes five Met Office Research Scientists as part of the new Met Office Academic Partnership


Image Credit: Federico Respini on Unsplash

In spring of 2020 the University of Bristol joined a prestigious alliance of the Met Office and six University Research Institutes that brings together expertise in weather and climate science.  The exciting, new Bristol Met Office Academic Partnership (MOAP) is focussed on the theme of “weather and climate hazards for decision making.” The aim is to align research interests through combining the Met Office world-leading ability in weather forecasting and the hazard and impact modelling expertise we have at Bristol.

A core part of the MOAP is to embed Met Office expertise within the University and to develop cross-disciplinary research in our key theme areas. We are, therefore, delighted to announce five new part-time Joint Bristol – Met Office Faculty members of staff who began working with us at the beginning of April.

Our Joint MOAP Chair based at the Met Office, Professor Chris Hewitt commented:

“We were delighted to welcome the University of Bristol to the Met Office Academic Partnership last year, and are excited that there will be five new joint faculty positions for Met Office scientists to cement the collaboration with the University’s experts working on research topics of mutual interest.”

The collaborative research will come under four interchangeable, themes:

  • Weather, climate and environmental hazards (e.g. volcanic hazards, heat waves, storms).
  • Impact and risk-based predictions.
  • Resilience to hazards and weather.
  • Climate services for making decisions.

The theme areas are co-led by eight University of Bristol researchers from Earth Sciences, Geographical Sciences and Civil Engineering and eight Met Office scientists. The new positions will work closely with the theme co-leads and have been strategically placed across the University Faculties to enhance collaboration and develop new research opportunities, particularly in the lead up to COP26.

University of Bristol-based MOAP Joint Chair, Dr Dann Mitchell says:

“We are really excited with the new joint faculty positions starting at Bristol. They represent the full spectrum of our partnership with the Met Office, from fundamental science for weather and climate hazards, to end user engagement. They will sit across three of our faculties and help solidify cross-disciplinary links between weather and climate, and the impacts on society, such as through health and hydrological modelling.”

The Faculty of Science welcomes three of the appointments: Dr Lizzie Kendon, a Science Manager and Met Office Fellow looking at high impact weather events using very high-resolution climate models, Dr Matt Palmer who leads the team at the Met Office who research sea level and ocean heat content and Dr Joseph Daron a Science Manager for International Climate Services at the Met Office.

The Faculty of Engineering welcomes our fourth appointment Dr Fai Fung who is the UK Climate Projections Climate Services Manager.. Our fifth appointment, Dr Dan Bernie, is the Science Manager for the UK Climate Resilience Team at the Met Office and is welcomed by the Faculty of Health Sciences. With regular MOAP meetings underway and events such as the CMIP6 Data Hackathon now open for applications we are excited to begin working with our new colleagues to develop a strong, collaborative relationship between Bristol and the Met Office.

The new appointments will work closely with The Cabot Institute for the Environment, Jean Golding Institute and Elizabeth Blackwell Institute to deliver cutting-edge research in weather and climate science

For further enquiries about the MOAP we can be contacted at bris-moap-coordinator@bristol.ac.uk.

———————————

This blog is written by Dr Emma Stone (Bristol MOAP Project Manager).

Emma’s role as MOAP project Manager, previously with a background in climate science, is to assist with and coordinate MOAP-related activities working alongside the MOAP Joint Chairs, Research Advisory Panel and theme co-leads to identify potential research opportunities between the University and the Met Office and see these through to development. Emma is a key point of contact for internal and external researchers, collaborators, funders and support staff.

Dr Emma Stone


Image at start of article credit: Federico Respini on Unsplash

Beast from the East 2? What ‘sudden stratospheric warming’ involves and why it can cause freezing surface weather


Darryl Fonseka / shutterstock

A “sudden stratospheric warming” event took place in early January 2021, according to the Met Office, the UK’s national weather service. These events are some of the most extreme of atmospheric phenomena, and I study them as part of my academic research. The stratosphere is the layer of the atmosphere from around 10km to 50km above the Earth’s surface, and sudden warming up there can lead to very cold weather over Europe and Siberia, with an increased possibility of snow storms.


In winter the polar regions are in darkness 24 hours a day, and so the stratosphere over the north pole drops to -60℃ or even lower. The pole is surrounded by strong westerly winds, forming what is known as the polar vortex, a normal occurrence which develops every winter. However, about six times a decade, this vortex can break down in dramatic fashion. This can lead to temperatures over the pole increasing by up to 50°C over a few days, although temperatures are so low that they still remain below freezing. The average wind direction around the pole may also reverse, in which case a “sudden stratospheric warming” event has occurred.

The disturbance in the stratosphere can then be transmitted downward through the atmosphere. If this disturbance reaches the lower levels of the atmosphere it can affect the jet stream, a current of air which normally snakes eastwards around the planet, dividing colder polar air from warmer air to the south.

Where the jet stream crosses the Atlantic it usually points towards the British Isles, but sudden stratospheric warming can lead it to shift towards the equator. As air currents are temporarily rearranged, warmer Atlantic air is replaced by cold air from Siberia or the Arctic, and Europe and Northern Asia may experience unusually cold weather. This is what happened when the infamous “Beast from the East” passed through Europe in 2018, causing huge snowstorms and dozens of deaths.

It can take a number of weeks for the impact of stratospheric warming to reach the surface, or the process may only take a few days. These events are hard to predict in advance. Some can only be predicted a few days ahead while others may be forecast from around two weeks before.

A number of factors including a La Niña event in the tropical Pacific contributed to a strong vortex in early winter 2020/21. Strong vortices are hard to shift, meaning a sudden stratospheric warming event was not looking particularly likely. However, from just before Christmas, weather forecast model predictions began to converge on a likely stratospheric warming event in early January.

From stratosphere to surface

Around two thirds of stratospheric warming events have a detectable surface impact, up to 40 days after the onset of the event. This is usually marked by lower than normal temperatures across Northern Europe and Asia, extending into western Europe, but with warmer temperatures over the eastern Canadian Arctic.

It’s not yet clear why some stratospheric warming events take weeks to impact the surface while others are felt days later, but it may be related to how the polar vortex changes around the onset of a warming event. The vortex can split into two smaller “child vortices”, or it can be displaced from its more usual position centred near the pole, to being over northern Siberia.

Early indications suggested that 2021’s event was more likely to be split, but it subsequently showed more features of a displacement. It is not unusual for the vortex to show such mixed signals.

Colleagues and I recently developed a new method for tracking the impact of a warming event from its onset in the stratosphere to when its effect reaches the surface. We analysed 40 such events from the past 60 years, to try and figure out when we might expect extreme surface weather.

Most importantly, we found that warming events in which the stratospheric polar vortex splits in two generally lead to surface impacts appearing faster and stronger. So although there is an increased chance of snow and extreme cold in mid to late January 2021, other confounding factors may act to reduce this impact.

There are always competing forces at work in the atmosphere. Few people noticed the sudden stratospheric warming of January 2019 for example, which had little impact on the European winter. In that instance, there was a westerly influence on the North Atlantic winds, which originated in the tropics. This may have acted to oppose any stratospheric effect favouring easterly winds. In 2021, the battle is between the stratospheric warming and La Niña.

Sudden stratospheric warming events are a natural atmospheric fluctuation, not caused by climate change. So even with climate change, these events will still occur, which means that we need to be adaptable to an even more extreme range of temperatures.The Conversation

———————————

This blog is written by Cabot Institute member Dr Richard Hall, Research Associate, Climate Dynamics Group, University of BristolThis article is republished from The Conversation under a Creative Commons license. Read the original article.

Dr Richard Hall


Is Europe heading for a more drought prone future?

Parched landscape of Europe during the 2018 drought. Image credit: NASA, CC0

In 2018, Europe was hit with one of the worst droughts so far in the 21st century in terms of its extent, severity and duration. This had large-scale effects on the vegetation, both agricultural and natural. Harvest yields were substantially reduced, by up to 40% in some regions, and widescale browning of vegetation occurred.

A consortium of international researchers, including members of the Atmospheric Chemistry Research Group (ACRG) at the University of Bristol, asked the question: given the major impacts on vegetation, which plays an essential role in removing carbon dioxide (CO2) from the air, was there an observable change in the amount of carbon uptake across Europe during this event?

There are at least two ways to quantify the impact that the drought had on the terrestrial carbon sink: a bottom-up or top-down approach. Our plans and timelines to mitigate climate change rely on using these methods to predict how much of anthropogenic greenhouse gas emissions can be taken up by the natural biosphere. Currently, the terrestrial carbon sink (i.e. vegetation and soils) takes up approximately a third of manmade emissions. The oceans take up about a similar amount. But this important carbon sink is subject to variation brought about by naturally occurring variation in the climate and manmade climate change.

To investigate the impact of the drought on the European terrestrial carbon sink, modellers can predict how individual processes that contribute to the terrestrial sink would respond to the climate during that period – a bottom-up approach. For example, a study by Bastos et al. (2019) compared the estimates of net ecosystem exchange during the drought period from 11 vegetation models. Net ecosystem exchange quantifies the amount of CO2 that is either taken up or released from the ecosystem and is usually quantified as a flux of CO2 to the atmosphere. This value is negative if the ecosystem is a sink and positive if it is a source of CO2 to the atmosphere. The consensus from previous studies was that an unusually sunny spring led to early vegetation growth, which depleted soil moisture, which intensified the drought during the summer period. Although more CO2 was taken up by the biosphere in spring, in some European regions, like Central Europe, the lack of rain during the summer months meant that the soils, already depleted in water, could not maintain the vegetation, and this led to CO2 losses from the ecosystem.

At the ACRG we use measurements of gases in the atmosphere, like CO2, to improve estimates of emissions and uptake of these gases using a top-down approach called inverse modelling. Measurements are obtained from carefully calibrated instruments that are part of global networks of measurement sites like AGAGE (Advanced Global Atmospheric Gases Experiment) and ICOS (Integrated Carbon Observation System). We also require initial estimates of the fluxes, which we obtain from several sources, including vegetation models and bottom-up inventories, and a model that describes atmospheric transport of the gas (a model that describes how a pocket of air will travel in the atmosphere). Using a statistical approach, we can then improve on those initial estimates to get better agreement between the modelled and observed concentrations at the measurement sites. With this method, we have to account for all sources of a gas, both anthropogenic and natural, as the concentration that is recorded at a measurement site is the sum of all contributions from all sources.

In a recent publication by Thompson et al. (2020), we compared the CO2 flux estimates for regions in Europe over the last ten years using the ACRG modelling method, along with four other approaches. The combined estimate from these five modelling systems indicated that the temperate region of Europe (i.e. Central Europe) was a small source of CO2 during 2018. This means that when carbon losses due to plant and soil respiration are compared with the carbon uptake by photosynthesis, then a small positive amount was emitted to the atmosphere on balance. This is described by a positive net flux of 0.09 ± 0.06 PgC y-1 (mean ± SD) to the atmosphere, compared with the mean of the last 10 years of -0.08 ± 0.17 PgC y-1, which is a net sink of carbon, meaning that over the last 10 years more carbon was taken up by photosynthesis than emitted through ecosystem respiration. Northern Europe was also found to be a small source in 2018. This publication was part of a special issue on the impacts of the 2018 drought on Europe.

So what does this tell us about how carbon uptake might change in the future? A 2018 study by Samaniego et al. considered future projections from climate models under different scenarios ranging from 1°C to 3°C global temperature rise. They concluded that soil moisture droughts were set to become 40% more likely by the end of the 21st century under the current 3°C future compared with 1.5°C set out in the Paris Climate Agreement. Droughts like the previous “Lucifer” event in 2003, where as many as 35,000 people lost their lives due to the effects of the drought, are expected to become twice as likely. Failing to reduce greenhouse gas emissions so that we mitigate the global temperature rise will impact on our ability to grow food and make killer drought events more likely. Our study shows that more frequent droughts will reduce the biosphere’s ability to take up our CO2 emissions due to the impact of a warmer climate on the soil and vegetation of key natural sinks, and lead to fundamental changes in the structure and species composition of these systems into the future. Unfortunately, this will further exacerbate the effects of climate change.

Bibliography

A. Bastos, P. Ciais, P. Friedlingstein, S. Sitch, J. Pongratz, L. Fan, J. P. Wigneron, U. Weber, M. Reichstein, Z. Fu, P. Anthoni, A. Arneth, V. Haverd, A. K. Jain, E. Joetzjer, J. Knauer, S. Lienert, T. Loughran, P. C. McGuire, H. Tian, N. Viovy, S. Zaehle. Direct and seasonal legacy effects of the 2018 heat wave and drought on European ecosystem productivity. Science Advances, 2020; 6 (24): eaba2724 DOI: 10.1126/sciadv.aba2724

M. Reuter, M. Buchwitz, M. Hilker, J. Heymann, H. Bovensmann, J.P. Burrows, S. Houweling, Y.Y. Liu, R. Nassar, F. Chevallier, P. Ciais, J. Marshall, M. Reichstein. How much CO2 is taken up by the European Terrestrial Biosphere? Bulletin of the American Meteorological Society, 2017; 98 (4): 665-671 DOI: 10.1175/BAMS-D-15-00310.1

L. Samaniego, S. Thober, R. Kumar, N. Wanders, O. Rakovec, M. Pan, M. Zink, J. Sheffield, E.F. Wood, A. Marx. Anthropogenic warming exacerbates European soil moisture droughts. Nature Climate Change, 2018; 8, 421-426 DOI: 10.1038/s41558-018-0138-5

R.L. Thompson, G. Broquet, C. Gerbig, T. Kock, M. Lang, G. Monteil, S. Munassar, A. Nickless, M. Scholze, M. Ramonet, U. Karstens, E. van Schaik, Z. Wu, C. Rödenbeck. Changes in net ecosystem exchange over Europe during the 2018 drought based on atmospheric observations. Philosophical Transactions of the Royal Society B, 2020; 375 (1810): 20190512 DOI: 10.1098/rstb.2019.0512

————————————-

This blog is written by Cabot Institute member Dr Alecia Nickless, a research associate in the School of Chemistry at the University of Bristol.

Siberia heatwave: why the Arctic is warming so much faster than the rest of the world

Smoke from wildfires cloaks the skies over Siberia, June 23 2020.
EPA-EFE/NASA

On the eve of the summer solstice, something very worrying happened in the Arctic Circle. For the first time in recorded history, temperatures reached 38°C (101°F) in a remote Siberian town – 18°C warmer than the maximum daily average for June in this part of the world, and the all-time temperature record for the region.

New records are being set every year, and not just for maximum temperatures, but for melting ice and wildfires too. That’s because air temperatures across the Arctic have been increasing at a rate that is about twice the global average.

All that heat has consequences. Siberia’s recent heatwave, and high summer temperatures in previous years, have been accelerating the melting of Arctic permafrost. This is the permanently frozen ground which has a thin surface layer that melts and refreezes each year. As temperatures rise, the surface layer gets deeper and structures embedded in it start to fail as the ground beneath them expands and contracts. This is what is partly to blame for the catastrophic oil spill that occurred in Siberia in June 2020, when a fuel reservoir collapsed and released more than 21,000 tonnes of fuel – the largest ever spill in the Arctic.

So what is wrong with the Arctic, and why does climate change here seem so much more severe compared to the rest of the world?

The warming models predicted

Scientists have developed models of the global climate system, called general circulation models, or GCMs for short, that reproduce the major patterns seen in weather observations. This helps us track and predict the behaviour of climate phenomena such as the Indian monsoon, El Niño, Southern Oscillations and ocean circulation such as the gulf stream.

GCMs have been used to project changes to the climate in a world with more atmospheric CO₂ since the 1990s. A common feature of these models is an effect called polar amplification. This is where warming is intensified in the polar regions and especially in the Arctic. The amplification can be between two and two and a half, meaning that for every degree of global warming, the Arctic will see double or more. This is a robust feature of our climate models, but why does it happen?

Fresh snow is the brightest natural surface on the planet. It has an albedo of about 0.85, which means that 85% of solar radiation falling on it is reflected back out to space. The ocean is the opposite – it’s the darkest natural surface on the planet and reflects just 10% of radiation (it has an albedo of 0.1). In winter, the Arctic Ocean, which covers the North Pole, is covered in sea ice and that sea ice has an insulating layer of snow on it. It’s like a huge, bright thermal blanket protecting the dark ocean underneath. As temperatures rise in spring, sea ice melts, exposing the dark ocean underneath, which absorbs even more solar radiation, increasing warming of the region, which melts even more ice. This is a positive feedback loop which is often referred to as the ice-albedo feedback mechanism.

Melting Arctic sea ice is increasing warming in the region.
Jonathan Bamber, Author provided

This ice-albedo (really snow-albedo) feedback is particular potent in the Arctic because the Arctic Ocean is almost landlocked by Eurasia and North America, and it’s less easy (compared to the Antarctic) for ocean currents to move the sea ice around and out of the region. As a result, sea ice that stays in the Arctic for longer than a year has been declining at a rate of about 13% per decade since satellite records began in the late 1970s.

In fact, there is evidence to indicate that sea ice extent has not been this low for at least the last 1,500 years. Extreme melt events over the Greenland Ice Sheet, that used to occur once in every 150 years, have been seen in 2012 and now 2019. Ice core data shows that the enhanced surface melting on the ice sheet over the past decade is unprecedented over the past three and a half centuries and potentially over the past 7,000 years.

In other words, the record-breaking temperatures seen this summer in the Arctic are not a “one-off”. They are part of a long-term trend that was predicted by climate models decades ago. Today, we’re seeing the results, with permafrost thaw and sea ice and ice sheet melting. The Arctic has sometimes been described as the canary in the coal mine for climate breakdown. Well it’s singing pretty loudly right now and it will get louder and louder in years to come.The Conversation

——————————-
This blog is written by Cabot Institute member Jonathan Bamber, Professor of Physical Geography, University of BristolThis article is republished from The Conversation under a Creative Commons license. Read the original article.

Professor Jonathan Bamber

Predicting the hazards of weather and climate; the partnering of Bristol and the Met Office

Image credit Federico Respini on Unsplash

When people think of the University of Bristol University, or indeed any university, they sometimes think of academics sitting in their ivy towers, researching into obscurities that are three stages removed from reality, and never applicable to the world they live in. Conversely, the perception of the Met Office is often one of purely applied science, forecasting the weather; hours, days, and weeks ahead of time. The reality is far from this, and today, on the rather apt Earth Day 2020, I am delighted to announce a clear example of the multidisciplinary nature of both institutes with our newly formed academic partnership.

This new and exciting partnership brings together the Met Office’s gold standard weather forecasts and climate projections, with Bristol’s world leading impact and hazard models. Our partnership goal is to expand on the advice we already give decision makers around the globe, allowing them to make evidence-based decisions on weather-related impacts, across a range of timescales.

By combining the weather and climate data from the Met Office with our hazard and impact models at Bristol, we could, for instance, model the flooding impact from a storm forecasted a week ahead, or estimate the potential health burden from heat waves in a decade’s time. This kind of advanced knowledge is crucial for decision makers in many sectors. For instance, if we were able to forecast which villages might be flooded from an incoming storm, we could prioritise emergency relief and flood defenses in that area days ahead of time. Or, if we projected that hospital admissions would increase by 10% due to more major heatwaves in London in the 2030s, then decision makers could include the need for more resilient housing and infrastructure in their planning. Infrastructure often lasts decades, so these sorts of decisions can have a long memory, and we want our decision makers to be proactive, rather than reactive in these cases.

While the examples I give are UK focussed, both the University of Bristol and the Met Office are internationally facing and work with stakeholders all over the world. Only last year, while holding a workshop in the Caribbean on island resilience to tropical cyclones; seeing the importance of our work the prime minister of Jamaica invited us to his residence for a celebration. While I don’t see this happening with Boris Johnson anytime soon, it goes to show the different behaviours and levels of engagement policy makers have in different countries. It’s all very well being able to do science around the world, but if you don’t get the culture, they won’t get your science. It is this local knowledge and connection that is essential for an international facing partnership to work, and that is where both Bristol and the Met Office can pool their experience.

To ensure we get the most out of this partnership we will launch a number of new joint Bristol-Met Office academic positions, ranging from doctoral studentships all the way to full professorships. These positions will work with our Research Advisory Group (RAP), made up of academics across the university, and be associated with both institutes. The new positions will sit in this cross-disciplinary space between theory and application; taking a combined approach to addressing some of the most pressing environmental issues of our time.

As the newly appointed Met Office Joint Chair I will be leading this partnership at Bristol over the coming years, and I welcome discussions and ideas from academics across the university; some of the best collaborations I’ve had have come from a random knock on the door, so don’t be shy in sharing your thoughts.

———————————
This blog is written by Dr Dann Mitchell – Met Office Joint Chair and co-lead of the Cabot Institute for the Environment’s Natural Hazards and Disaster Risk research.
You can follow him on Twitter @ClimateDann.

Dann Mitchell