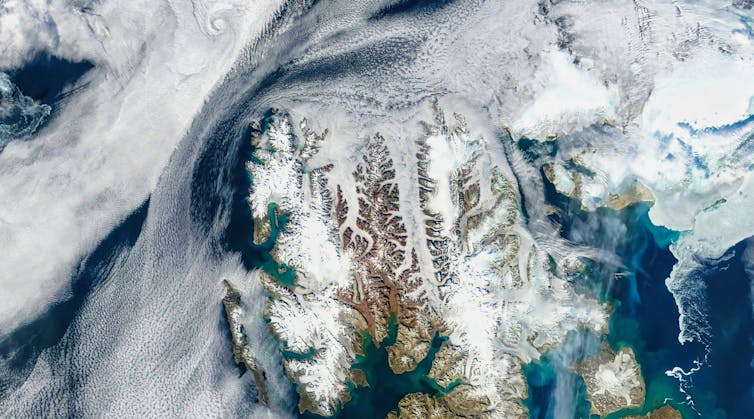
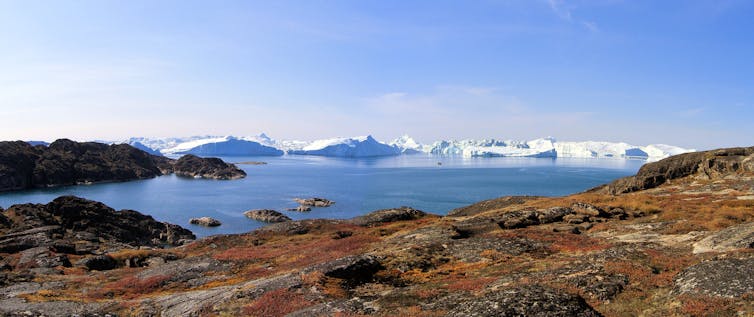
The Arctic has warmed nearly four times faster than the global average since 1979. Svalbard, an archipelago near the northeast coast of Greenland, is at the frontline of this climate change, warming up to seven times faster than the rest of the world.
More than half of Svalbard is covered by glaciers. If they were to completely melt tomorrow, the global sea level would rise by 1.7cm. Although this won’t happen overnight, glaciers in the Arctic are highly sensitive to even slight temperature increases.
To better understand glaciers in Svalbard and beyond, we used an AI model to analyse millions of satellite images from Svalbard over the past four decades. Our research is now published in Nature Communications, and shows these glaciers are shrinking faster than ever, in line with global warming.
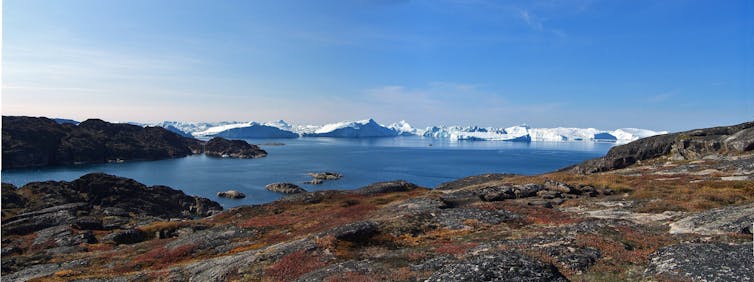
Specifically, we looked at glaciers that drain directly into the ocean, what are known as “marine-terminating glaciers”. Most of Svalbard’s glaciers fit this category. They act as an ecological pump in the fjords they flow into by transferring nutrient-rich seawater to the ocean surface and can even change patterns of ocean circulation.
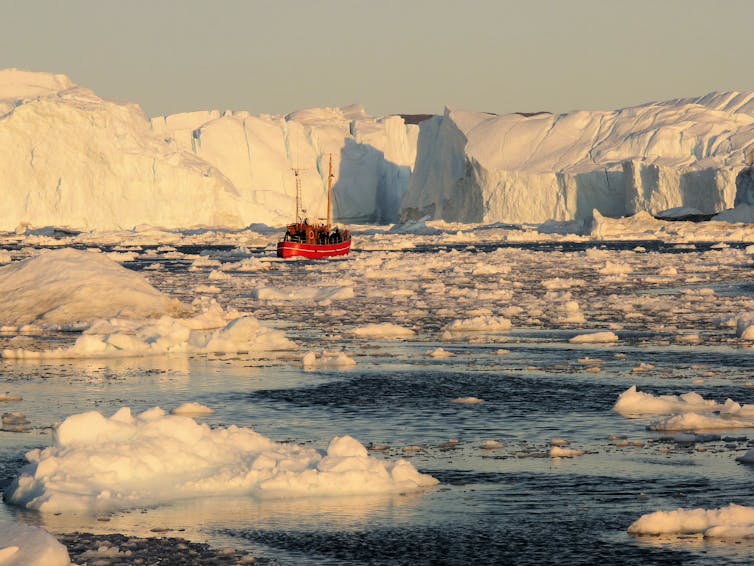
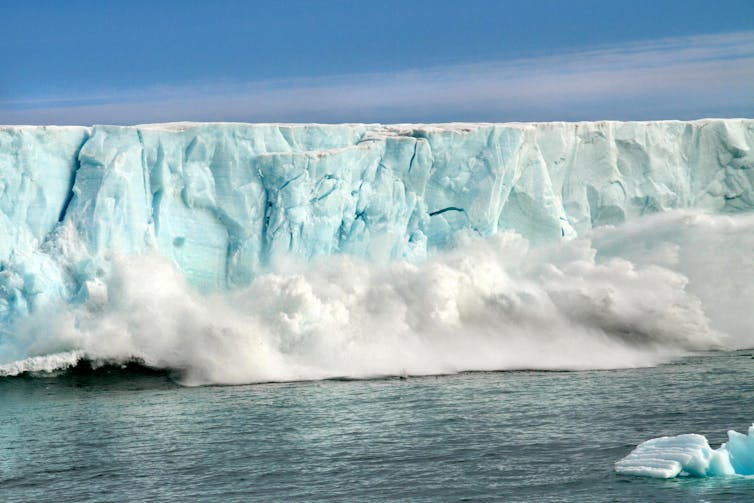
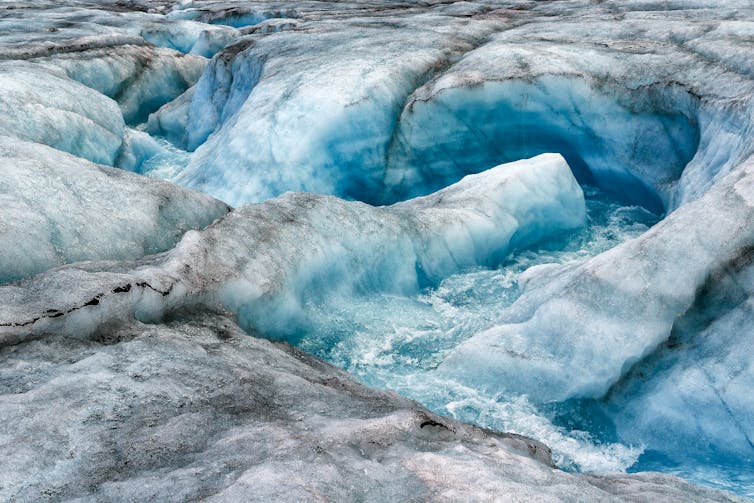
Where these glaciers meet the sea, they mainly lose mass through iceberg calving, a process in which large chunks of ice detach from the glacier and fall into the ocean. Understanding this process is key to accurately predicting future glacier mass loss, because calving can result in faster ice flow within the glacier and ultimately into the sea.

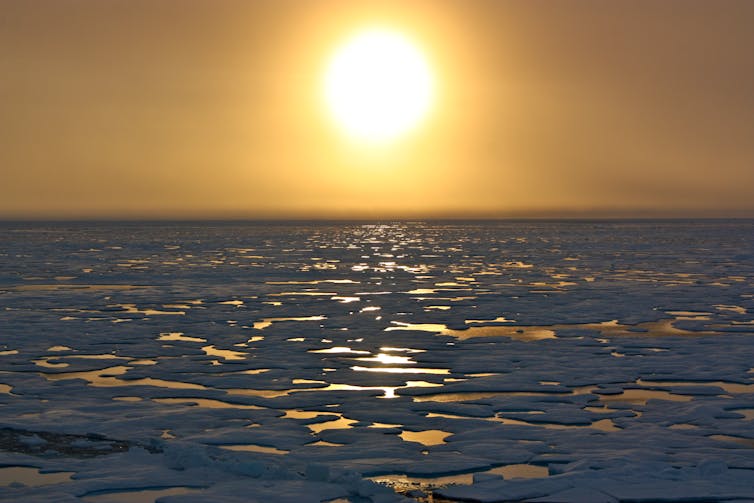
Peter Hermes Furian / shutterstock
Despite its importance, understanding the glacier calving process has been a longstanding challenge in glaciology, as this process is difficult to observe, let alone accurately model. However, we can use the past to help us understand the future.
AI replaces painstaking human labour
When mapping the glacier calving front – the boundary between ice and ocean – traditionally human researchers painstakingly look through satellite imagery and make digital records. This process is highly labour-intensive, inefficient and particularly unreproducible as different people can spot different things even in the same satellite image. Given the number of satellite images available nowadays, we may not have the human resources to map every region for every year.
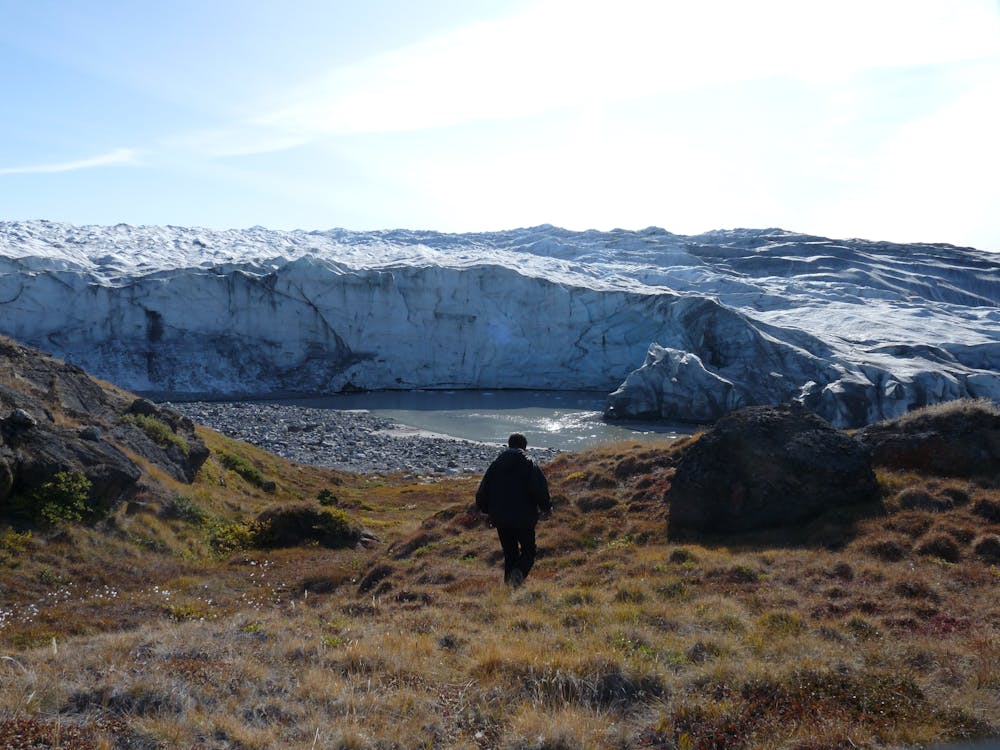
A novel way to tackle this problem is by using automated methods like artificial intelligence (AI), which can quickly identify glacier patterns across large areas. This is what we did in our new study, using AI to analyse millions of satellite images of 149 marine-terminating glaciers taken between 1985 and 2023. This meant we could examine the glacier retreats at unprecedented scale and scope.

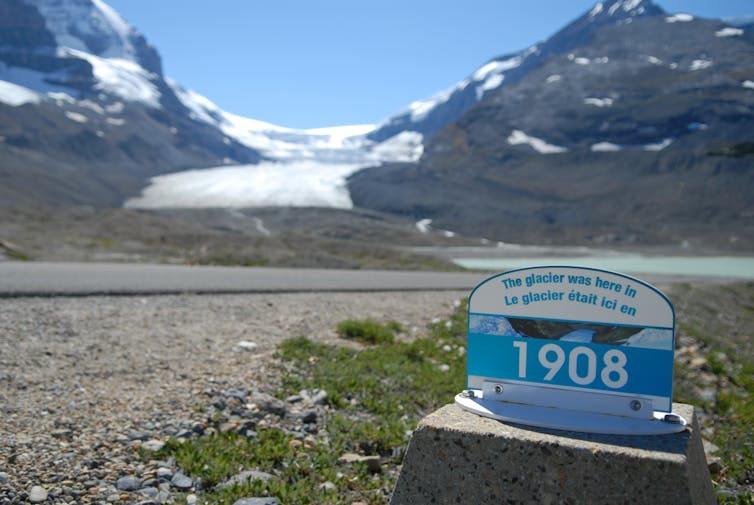
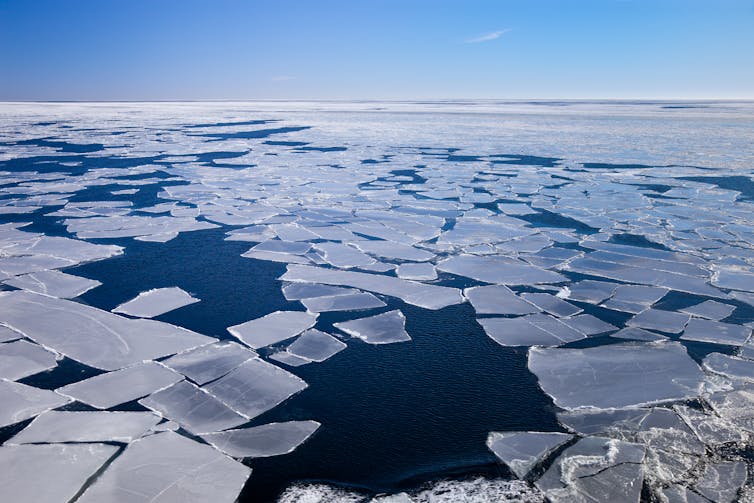
RUBEN M RAMOS / shutterstock
Insights from 1985 to today
We found that the vast majority (91%) of marine-terminating glaciers across Svalbard have been shrinking significantly. We discovered a loss of more than 800km² of glacier since 1985, larger than the area of New York City, and equivalent to an annual loss of 24km² a year, almost twice the size of Heathrow airport in London.
The biggest spike was detected in 2016, when the calving rates doubled in response to periods of extreme warming. That year, Svalbard also had its wettest summer and autumn since 1955, including a record 42mm of rain in a single day in October. This was accompanied by unusually warm and ice-free seas.
How ocean warming triggers glacier calving
In addition to the long-term retreat, these glaciers also retreat in the summer and advance again in winter, often by several hundred metres. This can be greater than the changes from year to year.
We found that 62% of the glaciers in Svalbard experience these seasonal cycles. While this phenomenon is well documented across Greenland, it had previously only been observed for a handful of glaciers in Svalbard, primarily through manual digitisation.

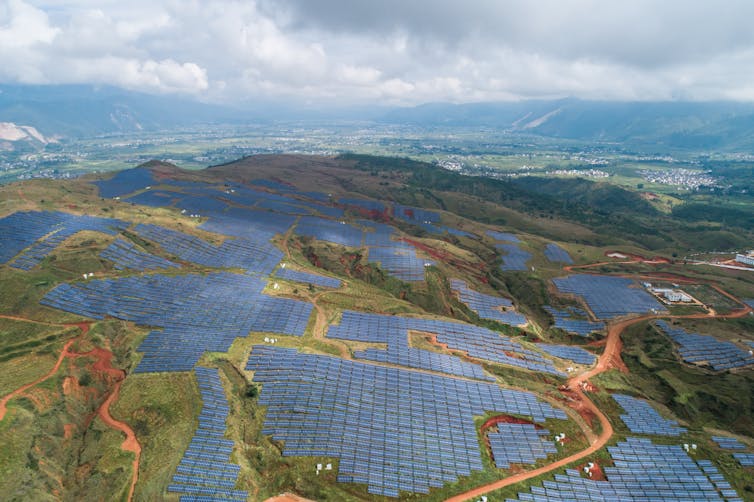
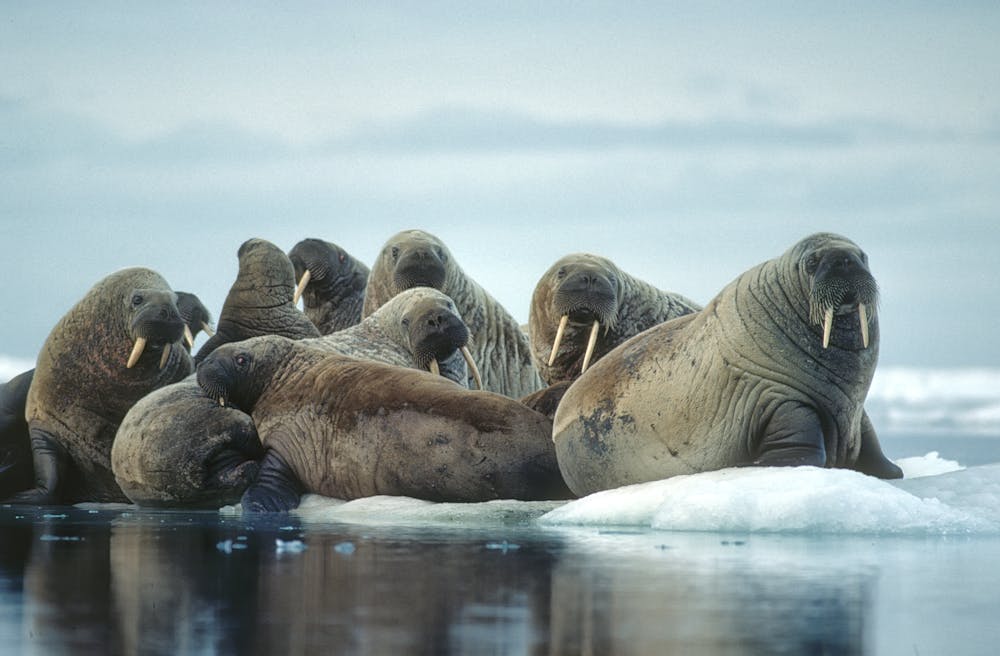
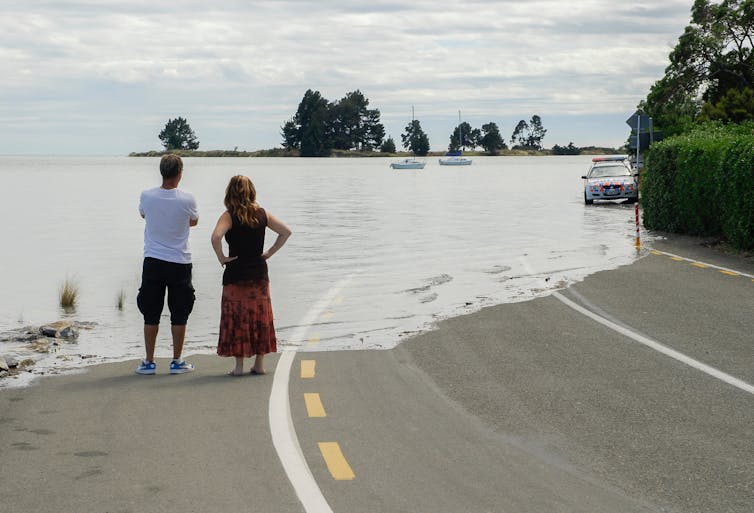
Wildnerdpix / shutterstock
We then compared these seasonal changes with seasonal variations in air and ocean temperature. We found that as the ocean warmed up in spring, the glacier retreated almost immediately. This was a nice demonstration of something scientists had long suspected: the seasonal ebbs and flows of these glaciers are caused by changes in ocean temperatures.
A global threat
Svalbard experiences frequent climate extremes due to its unique location in the Arctic yet close to the warm Atlantic water. Our findings indicate that marine-terminating glaciers are highly sensitive to climate extremes and the biggest retreat rates have occurred in recent years.
This same type of glaciers can be found across the Arctic and, in particular, around Greenland, the largest ice mass in the northern hemisphere. What happens to glaciers in Svalbard is likely to be repeated elsewhere.
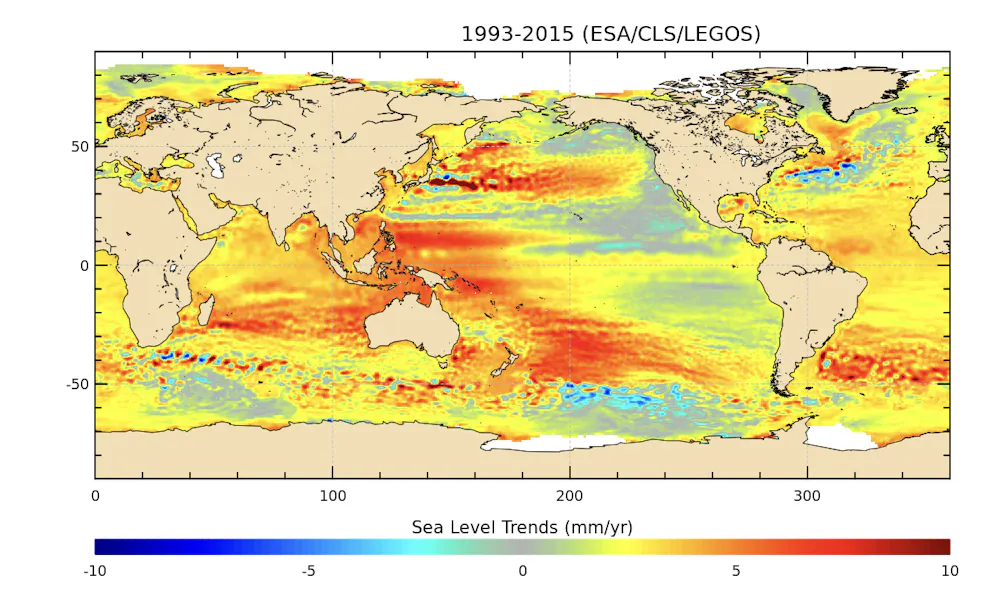
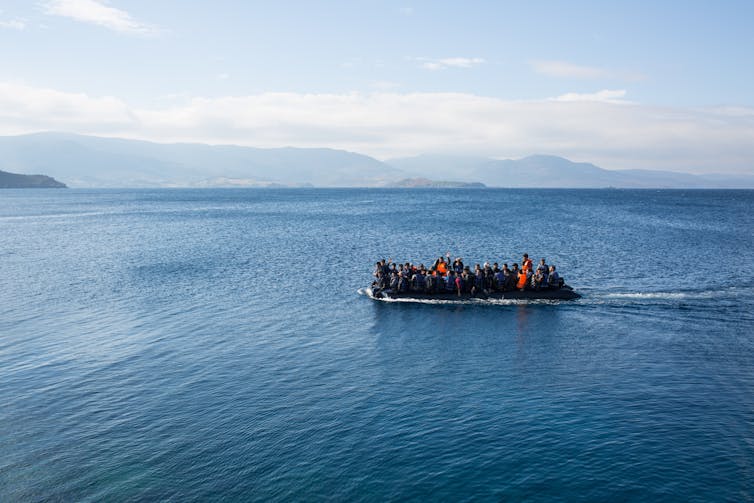
If the current climate warming trend continues, these glaciers will retreat more rapidly, the sea level will rise, and millions of people in coastal areas worldwide will be endangered.
———————
This blog is written by Tian Li, Senior Research Associate, Bristol Glaciology Centre, University of Bristol; Jonathan Bamber, Professor of Glaciology and Earth Observation, University of Bristol, and Konrad Heidler, Chair of Data Science in Earth Observation, Technical University of Munich. This article is republished from The Conversation under a Creative Commons license. Read the original article.


