Life in the deep freeze – the revolution that changed our view of glaciers forever

I’ve been fascinated by glaciers since I was 14, when geography textbooks taught me about strange rivers of ice that crept down yawning valleys like giant serpents stalking their next meal. That kernel of wonder has carried me through a career of more than 25 years. I’ve travelled to the world’s peaks and its poles to see over 20 glaciers. Yet, when I first started out as a researcher in the early 1990s, we were convinced glaciers were lifeless deserts.

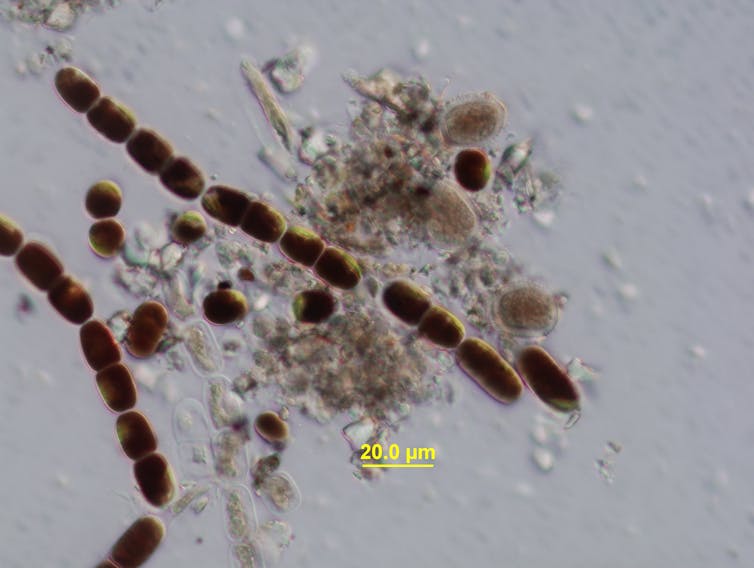
Then in 1999, Professor Martin Sharp and colleagues discovered bacteria living beneath the Haut Glacier d’Arolla in Switzerland. It seemed that glaciers, like the soil or our stomachs, had their own community of microbes, their own microbiome. Since then, we’ve found microorganisms just about everywhere within glaciers, transforming what we thought were sterile wastelands into vibrant ecosystems.

So what’s all that glacier life doing? These life forms may be invisible to the naked eye, but they can control how fast glaciers melt – and may even influence the global climate.

The glacier microbiome

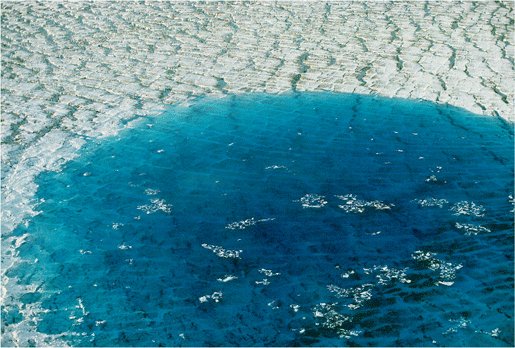
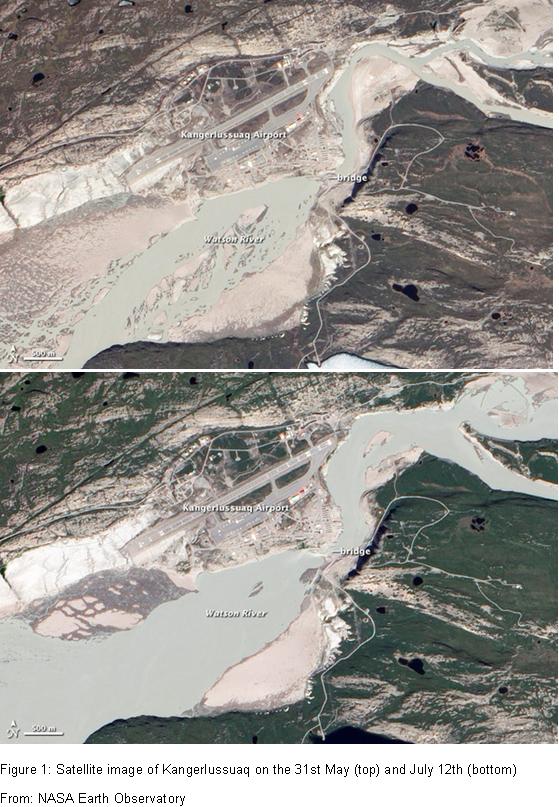
Just like people, glacier microbes modify their homes. When I first saw the melting fringes of Greenland’s vast ice sheet, it looked as if a dust storm had scattered a vast blanket of dirt on the ice. Our team later discovered the dirt included extensive mats of glacier algae. These microscopic plant-like organisms contain pigments to help them harvest the Sun’s rays and protect them from harsh UV radiation. By coating the melting ice surface, they darken it, ensuring the ice absorbs more sunlight which causes more of it to melt. In western Greenland, more than 10% of the summer ice melt is caused by algae.

Bright blue glacier ice on rocky terrain.
The margin of Engabreen glacier, Norway.
Grzegorz Lis, Author provided

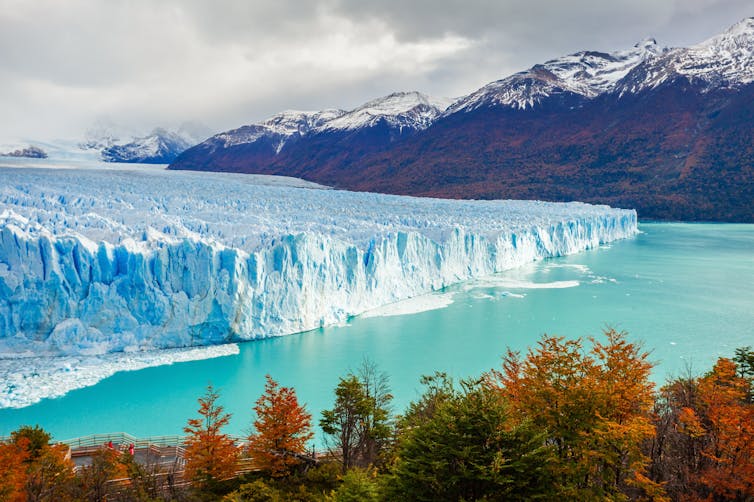
Again, just like us, microbes extract things from their environment to survive. The murky depths of glaciers are among the most challenging habitats for life on Earth. Microbes called chemolithotrophs – from the Greek meaning “eaters of rock” – survive here without light and get their energy from breaking down rock, releasing vital nutrients like iron, phosphorous and silicon to the meltwater.

Rivers and icebergs carry these nutrients to the ocean where they sustain the plant-like phytoplankton – the base of marine food webs which ultimately feed entire ecosystems, from microscopic animals, to fish and even whales. Models and satellite observations show a lot of the photosynthesis in the iron-starved Southern Ocean could be sustained by rusty icebergs and meltwaters, which contain iron unlocked by glacier microbes. Recent evidence suggests something similar occurs off west and east Greenland too.

A microscope image depicting chains of brown rectangular cells.
Glacier algae from the Greenland ice sheet.
Chris Williamson, Author provided

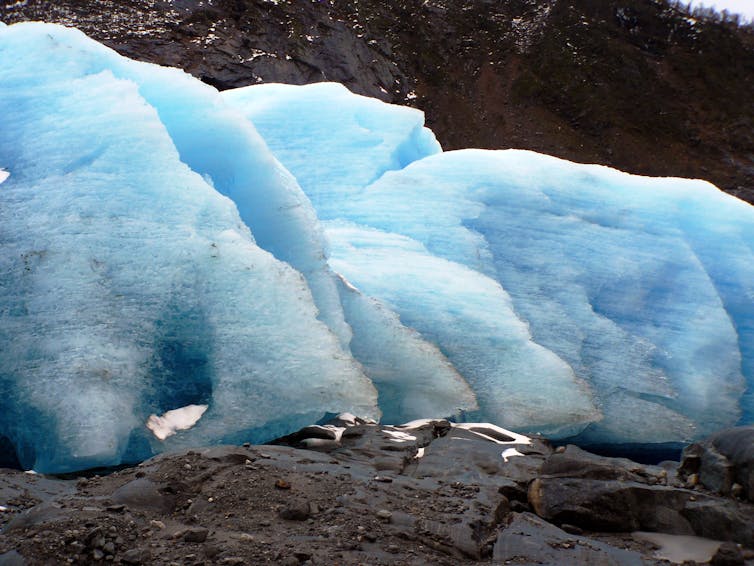
But glacier bugs also produce waste, the most worrying of which is the greenhouse gas methane. When ice sheets grow, they bury old soils and sediments, all sources of carbon and the building blocks for earthly life. We think there could be thousands of billions of tonnes of carbon buried beneath ice sheets – potentially more than Arctic permafrost. But who can use it in the oxygen-starved belly of an ice sheet? One type of microbe that flourishes here is the methanogen (meaning “methane maker”), which also thrives in landfill sites and rice paddies.

A waterfall at the edge of a glacier.
Leverett Glacier’s wild river, Greenland.
Jemma Wadham, Author provided

Some methane produced by methanogens escapes in meltwaters flowing from the ice sheet edges. The clever thing about microbial communities, though, is that one microbe’s waste is another’s food. We humans could learn a lot from them about recycling. Some methane beneath glaciers is consumed by bacteria called methanotrophs (methane eaters) which generate energy by converting it to carbon dioxide. They have been detected in Greenlandic glaciers, but most notably in Lake Whillans beneath the West Antarctic Ice Sheet. Here, bacteria have years to chomp on the gas, and almost all of the methane produced in the lake is eaten – a good thing for the climate, since carbon dioxide is 80 times less potent as a greenhouse gas when measured over two decades.

We’re not sure this happens everywhere though. Fast-flowing rivers emerging from the Greenland Ice Sheet are super-saturated with microbial methane because there just isn’t enough time for the methanotrophs to get to work. Will melting glaciers release stored methane faster than these bacteria can convert it?

Within the thick interior of ice sheets, scientists worry that there may be vast reserves of methane. The cold and high pressure here mean that it may be trapped in its solid form, methane hydrate (or clathrate), which is stable unless the ice retreats and thins. It happened before and it could happen again.

Waking the sleeping giant

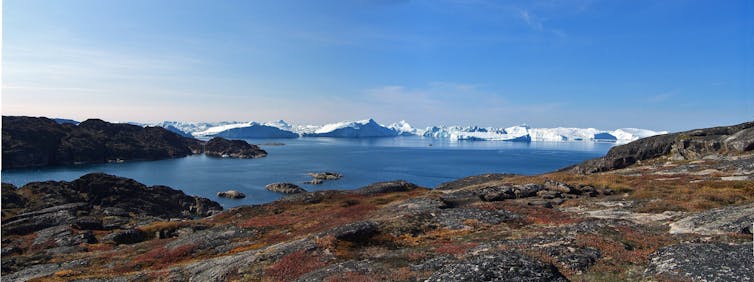
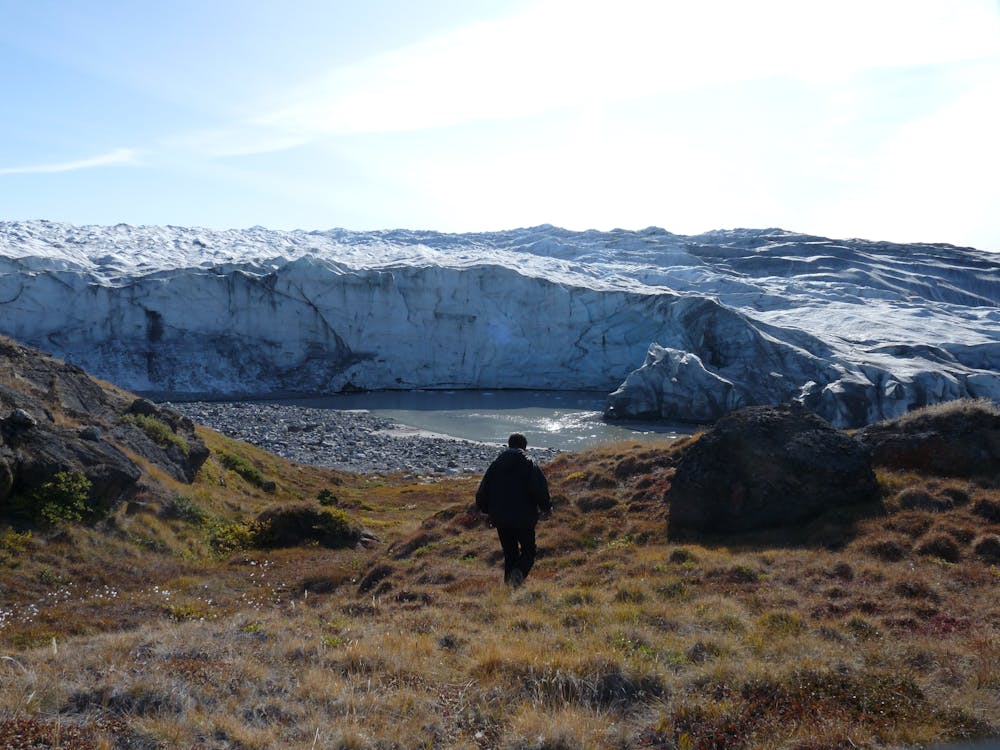
Despite the climate crisis, when I spend time around glaciers I’m not surprised by their continuing vitality. As I amble up to the gently sloping snout of a glacier – traversing its rubbly lunar-like fore-fields – I often feel like I’m approaching the hulk of an enormous creature. Sleeping or seemingly dormant, the evidence of its last meal is clear from the mass of tawny-coloured rocks, pebbles and boulders strewn around its edges – a tantalising record of where it once rested when the climate was cooler.

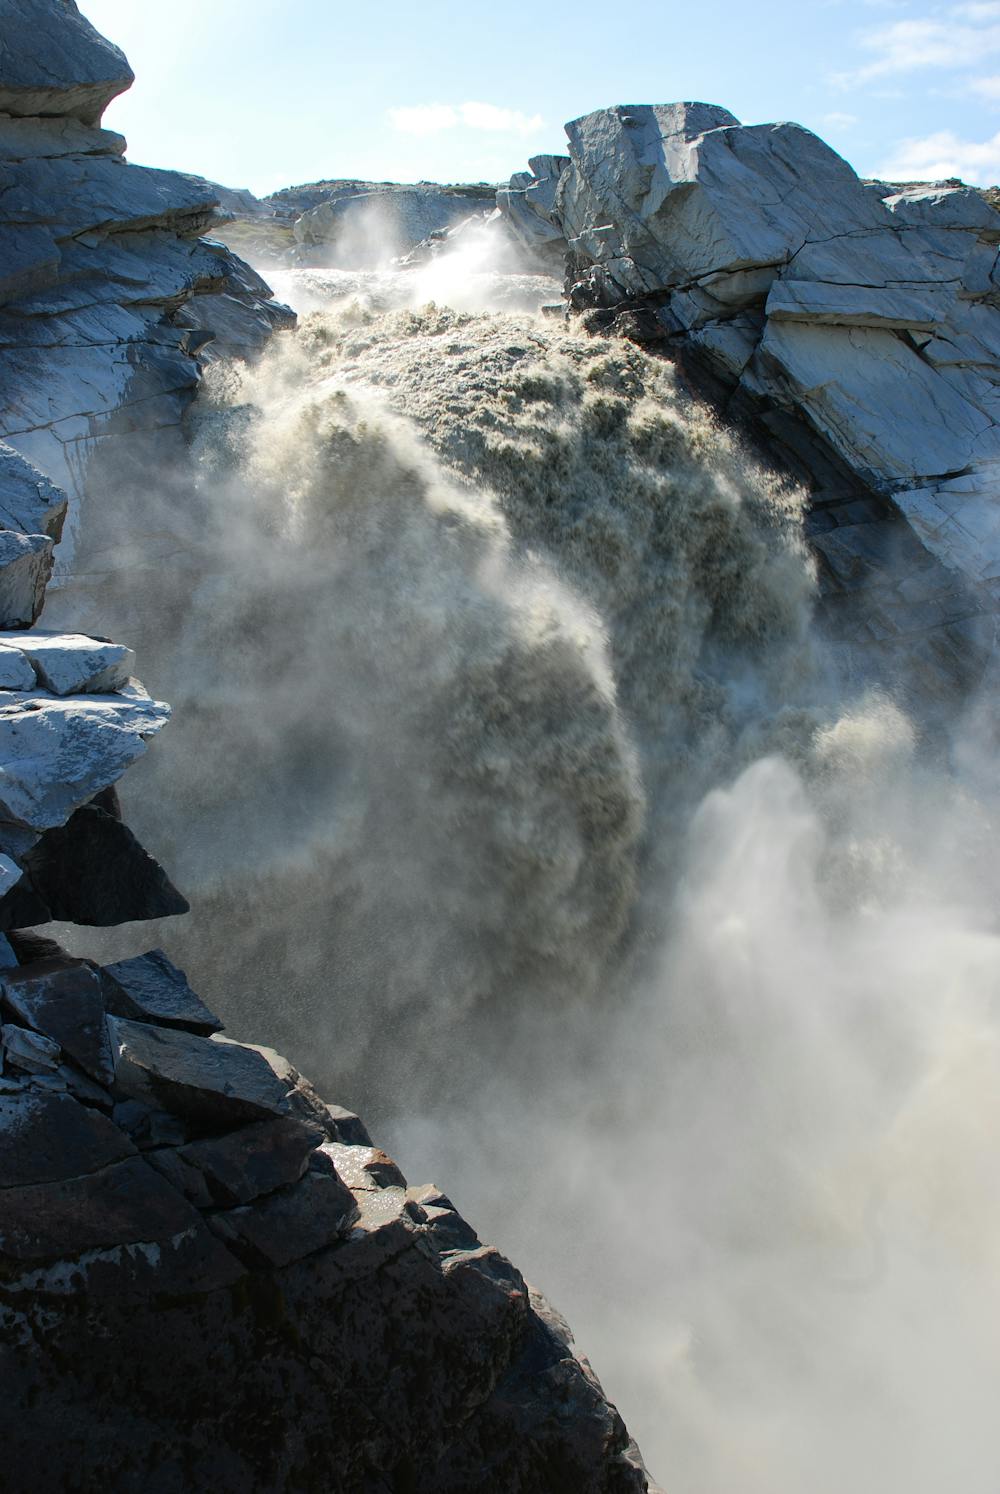
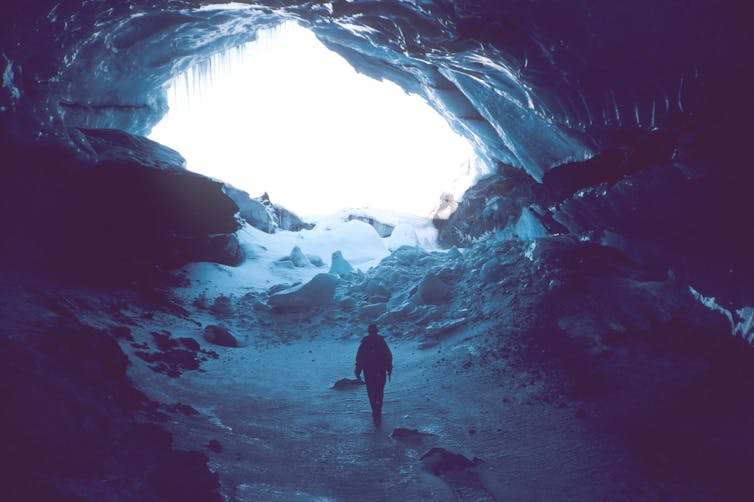
As I get closer, I catch the sound of the glacier’s roaring chocolate meltwaters as they explode through an ice cave, punctuated by a cascade of bangs and booms as moving ice collapses into hollow melt channels below. The winds off the ice play ominously in my ears, like the whisper of the beast, a warning: “You’re on my land now.”

The author inside a giant icy chasm within a glacier.
Exploring a frozen melt channel of the Finsterwalderbeeen glacier in Svalbard.
Jon Ove Hagen, Author provided

This sense of aliveness with glaciers changes everything. Resident microbes connect these hulking frozen masses with the Earth’s carbon cycle, ecosystems and climate. How will these connections change if we take away the frigid homes of our tiny glacier dwellers? These creatures may be microscopic, but the effects of their industry span entire continents and oceans.

After a period of uncertainty in my own life, which involved the removal of a satsuma-sized growth in my brain, I felt compelled to tell the story of glaciers to a wider audience. My book, Ice Rivers, is the result. I hope the memoir raises awareness of the dramatic changes that threaten glaciers – unless we act now.The Conversation

———————————-

This blog is written by Cabot Institute for the Environment Director Jemma Wadham, Professor of Glaciology, University of Bristol.

This article is republished from The Conversation under a Creative Commons license. Read the original article.

Professor Jemma Wadham


Greenland is melting: we need to worry about what’s happening on the largest island in the world

Jonathan Bamber, Author provided

Greenland is the largest island in the world and on it rests the largest ice mass in the Northern Hemisphere. If all that ice melted, the sea would rise by more than 7 metres.

But that’s not going to happen is it? Well not any time soon, but understanding how much of the ice sheet might melt over the coming century is a critical and urgent question that scientists are trying to tackle using sophisticated numerical models of how the ice sheet interacts with the rest of the climate system. The problem is that the models aren’t that good at reproducing recent observations and are limited by our poor knowledge of the detailed topography of the subglacial terrain and fjords, which the ice flows over and in to.

One way around this problem is to see how the ice sheet responded to changes in climate in the past and compare that with model projections for the future for similar changes in temperature. That is exactly what colleagues and I did in a new study now published in the journal Nature Communications.

We looked at the three largest glaciers in Greenland and used historical aerial photographs combined with measurements scientists had taken directly over the years, to reconstruct how the volume of these glaciers had changed over the period 1880 to 2012. The approach is founded on the idea that the past can help inform the future, not just in science but in all aspects of life. But just like other “classes” of history, the climate and the Earth system in future won’t be a carbon copy of the past. Nonetheless, if we figure out exactly how sensitive the ice sheet has been to temperature changes over the past century, that can provide a useful guide to how it will respond over the next century.

A man walks over grassy land with glacier in background
Greenland’s glaciers contain around 8% of the world’s fresh water.
Jonathan Bamber, Author provided

We found that the three largest glaciers were responsible for 8.1mm of sea level rise, about 15% of the whole ice sheet’s contribution. Over the period of our study the sea globally has risen by around 20cm, about the height of an A5 booklet, and of that, about a finger’s width is entirely thanks to ice melting from those three Greenland glaciers.

Melting As Usual

So what does that tell us about the future behaviour of the ice sheet? In 2013, a modelling study by Faezeh Nick and colleagues also looked at the same “big three” glaciers (Jakobshavn Isbrae in the west of the island and Helheim and Kangerlussuaq in the east) and projected how they would respond in different future climate scenarios. The most extreme of these scenarios is called RCP8.5 and assumes that economic growth will continue unabated through the 21st century, resulting in a global mean warming of about 3.7˚C above today’s temperatures (about 4.8˚C above pre-industrial or since 1850).

This scenario has sometimes been referred to as Business As Usual (BAU) and there is an active debate among climate researchers regarding how plausible RCP8.5 is. It’s interesting to note, however, that, according to a recent study from a group of US scientists it may be the most appropriate scenario up to at least 2050. Because of something called polar amplification the Arctic will likely heat up by more than double the global average, with the climate models indicating around 8.3˚C warming over Greenland in the most extreme scenario, RCP8.5.

Despite this dramatic and terrifying hike in temperature Faezeh’s modelling study projected that the “big three” would contribute between 9 and 15 mm to sea level rise by 2100, only slightly more than what we obtained from a 1.5˚C warming over the 20th century. How can that be? Our conclusion is that the models are at fault, even including the latest and most sophisticated available which are being used to assess how the whole ice sheet will respond to the next century of climate change. These models appear to have a relatively weak link between climate change and ice melt, when our results suggest it is much stronger. Projections based on these models are therefore likely to under-predict how much the ice sheet will be affected. Other lines of evidence support this conclusion.

What does all of that mean? If we do continue along that very scary RCP8.5 trajectory of increasing greenhouse gas emissions, the Greenland ice sheet is very likely to start melting at rates that we haven’t seen for at least 130,000 years, with dire consequences for sea level and the many millions of people who live in low lying coastal zones.The Conversation

————————–

This blog is written by Cabot Institute member Jonathan Bamber, Professor of Physical Geography, University of BristolThis article is republished from The Conversation under a Creative Commons license. Read the original article.

Professor Jonathan Bamber


The controversy of the Greenland ice sheet

I was expecting a dusty road, a saloon door swinging, two geologists standing facing each other in spurrs and cowboy hats with their hands twitching at their sides, both ready to whip out their data and take down their opponent with one well-argued conclusion.

Sadly (for me), things were much more friendly at Professor Pete Nienow‘s seminar in Bristol’s Geographical Sciences department last week. Twelve years ago he visited the University with a controversial hypothesis, causing considerable debate with members of the department. Now he was back, Powerpoint at the ready, to revisit the theory.

Professor Nienow is a glaciologist at the University of Edinburgh. He is currently researching glacial movement and mass in Greenland, but I’ll let him tell you more.


Pete Nienow – GeoScience from Research in a Nutshell on Vimeo.

The Greenland ice sheet covers almost 80% of the country, enclosed by mountains around its edges. The ice sheet is dynamic; glaciers are constantly moving down from the summit towards the sea but replaced each winter by snow. Glaciers are funnelled through the mountains in large “outlet glaciers” that either melt or break into icebergs when they reach the sea.

There is plenty of evidence to suggest that the outlet glaciers are speeding up, rushing down to meet the sea almost twice as fast as they did in the 1970s. Unfortunately that means more melting icebergs floating around, contributing to sea level rise. The winter snowfall is not able to replenish this increased loss of glacial mass, so the Greenland ice sheet is slowly shrinking.

Coverage of the Greenland ice sheet in different future climate change scenarios. A critical tipping
point could be reached, after which it will be impossible to stop the ice from melting and raising sea
levels by seven metres globally.  Source: Alley et al., 2005 (Science)

Controversy

Professor Nienow stirred up a debate in 2002, when he proposed that the Zwally Effect could be hugely important for the Greenland ice sheet. This theory suggests that meltwater could seep down through the glacier to the bedrock, lubricating and speeding up the glacial movement.

The conventional wisdom of the time was that it would be impossible for meltwater to pass through the 2km of solid ice that comprises most of the Greenland ice sheet. The centre of the glacier is around -15 to -20°C, so the just-above-freezing water would never be able to melt its way through.

Meltwater research

Meltwater on glaciers often pools on the surface, creating supraglacial lakes. These lakes can drain slowly over the surface, but Professor Nienow found that they can disappear rapidly too. The water slips down through cracks in the ice to the bedrock, leading to a rapid spike in the amount of meltwater leaving the glacier.

Supraglacial lake.
Source: United States Geological Survey, Wikimedia Commons

Meltwater can reach the base of the glacier so that’s one point to Nienow, but can this actually affect the movement of the glacier?

During the summer, the higher temperatures lead to increased glacial melting, which drains down to the bedrock. This raises the water pressure under the glacier, forcing it to slide more rapidly.  Interestingly, as the season progresses, Nienow found that the meltwater forms more efficient drainage channels beneath the glacier, stabilising the speed of the ice.

Nienow was almost ready to mosey on back to Bristol, show them how subglacial meltwater had clear implications of glacier loss for a warmer world, and declare himself the Last Geologist Standing.

Turning point

Glaciologists had always assumed that the winter glacier velocity was consistently low. However, at the end of a very warm 2010, Nienow and his colleagues discovered a blip of especially low speeds, even slower than the standard winter “constant”.

The large channels underneath the glaciers formed by the extra meltwater of that hot year actually reduced the subglacial water pressure during the winter, slowing the glacier more than on a normal year. Nienow found that this winter variability is critical for overall glacier velocity and displacement. In 2010, the net effect of both summer and winter actually meant that the glacier velocity was reduced in this hot year.

Back to Bristol

Nienow returned to Bristol to give his seminar. Somewhat unlike a cowboy film, Nienow concluded that it was a draw; he’d been right that it was possible for meltwater to seep down to the bedrock and lubricate glacial movement, but his friends at Bristol had been correct in thinking that it wasn’t very important in the grand scheme of things.

A collaborative paper between Professor Nienow, the Bristol team and other glaciologists from around the world found that subglacial meltwater will only have a minor impact on sea level rise, contributing less than 1cm of water globally by 2200.  Surface run off and the production of icebergs will continue to play a bigger role, even in a warming world. The computer models used to predict sea level rise will be able to include these findings to give a more accurate insight into future glacier movement and coverage across Greenland and beyond.

Bristol glaciologist Dr. Sarah Shannon, lead author on the paper, pointed out that whilst overall glacier velocity is unlikely to be affected by subglacial meltwater in warm years, “global warming will still contribute to sea level rise by increasing surface melting which will run directly into the ocean”.

This blog is written by Sarah Jose, Cabot Institute, Biological Sciences, University of Bristol
You can follow Sarah on Twitter @JoseSci

Sarah Jose


Unprecedented melting of the Greenland Ice Sheet

Three Cabot Institute researchers provide their own insights on the highly publicised news story about the extent of melting observed on the Greenland Ice Sheet.


Chris Vernon, Ph.D student in the Bristol Glaciology Centre, studying the mass balance of the Greenland Ice Sheet

Last week NASA released new images of the Greenland ice sheet generated from satellite data showing that between the 8th and 12th of July 2012 the area of the ice sheet’s surface that was melting had increased from about 40 percent to an estimated 97 percent.  On average during the summer approximately half of the ice sheet experiences such surface melting and this expansion of the melt area to include the highest altitude and coldest regions was described as “unprecedented” by the scientists at NASA.  Such widespread melting has not been seen before during the past 34 years of satellite observations and melting at Summit Station, near the highest point on the ice sheet, has not occurred since 1889 based on ice core records.

The Greenland ice sheet gains mass from rain and snowfall and loses mass by solid ice discharge to the ocean (iceberg calving) and runoff of surface melt water.  During the period 1961-1990 these processes are thought to have been in balance with the ice sheet’s mass stable (Rignot et al., 2008).  During the last two decades, however, both ice discharge and liquid runoff have increased resulting in the ice sheet losing mass over this period at an accelerating rate (Velicogna, 2009, Rignot et al., 2011). Changes to these two processes have contributed approximately equally to recent mass loss (van den Broeke et al., 2009).  Whilst these NASA images do not provide data about how much snow and ice have melted or the direct effect on mass balance, they do indicate a significantly larger area of the ice sheet has been melting.

While this melting is an extreme weather event, associated with a series of unusually warm fronts passing over Greenland this summer, new research on the ice sheet’s albedo from Jason Box, a researcher with Ohio State University’s Byrd Polar Research Center, shows summer albedo has been decreasing over the last decade.  This reduced reflectivity, particularly at high elevations, is associated with warming related feedbacks and means more energy is absorbed at the surface for melting leading Box to suggest earlier this year that it is reasonable to expect 100% melt extent within another decade of warming (Box et al., 2012).  His latest albedo data are available here: http://bprc.osu.edu/wiki/Latest_Greenland_ice_sheet_albedo.


References (some behind paywall)

BOX, J. E., FETTWEIS, X., STROEVE, J. C., TEDESCO, M., HALL, D. K. & STEFFEN, K. 2012. Greenland ice sheet albedo feedback: thermodynamics and atmospheric drivers. The Cryosphere Discuss, 6, 593-634.

RIGNOT, E., BOX, J. E., BURGESS, E. & HANNA, E. 2008. Mass balance of the Greenland ice sheet from 1958 to 2007. Geophysical Research Letters, 35.

RIGNOT, E., VELICOGNA, I., VAN DEN BROEKE, M. R., MONAGHAN, A. & LENAERTS, J. 2011. Acceleration of the contribution of the Greenland and Antarctic ice sheets to sea level rise. Geophysical Research Letters, 38.

VAN DEN BROEKE, M., BAMBER, J., ETTEMA, J., RIGNOT, E., SCHRAMA, E., VAN DE BERG, W. J., VAN MEIJGAARD, E., VELICOGNA, I. & WOUTERS, B. 2009. Partitioning Recent Greenland Mass Loss. Science, 326, 984-986.

VELICOGNA, I. 2009. Increasing rates of ice mass loss from the Greenland and Antarctic ice sheets revealed by GRACE. Geophysical Research Letters, 36.


Liz Stephens, Research Assistant in flood risk and co-author of article: ‘Communicating probabilistic information from climate model ensembles-lessons from numerical weather prediction’ soon to be published in WIRES Climate Change

The story of the unprecedented extent of melting of the Greenland ice sheet no doubt forms an important discussion point amongst scientists and those concerned about future climate change in the Arctic. However, for me it demonstrated the problems of clumsy communication; causing confusion that led some to think that the entire ice sheet had melted, and accusations of sensationalism from climate change sceptics (see http://sfy.co/a1AS for examples).

My main grievance is in the use of colour in the images. This may be the standard colour bar used by the NASA scientists, but it is too emotive for those not used to what is being referred to. At first glance the white area suggests ‘this is ice’, and the red, ‘we should be really scared that this is no longer white’.  In my opinion the colour white should not be used because it is evocative of what is ice rather than what is freezing ice, and so more neutral colours should be used to distinguish areas of melting from areas of freezing ice.

Additionally, I think that some of the language used is problematic; scientists need to be careful not to assume that people understand what is meant by the terms ‘ice sheet’, ‘area’, ‘surface’ etc., so that people don’t think that the entire volume of the ice sheet has disappeared.  Further, the subheading of the Guardian article – 97% surface melt over four days – is misleading, because the images refer to the area of the ice sheet that is undergoing melting and not the rate of melting itself, and so is not a direct indication of any volume of ice lost.

I also don’t like some of the phrasing used, particularly, ‘had thawed’. This is perhaps misleading, because if 97% of the ice sheet surface ‘had thawed’, then perhaps some might think that only 3% of the ice sheet surface would be left. I would probably go for an image caption of:

“The area of the Greenland ice sheet surface that was melting on July 8, left, compared to July 12th on the right.”

Subtle changes to the language can make it clear that this is an unusual weather event that could be indicative of climate change, rather than the ice sheet starting to disappear for good.


Jon Hawkings, Ph.D student in the Bristol Glaciology Centre, studies the chemistry of glacial meltwaters

During the course of my stay at the University of Bristol-led field site near Leverett glacier in south-west Greenland, I witnessed the start of what has since been identified as one of the most significant Greenland melt years over the past century. Over that time Leverett glacier’s subglacial drainage river, fed by the melting ice sheet surface together with stored meltwater from the bed, had altered from a small stream to a raging torrent. Although this is usual for a glacial river during a melt season in Greenland, the scale of change was unprecedented. Temperatures around camp far exceeded my expectations. I packed expedition gear expecting Arctic summer temperatures of around 10°C – a little higher than I had previously experienced in the northerly island archipelago of Svalbard. What I experienced were temperatures sometimes reaching 20°C. In our camp mess tent where we cooked and ate our meals the temperature would sometimes exceed 30°C – shorts and t-shirt weather – were it not for the thousands of mosquitoes that were thriving in the warmer weather. In June I often found myself processing samples in the science tent with beads of sweat on my brow.

When the discharge of the river exiting the margin of Leverett glacier hit around 500 m3/s in late June (over six times that of the average River Thames discharge when flowing through London), it was evident to all of the camp that the 2012 melt season was going to be much larger than in previous years. Over the period that Leverett catchment has been studied (2009-), river discharge usually reaches a high of 405 m3/s, and that was in early August – more than a month after this high (and therefore after a month’s more melt). At that time a bridge crossing the glacial meltwater river in the nearest town, Kangerlussuaq, approximately 25 km downstream (Watson River, fed by Leverett glacier and two other large glaciers in the area), had to be closed as the amount of water deemed it unsafe. I’ve recently been informed that discharge of Leverett river has subsequently hit more than 800 m3/s since I left camp – nearly twice that of the previous high. At the same time Watson River discharge at Kangerlussuaq was nearly double its previous high (3500 m3/s – more than the average discharge of the Nile), and in dramatic fashion has washed away the same bridge that was closed in 2010 (see http://www.guardian.co.uk/environment/picture/2012/jul/27/glaciers-flooding?newsfeed=true# and http://www.guardian.co.uk/environment/2012/jul/25/greenland-glacier-bridge-destroyed-video?newsfeed=true). Although a trend for higher melt season discharge has been observed, locals and scientists in the Kangerlussuaq area have all been taken aback by the magnitude of change experienced this year (http://www.ouramazingplanet.com/3254-greenland-flooding.html).

As this was my first field season in Greenland it was difficult for me to grasp the scale of change from previous years. Ben Linhoff, an isoptope geochemist from Woods Hole Oceanographic Institute in Massachusetts, USA, has been in camp during the 2011 and 2012 melt seasons, and was surprised by the difference in temperature and river size between the two years. He has documented the scale of change on his Scientific American blog (http://blogs.scientificamerican.com/expeditions/tag/following-the-ice/), and in a short video with Andrew Tedstone of the University of Edinburgh (http://www.whoi.edu/page.do?pid=80757&cl=82073&tid=5122). Ben comments that air temperatures in camp are substantially warmer than in 2011 and that glacial moraine deposited by Leverett glacial hundreds of years ago (possibly during the Little Ice Age) was being eroded by Leverett river – likely for the first time in decades. Dave Chandler, a University of Bristol researcher, camped within the ice sheet interior, 40km from the margin, has also been surprised by the warm temperatures. During the 2011 melt season he found that the temperature on the ice very rarely exceeded freezing at night. In contrast, the temperature has stayed above freezing throughout most of June and July at a similar point on the ice this year. Higher temperatures and the lack of freezing conditions on the ice sheet interior mean that more glacial ice has melted on the surface. This water is then thought to be routed to the bed through conduits know as moulins. At the bed the meltwater joins a large subglacial channel that flows under the ice and exits the glacier via a portal such as that which exists on Leverett glacier. The discharge of these subglacial rivers is thus indicative of the amount of ice melt.