Arctic is warming nearly four times faster than the rest of the world – new research

New research estimates that the Arctic may be warming four times faster than the rest of the world.
Netta Arobas/Shutterstock

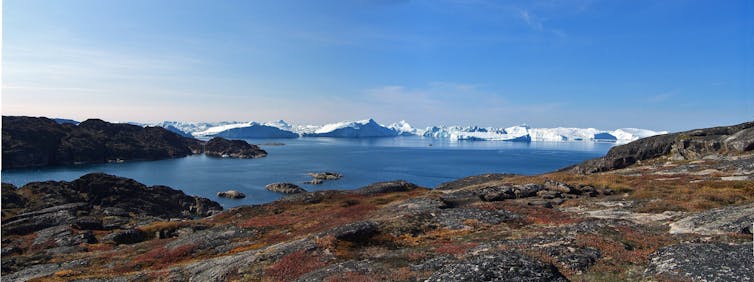
The Earth is approximately 1.1℃ warmer than it was at the start of the industrial revolution. That warming has not been uniform, with some regions warming at a far greater pace. One such region is the Arctic.

A new study shows that the Arctic has warmed nearly four times faster than the rest of the world over the past 43 years. This means the Arctic is on average around 3℃ warmer than it was in 1980.

This is alarming, because the Arctic contains sensitive and delicately balanced climate components that, if pushed too hard, will respond with global consequences.

Why is the Arctic warming so much faster?

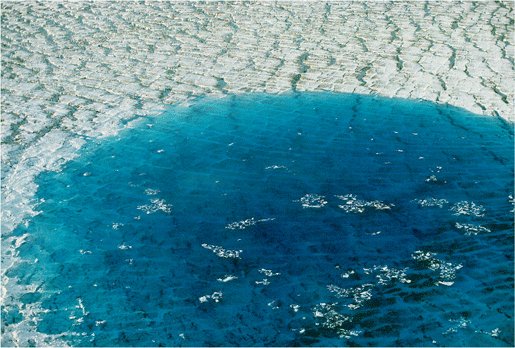
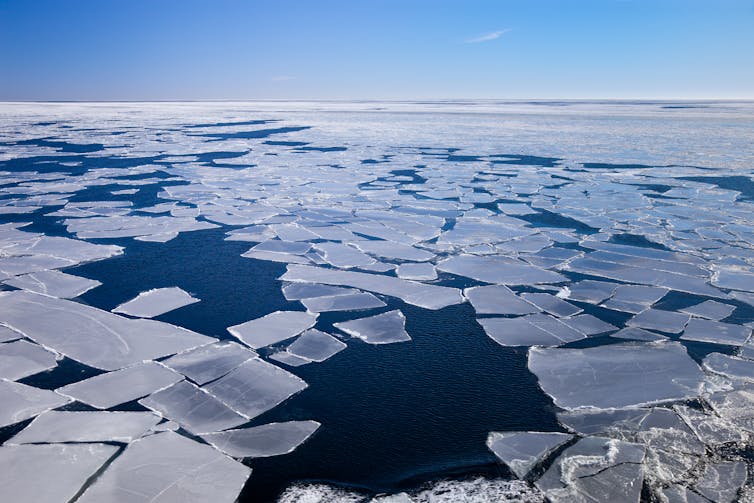
A large part of the explanation relates to sea ice. This is a thin layer (typically one metre to five metres thick) of sea water that freezes in winter and partially melts in the summer.

The sea ice is covered in a bright layer of snow which reflects around 85% of incoming solar radiation back out to space. The opposite occurs in the open ocean. As the darkest natural surface on the planet, the ocean absorbs 90% of solar radiation.

When covered with sea ice, the Arctic Ocean acts like a large reflective blanket, reducing the absorption of solar radiation. As the sea ice melts, absorption rates increase, resulting in a positive feedback loop where the rapid pace of ocean warming further amplifies sea ice melt, contributing to even faster ocean warming.

This feedback loop is largely responsible for what is known as Arctic amplification, and is the explanation for why the Arctic is warming so much more than the rest of the planet.

Blocks of melting sea ice revealing a deep blue sea.
Melting sea ice in the Arctic Ocean.
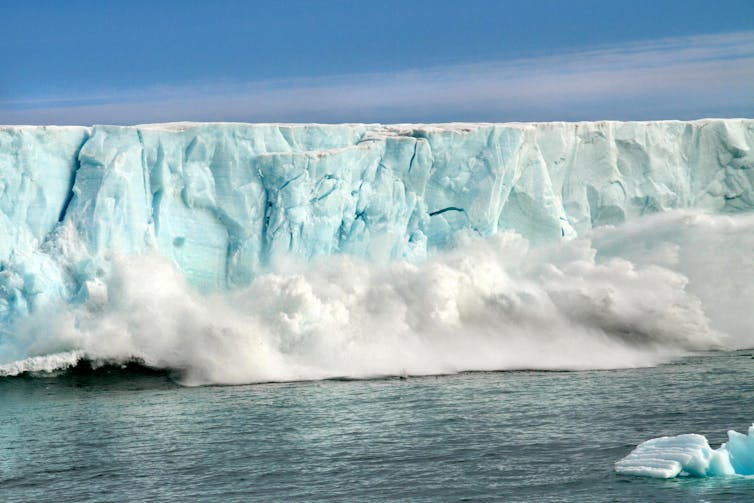
Nightman1965/Shutterstock

Is Arctic amplification underestimated?

Numerical climate models have been used to quantify the magnitude of Arctic amplification. They typically estimate the amplification ratio to be about 2.5, meaning the Arctic is warming 2.5 times faster than the global average. Based on the observational record of surface temperatures over the last 43 years, the new study estimates the Arctic amplification rate to be about four.

Rarely do the climate models obtain values as high that. This suggests the models may not fully capture the complete feedback loops responsible for Arctic amplification and may, as a consequence, underestimate future Arctic warming and the potential consequences that accompany that.

How concerned should we be?

Besides sea ice, the Arctic contains other climate components that are extremely sensitive to warming. If pushed too hard, they will also have global consequences.

One of those elements is permafrost, a (now not so) permanently frozen layer of the Earth’s surface. As temperatures rise across the Arctic, the active layer, the topmost layer of soil that thaws each summer, deepens. This, in turn, increases biological activity in the active layer resulting in the release of carbon into the atmosphere.

Arctic permafrost contains enough carbon to raise global mean temperatures by more than 3℃. Should permafrost thawing accelerate, there is the potential for a runaway positive feedback process, often referred to as the permafrost carbon time bomb. The release of previously stored carbon dioxide and methane will contribute to further Arctic warming, subsequently accelerating future permafrost thaw.

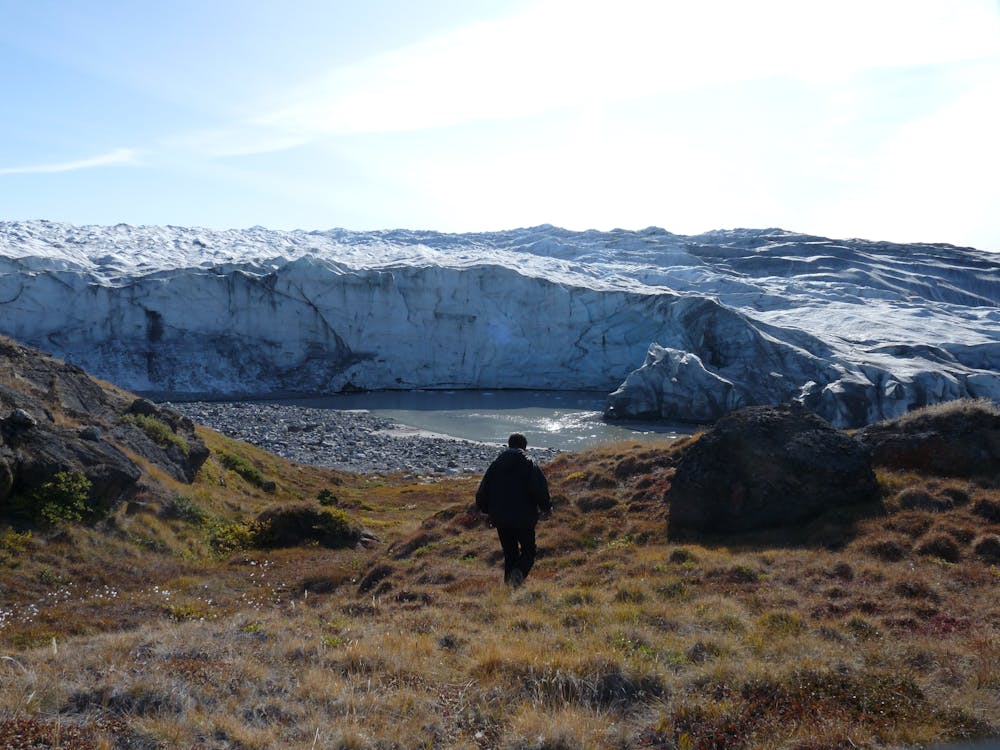
A second Arctic component vulnerable to temperature rise is the Greenland ice sheet. As the largest ice mass in the northern hemisphere, it contains enough frozen ice to raise global sea levels by 7.4 metres if melted completely.

A man and woman standing on the edge of a flooded coastal road.
The Greenland ice sheet contains enough frozen ice to raise global sea levels by 7.4 metres if completely melted.
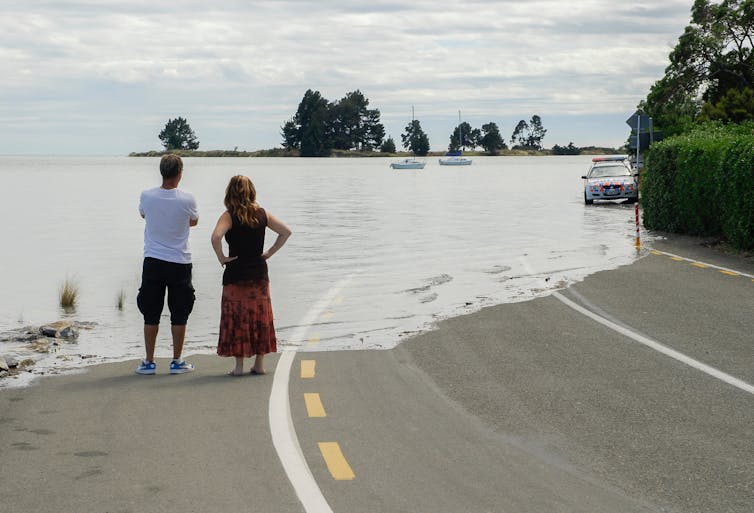
MainlanderNZ/Shutterstock

When the amount of melting at the surface of an ice cap exceeds the rate of winter snow accumulation, it will lose mass faster than it gains any. When this threshold is exceeded, its surface lowers. This will quicken the pace of melting, because temperatures are higher at lower elevations.

This feedback loop is often called the small ice cap instability. Prior research puts the required temperature rise around Greenland for this threshold to be be passed at around 4.5℃ above pre-industrial levels. Given the exceptional pace of Arctic warming, passing this critical threshold is rapidly becoming likely.

Although there are some regional differences in the magnitude of Arctic amplification, the observed pace of Arctic warming is far higher than the models implied. This brings us perilously close to key climate thresholds that if passed will have global consequences. As anyone who works on these problems knows, what happens in the Arctic doesn’t stay in the Arctic.The Conversation

——————————

This blog is written by Cabot Institute for the Environment member, Jonathan Bamber, Professor of Physical Geography, University of Bristol.

This article is republished from The Conversation under a Creative Commons license. Read the original article.

Greenland is melting: we need to worry about what’s happening on the largest island in the world

Jonathan Bamber, Author provided

Greenland is the largest island in the world and on it rests the largest ice mass in the Northern Hemisphere. If all that ice melted, the sea would rise by more than 7 metres.

But that’s not going to happen is it? Well not any time soon, but understanding how much of the ice sheet might melt over the coming century is a critical and urgent question that scientists are trying to tackle using sophisticated numerical models of how the ice sheet interacts with the rest of the climate system. The problem is that the models aren’t that good at reproducing recent observations and are limited by our poor knowledge of the detailed topography of the subglacial terrain and fjords, which the ice flows over and in to.

One way around this problem is to see how the ice sheet responded to changes in climate in the past and compare that with model projections for the future for similar changes in temperature. That is exactly what colleagues and I did in a new study now published in the journal Nature Communications.

We looked at the three largest glaciers in Greenland and used historical aerial photographs combined with measurements scientists had taken directly over the years, to reconstruct how the volume of these glaciers had changed over the period 1880 to 2012. The approach is founded on the idea that the past can help inform the future, not just in science but in all aspects of life. But just like other “classes” of history, the climate and the Earth system in future won’t be a carbon copy of the past. Nonetheless, if we figure out exactly how sensitive the ice sheet has been to temperature changes over the past century, that can provide a useful guide to how it will respond over the next century.

A man walks over grassy land with glacier in background
Greenland’s glaciers contain around 8% of the world’s fresh water.
Jonathan Bamber, Author provided

We found that the three largest glaciers were responsible for 8.1mm of sea level rise, about 15% of the whole ice sheet’s contribution. Over the period of our study the sea globally has risen by around 20cm, about the height of an A5 booklet, and of that, about a finger’s width is entirely thanks to ice melting from those three Greenland glaciers.

Melting As Usual

So what does that tell us about the future behaviour of the ice sheet? In 2013, a modelling study by Faezeh Nick and colleagues also looked at the same “big three” glaciers (Jakobshavn Isbrae in the west of the island and Helheim and Kangerlussuaq in the east) and projected how they would respond in different future climate scenarios. The most extreme of these scenarios is called RCP8.5 and assumes that economic growth will continue unabated through the 21st century, resulting in a global mean warming of about 3.7˚C above today’s temperatures (about 4.8˚C above pre-industrial or since 1850).

This scenario has sometimes been referred to as Business As Usual (BAU) and there is an active debate among climate researchers regarding how plausible RCP8.5 is. It’s interesting to note, however, that, according to a recent study from a group of US scientists it may be the most appropriate scenario up to at least 2050. Because of something called polar amplification the Arctic will likely heat up by more than double the global average, with the climate models indicating around 8.3˚C warming over Greenland in the most extreme scenario, RCP8.5.

Despite this dramatic and terrifying hike in temperature Faezeh’s modelling study projected that the “big three” would contribute between 9 and 15 mm to sea level rise by 2100, only slightly more than what we obtained from a 1.5˚C warming over the 20th century. How can that be? Our conclusion is that the models are at fault, even including the latest and most sophisticated available which are being used to assess how the whole ice sheet will respond to the next century of climate change. These models appear to have a relatively weak link between climate change and ice melt, when our results suggest it is much stronger. Projections based on these models are therefore likely to under-predict how much the ice sheet will be affected. Other lines of evidence support this conclusion.

What does all of that mean? If we do continue along that very scary RCP8.5 trajectory of increasing greenhouse gas emissions, the Greenland ice sheet is very likely to start melting at rates that we haven’t seen for at least 130,000 years, with dire consequences for sea level and the many millions of people who live in low lying coastal zones.The Conversation

————————–

This blog is written by Cabot Institute member Jonathan Bamber, Professor of Physical Geography, University of BristolThis article is republished from The Conversation under a Creative Commons license. Read the original article.

Professor Jonathan Bamber


The controversy of the Greenland ice sheet

I was expecting a dusty road, a saloon door swinging, two geologists standing facing each other in spurrs and cowboy hats with their hands twitching at their sides, both ready to whip out their data and take down their opponent with one well-argued conclusion.

Sadly (for me), things were much more friendly at Professor Pete Nienow‘s seminar in Bristol’s Geographical Sciences department last week. Twelve years ago he visited the University with a controversial hypothesis, causing considerable debate with members of the department. Now he was back, Powerpoint at the ready, to revisit the theory.

Professor Nienow is a glaciologist at the University of Edinburgh. He is currently researching glacial movement and mass in Greenland, but I’ll let him tell you more.


Pete Nienow – GeoScience from Research in a Nutshell on Vimeo.

The Greenland ice sheet covers almost 80% of the country, enclosed by mountains around its edges. The ice sheet is dynamic; glaciers are constantly moving down from the summit towards the sea but replaced each winter by snow. Glaciers are funnelled through the mountains in large “outlet glaciers” that either melt or break into icebergs when they reach the sea.

There is plenty of evidence to suggest that the outlet glaciers are speeding up, rushing down to meet the sea almost twice as fast as they did in the 1970s. Unfortunately that means more melting icebergs floating around, contributing to sea level rise. The winter snowfall is not able to replenish this increased loss of glacial mass, so the Greenland ice sheet is slowly shrinking.

Coverage of the Greenland ice sheet in different future climate change scenarios. A critical tipping
point could be reached, after which it will be impossible to stop the ice from melting and raising sea
levels by seven metres globally.  Source: Alley et al., 2005 (Science)

Controversy

Professor Nienow stirred up a debate in 2002, when he proposed that the Zwally Effect could be hugely important for the Greenland ice sheet. This theory suggests that meltwater could seep down through the glacier to the bedrock, lubricating and speeding up the glacial movement.

The conventional wisdom of the time was that it would be impossible for meltwater to pass through the 2km of solid ice that comprises most of the Greenland ice sheet. The centre of the glacier is around -15 to -20°C, so the just-above-freezing water would never be able to melt its way through.

Meltwater research

Meltwater on glaciers often pools on the surface, creating supraglacial lakes. These lakes can drain slowly over the surface, but Professor Nienow found that they can disappear rapidly too. The water slips down through cracks in the ice to the bedrock, leading to a rapid spike in the amount of meltwater leaving the glacier.

Supraglacial lake.
Source: United States Geological Survey, Wikimedia Commons

Meltwater can reach the base of the glacier so that’s one point to Nienow, but can this actually affect the movement of the glacier?

During the summer, the higher temperatures lead to increased glacial melting, which drains down to the bedrock. This raises the water pressure under the glacier, forcing it to slide more rapidly.  Interestingly, as the season progresses, Nienow found that the meltwater forms more efficient drainage channels beneath the glacier, stabilising the speed of the ice.

Nienow was almost ready to mosey on back to Bristol, show them how subglacial meltwater had clear implications of glacier loss for a warmer world, and declare himself the Last Geologist Standing.

Turning point

Glaciologists had always assumed that the winter glacier velocity was consistently low. However, at the end of a very warm 2010, Nienow and his colleagues discovered a blip of especially low speeds, even slower than the standard winter “constant”.

The large channels underneath the glaciers formed by the extra meltwater of that hot year actually reduced the subglacial water pressure during the winter, slowing the glacier more than on a normal year. Nienow found that this winter variability is critical for overall glacier velocity and displacement. In 2010, the net effect of both summer and winter actually meant that the glacier velocity was reduced in this hot year.

Back to Bristol

Nienow returned to Bristol to give his seminar. Somewhat unlike a cowboy film, Nienow concluded that it was a draw; he’d been right that it was possible for meltwater to seep down to the bedrock and lubricate glacial movement, but his friends at Bristol had been correct in thinking that it wasn’t very important in the grand scheme of things.

A collaborative paper between Professor Nienow, the Bristol team and other glaciologists from around the world found that subglacial meltwater will only have a minor impact on sea level rise, contributing less than 1cm of water globally by 2200.  Surface run off and the production of icebergs will continue to play a bigger role, even in a warming world. The computer models used to predict sea level rise will be able to include these findings to give a more accurate insight into future glacier movement and coverage across Greenland and beyond.

Bristol glaciologist Dr. Sarah Shannon, lead author on the paper, pointed out that whilst overall glacier velocity is unlikely to be affected by subglacial meltwater in warm years, “global warming will still contribute to sea level rise by increasing surface melting which will run directly into the ocean”.

This blog is written by Sarah Jose, Cabot Institute, Biological Sciences, University of Bristol
You can follow Sarah on Twitter @JoseSci

Sarah Jose