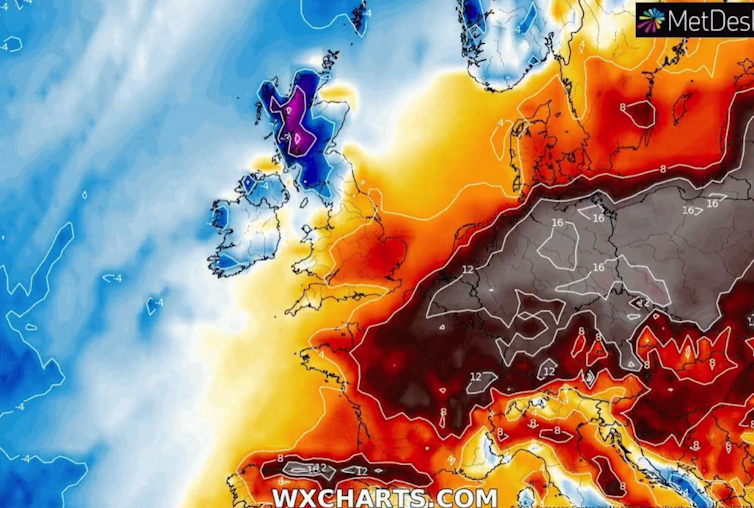
Four ways winter heatwaves affect humans and nature

Temperature anomaly in Europe, Jan 1. Much of the continent was 10°C or more (dark red and grey) above the long-term average.
WX Charts, CC BY-NC

An extreme winter heatwave meant countries across Europe experienced a record-breaking New Year’s Day. New daily temperature records for the month of January were set in at least eight countries: Belarus, Czechia, Denmark, Latvia, Liechtenstein, Lithuania, Netherlands and Poland.

In many cases the temperatures were not just breaking the old highs, but smashing them by massive margins. On a typical January day in Warsaw, Poland, temperatures would barely go above freezing, yet the city recently experienced 19℃, breaking the previous January high by 5.1℃.

New January records were set at thousands of individual stations in many other countries such as 25.1℃ at Bilbao airport in Spain, 0.7℃ hotter than the previous record set only last year. Large areas of central and Eastern Europe experienced temperatures 10℃ to 15℃ warmer than average for this time of year – and that has persisted through the week.

When Europe experienced extreme heat in July of last year, more than 20,000 died. Fortunately winter heatwaves are much less deadly, but they can still affect both human society and natural ecosystems in many ways.

1. Less energy is needed

In Europe deaths due to cold weather vastly outweigh those caused by extreme high temperatures – in the UK there are ten times more. Warmer winters will reduce this excess mortality and, with the current cost-of-living crisis, many will have been relieved that a heatwave meant less energy was needed to heat their homes.

Electricity demand is influenced by things like the time of day, the day of the week and socio-economic factors like the COVID pandemic or the war in Ukraine. The weather also makes a difference. For example, in Poland and the Netherlands demand was noticeably lower than average, especially since January 1 was a Sunday. The extent of the heatwave also meant countries could refill some of their winter gas reserves, or large batteries.

Energy consumption in Poland December 28 to January 5. The red line shows the 2022-2023 heatwave period, and the grey lines show available data from 2015-2022.
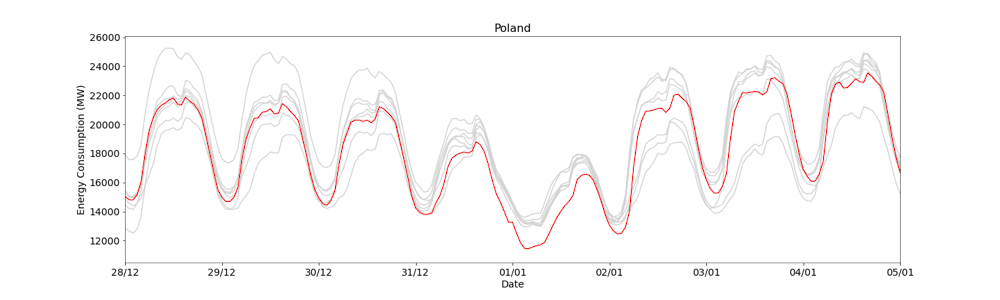
Hannah Bloomfield / data: transparency.entsoe.eu, Author provided

2. Reduced yields for some crops

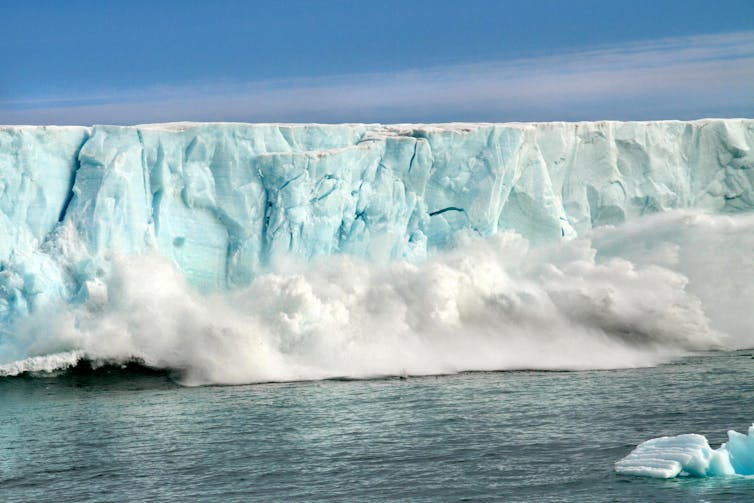
Winter warm spells don’t always have such a positive impact though. For instance a lack of snow in the mountains affects agriculture and can reduce crop yield, since snow creates an insulating blanket that prevents frost from penetrating into the soil. This means snow can actually increase soil moisture more than rainfall, thus improving growing conditions later in the season.

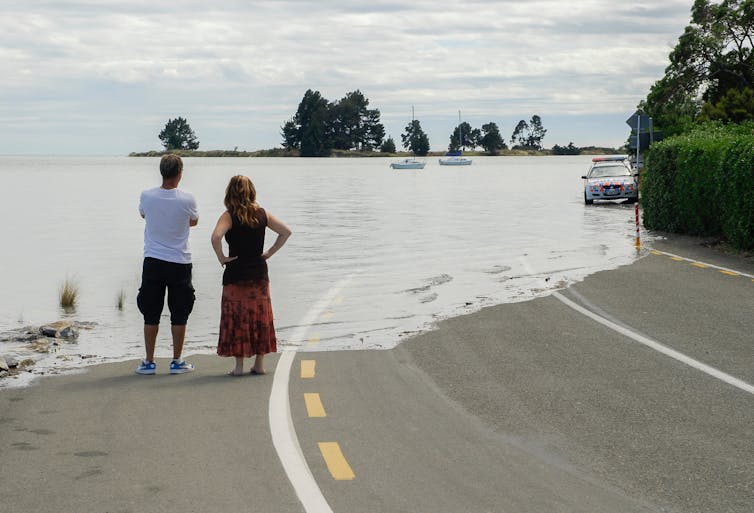
The big snow melt in spring time replenishes reservoirs and allows hydroelectricity generation, but unexpected snow melt can lead to flooding. Changes to the timings of these events will require preparation and adaptation to enable a steady supply of water to where we need it.

Warmer temperatures will create longer growing seasons in many regions. This is not always the case though. A recent study showed that for alpine grasslands an earlier growing season (the point when snow has melted entirely) leads to ageing and browning of the grasses in the later part of the summer.

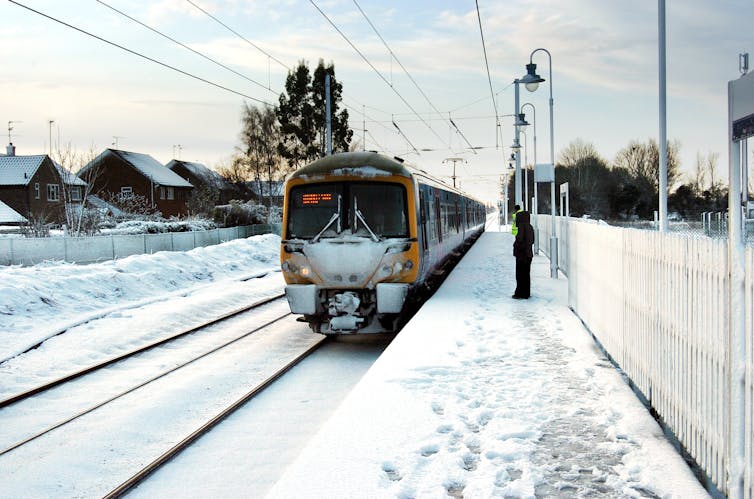
3. The snow economy is in trouble

The heatwave caused ski resorts across the Alps to close in what should be their busiest time of year. In January the slopes would be expected to have a good covering of snow – but instead we saw green grassy fields.

This hits the local economy where many people rely on winter sports tourism. Events such as the Adelboden alpine ski World Cup are relying on artificial snow, which comes with a further environmental cost increasing the carbon footprint of ski resorts and requiring a large water supply. Indeed, the Beijing winter Olympics used the equivalent of daily drinking water for 900 million people to generate the artificial snow it required.

4. Animals out of sync with the climate

We humans are perhaps fortunate, as we are able to adapt. Some ski resorts have already opened mountain bike trails in winter to offer alternative tourism, but wildlife and ecosystems cannot adjust so rapidly.

In the mountains many species, such as ptarmigan and mountain hares, change their colouring for winter to camouflage in the white snow. The timing of this change is determined by length of day – not the temperature or amount of snow. These creatures are at greater risk of being preyed on when it is warmer.

White rabbit, brown background
Mountain hares are dressed for a climate that has changed.
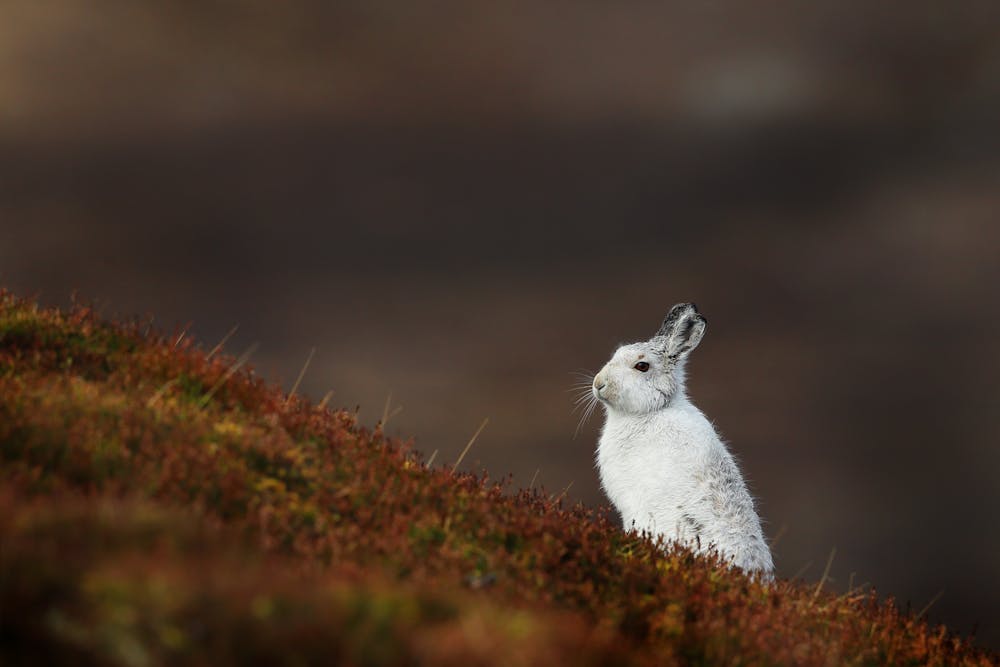
Mark Medcalf / shutterstock

Over the past century heat extremes in Europe have increased in intensity and frequency. Both the general warming and heatwave events have been firmly attributed to humans.

Future projections suggest these trends will continue and heatwaves in both summer and winter will get hotter, last longer, and occur more often. We need to learn to adapt for these changes in all seasons and think about the impacts on everyone – and everything – on our planet.The Conversation

—————————-

This blog is written by Cabot Institute for the Environment members Dr Vikki Thompson, Senior Research Associate in Geographical Sciences, University of Bristol and Dr Hannah Bloomfield, Postdoctoral Researcher in Climate Risk Analytics, University of BristolThis article is republished from The Conversation under a Creative Commons license. Read the original article.

Arctic is warming nearly four times faster than the rest of the world – new research

New research estimates that the Arctic may be warming four times faster than the rest of the world.
Netta Arobas/Shutterstock

The Earth is approximately 1.1℃ warmer than it was at the start of the industrial revolution. That warming has not been uniform, with some regions warming at a far greater pace. One such region is the Arctic.

A new study shows that the Arctic has warmed nearly four times faster than the rest of the world over the past 43 years. This means the Arctic is on average around 3℃ warmer than it was in 1980.

This is alarming, because the Arctic contains sensitive and delicately balanced climate components that, if pushed too hard, will respond with global consequences.

Why is the Arctic warming so much faster?

A large part of the explanation relates to sea ice. This is a thin layer (typically one metre to five metres thick) of sea water that freezes in winter and partially melts in the summer.

The sea ice is covered in a bright layer of snow which reflects around 85% of incoming solar radiation back out to space. The opposite occurs in the open ocean. As the darkest natural surface on the planet, the ocean absorbs 90% of solar radiation.

When covered with sea ice, the Arctic Ocean acts like a large reflective blanket, reducing the absorption of solar radiation. As the sea ice melts, absorption rates increase, resulting in a positive feedback loop where the rapid pace of ocean warming further amplifies sea ice melt, contributing to even faster ocean warming.

This feedback loop is largely responsible for what is known as Arctic amplification, and is the explanation for why the Arctic is warming so much more than the rest of the planet.

Blocks of melting sea ice revealing a deep blue sea.
Melting sea ice in the Arctic Ocean.
Nightman1965/Shutterstock

Is Arctic amplification underestimated?

Numerical climate models have been used to quantify the magnitude of Arctic amplification. They typically estimate the amplification ratio to be about 2.5, meaning the Arctic is warming 2.5 times faster than the global average. Based on the observational record of surface temperatures over the last 43 years, the new study estimates the Arctic amplification rate to be about four.

Rarely do the climate models obtain values as high that. This suggests the models may not fully capture the complete feedback loops responsible for Arctic amplification and may, as a consequence, underestimate future Arctic warming and the potential consequences that accompany that.

How concerned should we be?

Besides sea ice, the Arctic contains other climate components that are extremely sensitive to warming. If pushed too hard, they will also have global consequences.

One of those elements is permafrost, a (now not so) permanently frozen layer of the Earth’s surface. As temperatures rise across the Arctic, the active layer, the topmost layer of soil that thaws each summer, deepens. This, in turn, increases biological activity in the active layer resulting in the release of carbon into the atmosphere.

Arctic permafrost contains enough carbon to raise global mean temperatures by more than 3℃. Should permafrost thawing accelerate, there is the potential for a runaway positive feedback process, often referred to as the permafrost carbon time bomb. The release of previously stored carbon dioxide and methane will contribute to further Arctic warming, subsequently accelerating future permafrost thaw.

A second Arctic component vulnerable to temperature rise is the Greenland ice sheet. As the largest ice mass in the northern hemisphere, it contains enough frozen ice to raise global sea levels by 7.4 metres if melted completely.

A man and woman standing on the edge of a flooded coastal road.
The Greenland ice sheet contains enough frozen ice to raise global sea levels by 7.4 metres if completely melted.
MainlanderNZ/Shutterstock

When the amount of melting at the surface of an ice cap exceeds the rate of winter snow accumulation, it will lose mass faster than it gains any. When this threshold is exceeded, its surface lowers. This will quicken the pace of melting, because temperatures are higher at lower elevations.

This feedback loop is often called the small ice cap instability. Prior research puts the required temperature rise around Greenland for this threshold to be be passed at around 4.5℃ above pre-industrial levels. Given the exceptional pace of Arctic warming, passing this critical threshold is rapidly becoming likely.

Although there are some regional differences in the magnitude of Arctic amplification, the observed pace of Arctic warming is far higher than the models implied. This brings us perilously close to key climate thresholds that if passed will have global consequences. As anyone who works on these problems knows, what happens in the Arctic doesn’t stay in the Arctic.The Conversation

——————————

This blog is written by Cabot Institute for the Environment member, Jonathan Bamber, Professor of Physical Geography, University of Bristol.

This article is republished from The Conversation under a Creative Commons license. Read the original article.

Beast from the East 2? What ‘sudden stratospheric warming’ involves and why it can cause freezing surface weather


Darryl Fonseka / shutterstock

A “sudden stratospheric warming” event took place in early January 2021, according to the Met Office, the UK’s national weather service. These events are some of the most extreme of atmospheric phenomena, and I study them as part of my academic research. The stratosphere is the layer of the atmosphere from around 10km to 50km above the Earth’s surface, and sudden warming up there can lead to very cold weather over Europe and Siberia, with an increased possibility of snow storms.


In winter the polar regions are in darkness 24 hours a day, and so the stratosphere over the north pole drops to -60℃ or even lower. The pole is surrounded by strong westerly winds, forming what is known as the polar vortex, a normal occurrence which develops every winter. However, about six times a decade, this vortex can break down in dramatic fashion. This can lead to temperatures over the pole increasing by up to 50°C over a few days, although temperatures are so low that they still remain below freezing. The average wind direction around the pole may also reverse, in which case a “sudden stratospheric warming” event has occurred.

The disturbance in the stratosphere can then be transmitted downward through the atmosphere. If this disturbance reaches the lower levels of the atmosphere it can affect the jet stream, a current of air which normally snakes eastwards around the planet, dividing colder polar air from warmer air to the south.

Where the jet stream crosses the Atlantic it usually points towards the British Isles, but sudden stratospheric warming can lead it to shift towards the equator. As air currents are temporarily rearranged, warmer Atlantic air is replaced by cold air from Siberia or the Arctic, and Europe and Northern Asia may experience unusually cold weather. This is what happened when the infamous “Beast from the East” passed through Europe in 2018, causing huge snowstorms and dozens of deaths.

It can take a number of weeks for the impact of stratospheric warming to reach the surface, or the process may only take a few days. These events are hard to predict in advance. Some can only be predicted a few days ahead while others may be forecast from around two weeks before.

A number of factors including a La Niña event in the tropical Pacific contributed to a strong vortex in early winter 2020/21. Strong vortices are hard to shift, meaning a sudden stratospheric warming event was not looking particularly likely. However, from just before Christmas, weather forecast model predictions began to converge on a likely stratospheric warming event in early January.

From stratosphere to surface

Around two thirds of stratospheric warming events have a detectable surface impact, up to 40 days after the onset of the event. This is usually marked by lower than normal temperatures across Northern Europe and Asia, extending into western Europe, but with warmer temperatures over the eastern Canadian Arctic.

It’s not yet clear why some stratospheric warming events take weeks to impact the surface while others are felt days later, but it may be related to how the polar vortex changes around the onset of a warming event. The vortex can split into two smaller “child vortices”, or it can be displaced from its more usual position centred near the pole, to being over northern Siberia.

Early indications suggested that 2021’s event was more likely to be split, but it subsequently showed more features of a displacement. It is not unusual for the vortex to show such mixed signals.

Colleagues and I recently developed a new method for tracking the impact of a warming event from its onset in the stratosphere to when its effect reaches the surface. We analysed 40 such events from the past 60 years, to try and figure out when we might expect extreme surface weather.

Most importantly, we found that warming events in which the stratospheric polar vortex splits in two generally lead to surface impacts appearing faster and stronger. So although there is an increased chance of snow and extreme cold in mid to late January 2021, other confounding factors may act to reduce this impact.

There are always competing forces at work in the atmosphere. Few people noticed the sudden stratospheric warming of January 2019 for example, which had little impact on the European winter. In that instance, there was a westerly influence on the North Atlantic winds, which originated in the tropics. This may have acted to oppose any stratospheric effect favouring easterly winds. In 2021, the battle is between the stratospheric warming and La Niña.

Sudden stratospheric warming events are a natural atmospheric fluctuation, not caused by climate change. So even with climate change, these events will still occur, which means that we need to be adaptable to an even more extreme range of temperatures.The Conversation

———————————

This blog is written by Cabot Institute member Dr Richard Hall, Research Associate, Climate Dynamics Group, University of BristolThis article is republished from The Conversation under a Creative Commons license. Read the original article.

Dr Richard Hall


Frozen Empires revisited

Image taken from the front cover of Adrian Howkin’s book – Frozen Empires

The recent release of the paperback edition of Frozen Empires: An Environmental History of the Antarctic Peninsula, offers an opportunity to revisit the arguments I made in this book and reflect on how it continues to shape my work in Antarctica and thinking about environmental history.  The book sets out to frame the mid-twentieth century Antarctic sovereignty dispute among Argentina, Britain, and Chile as an environmental history of decolonization.  Through a strategy I refer to as asserting ‘environmental authority’, Britain used the performance of scientific research and the production of useful knowledge to support its imperial claims to the region as a territory known as the ‘Falkland Islands Dependencies’.  Argentina and Chile both contested Britain’s claim, and put forward their own assertations to sovereignty based on a sense that this was their environment as a result of proximity, geological contiguity, and shared climate and ecosystems. In the contest between British assertions of environmental authority and Argentine and Chilean ‘environmental nationalism’ it was the imperial, scientific vision of the environment that largely won out.  There was no genuine decolonization of the Antarctic Peninsula region, or the Antarctic continent more generally.  Instead, the 1959 Antarctic Treaty, which remains in force today, retains pre-existing sovereignty claims in a state of suspended animation (‘frozen’ in the pun of the treaty negotiators) and perpetuates the close connection between science and politics across the Antarctic Continent.

Much of my work since researching and writing Frozen Empires has focused on the history of the McMurdo Dry Valleys on the opposite side of the Antarctic continent.  I am a co-PI on a US National Science Foundation funded Long Term Ecological Research (LTER) project, collaborating with scientists to ask how historical research might inform our understanding of this unique place.  The McMurdo Dry Valleys are the largest predominantly ice-free region of Antarctica and since the late 1950s have become an important site of Antarctic science.  Geologists are attracted to the Dry Valleys by the exposed rock, geomorphologists by the opportunity to study the glaciological history of the continent, and ecologists by the presence of microscopic ecosystems.  The close connection between politics and science that I identified in the Antarctic Peninsula is also applicable to the history of the McMurdo Dry Valleys.  The two most active countries in the region, New Zealand and the United States, can both be seen as making assertions of environmental authority to support their political position.  A major difference is that now I find myself on the inside of this system, working with scientists to help produce the ‘useful information’ that is being used for political purposes.

Working as more of an insider in a system I critiqued in Frozen Empires raises a number of awkward questions.  Can I retain a critical distance?  Am I contributing to the perpetuation of an unequal system?  What might the decolonization of Antarctic research look like?  These questions are not easy to answer.  Not infrequently I find myself looking back on the lack of inhibition I felt while researching and writing Frozen Empires and wishing for something similar in my current research.  Academic collaboration by definition leads to entanglements, and these entanglements increase complexity.  It is much easier, for example, to write critically about the imperial history of Antarctica than to convince scientific colleagues that this imperial history continues to have an impact on contemporary scientific research.

But for all the messiness and difficulties involved in collaboration, there are also tremendous opportunities.  I have learned a lot about how science gets done through working with the McMurdo Dry Valleys LTER site, and I have learned about working as part of an academic team.  Place-based studies offers an ideal opportunity for interdisciplinary research, and I think it is vital to have humanities perspectives represented in these collaborations.  It takes time – often more time than expected – for effective collaborations to develop, and this process involves a significant degree of mutual learning.  Researching and writing Frozen Empires fundamentally shaped what I bring to the table as an environmental historian in the McMurdo Dry Valleys project, and I remain convinced by its argument for imperial continuity.  But the process of engaging in collaborative research has unsettled at least some of my earlier positions, and the book I’m writing on the history of the McMurdo Dry Valleys will likely be quite different to Frozen Empires.

—————————————-

This blog is written by Cabot Institute member Dr Adrian Howkins, Reader in Environmental History, University of Bristol.

It has been reposted with kind permission from the Bristol Centre for Environmental Humanities. View the original blog.

Why snow days are becoming increasingly rare in the UK

A snowy start to the day at Watlington station, King’s Lynn. December 18 2009.
Lewis Collard/Wikipedia

Winter frost fairs were common on the frozen River Thames between the 17th and 19th centuries, but they’ve become unimaginable in our lifetime. Over decades and centuries, natural variability in the climate has plunged the UK into sub-zero temperatures from time to time. But global warming is tipping the odds away from the weather we once knew.

These days, people in the UK have become accustomed to much warmer, wetter winters. In fact, winter is warming faster than any other season. This is bad news for those holding out for a white Christmas – the Met Office reports that only four Christmases in over five decades recorded snow at more than 40% of UK weather stations.

Painting of people, tents and horse-drawn carriages on the frozen river.
A frost fair on the River Thames, painted by Thomas Wyke (1683-1684).
Thomas Wyke/Wikipedia

Christmas is a magical day for many, but meteorologically, it’s no different from other winter periods, when snow and ice are also becoming less common. The Met Office definition of a snow day at a given location in the UK is when snow lies on at least 50% of the ground at 9am. Currently, the Cairngorms around Aviemore receive over 70 snow-lying days per year – the most in the UK.

This amount is smaller than in previous decades though. Met Office data shows that, since 1979, the number of snow-lying days has generally decreased by up to five days per decade, and up to ten days per decade in the North Pennines, near Penrith. Around a fifth of the total area of the UK has experienced a significant drop in the prevalence of days with snow lying on the ground.

Two maps of the UK depicting the change in prevalence of snow days throughout the UK from 1971-2019.
Snow days are a rarer occasion in the UK today than they were five decades ago.
Met Office, Author provided

What causes snow days?

Snow days are often the result of a meandering jet stream, the fast-flowing current of air that’s between 9km and 16km above the Earth’s surface. The jet stream normally transports temperate weather from the Atlantic across the UK, but if it’s displaced southwards, it allows persistent high pressure systems of colder air from the north and east, originating in the Arctic or over the Eurasian continent, known as blocking high pressures, to settle over the UK for extended periods.

A number of atmospheric processes can cause the jet stream to meander, but perhaps the most dramatic is when the stratospheric polar vortex, a huge rotating air mass in the middle atmosphere, breaks down. This disruption causes the jet stream to weaken, leading to events such as the infamous 2018 Beast from the East, which brought widespread snowfall to the UK.

The winter of 2018 was not unique in this sense – 2009-2010 and 2013 both brought snowfall because of these dynamic “beasts”. So why is there still a decline in winter snow days in the UK?

The snows of yesteryear

There’s no strong evidence for a long-term trend in polar vortex disruptions, or other atmospheric processes that influence the jet stream. So the fact that people in the UK have fewer snow days to enjoy each year than they did in the past can’t be blamed on the invisible twists and turns above their heads.

But as the concentration of CO₂ in the atmosphere climbs, disruptions that do occur sit on top of increasing background temperatures, reducing the likelihood of the cold spells that bring widespread snowfall. Just as natural climate trends have lowered the severity of winters since the days of the frost fairs, man-made climate change will increasingly keep the UK’s average temperature above zero.

A heavy covering of snow can transform the country and our perception of it. Snow days, with the closures of schools and workplaces that they bring, evoke fond memories and bring out the child in many as hillslopes and parks become sledging highways. More tangibly, in Scotland, the snowsports industry is estimated to be worth over £30 million a year.

But wintry weather can be dangerous too. The cold affects our health, exacerbating heart and lung conditions and the spread of infectious diseases. In extreme cases, heavy snowfall can cause widespread livestock deaths, which happened in Northern Ireland in 2013. The inevitable disruption to travel and businesses can cause economic damage running into billions of pounds, with sectors like the construction industry halted entirely.

While the falling chances of a white Christmas might disappoint many, the current trajectory of less and less snow will at least come as a relief to some.The Conversation

————————-

This blog is written by Cabot Institute members Dr Alan Thomas Kennedy-Asser, Research Associate in Climate Science, University of Bristol; Dr Dann Mitchell, Met Office Co-Chair in Climate Hazards, University of Bristol, and Dr Eunice Lo, Research Associate in Climate Science, University of Bristol.

This article is republished from The Conversation under a Creative Commons license. Read the original article.

Dann Mitchell
Alan Kennedy-Asser
Eunice Lo


Life on the ice: Fieldwork in Antarctica

From early November last year, I was lucky enough to spend over two months doing fieldwork on Pine Island Glacier, an ice stream in West Antarctica, which is currently the largest single contributor to sea level rise. I was part of a twelve person team that made up the second iSTAR traverse.

iSTAR is a collaborative scientific programme, funded by the Natural Environment Research Council (NERC) and co-ordinated by the British Antarctic Survey (BAS). It aims to improve our understanding of the stability of the West Antarctic Ice Sheet, which could potentially undergo rapid retreat in the coming centuries. It is divided into two halves – half the programme is ocean focused, looking at how relatively warm Circumpolar Deep Water intrusions onto the continental shelf interact with the ice shelves in the Amundsen Sea. The University of Bristol is involved in the second half of the programme, which is concerned with the ice sheet dynamics and mass balance, particularly the changes happening to Pine Island Glacier (PIG). In order to study these changes, two traverses of PIG have been made, over two consecutive seasons (2013-14 and 2014-15). The 800 km traverse, took in 22 sites across the ice stream and its tributaries, where various scientific techniques were used to determine the properties of the ice, glacier bed and firn layer (compacted snow).

During this season, despite some strong winds, we successfully completed all the science we set out to do, included seven seismic surveys, ten shallow ice cores, 22 neutron probe snow density profiles and ten phase-sensitive radar profiles. For me, as a PhD student, it was a great experience to work with senior scientists in the field, and to be involved in such a wide range of field techniques.

The scientific goals of the iSTAR traverse could not been achieved without the use of the traverse logistics, which involved using Pisten Bully snow tractors to tow the caboose (a converted container that acts as kitchen and living space), equipment and fuel from site to site. This is a new way of field operation for BAS and is likely to feature in many more scientific programmes in the future, given the success of the two iSTAR traverses. Of course, there are some old-school field scientists who joke that we are the Caravan Club of Antarctica, but I think they are just jealous – eating pancakes for breakfast in the caboose has to beat sitting in a pyramid tent eating rehydrated rations!

On the move! Image credit: Isabel Nias
Despite the perhaps more luxurious living conditions than the average field party, living in the deep field on the ice was not without its challenges. We were still sleeping in tents and my standard answer to the question, “but how did you wash?” has been, “I didn’t”. At the beginning of the field season we had temperatures as cold as -35°C (plus wind chill), which froze your breath inside your nostrils. However, I preferred the cold to the “warm” temperatures we had towards the end of the field season (it hit 0°C at one point!), which made our boots and gloves all damp. The work was also physically hard. Each seismic survey was 7 km long, and involved a team of us drilling 30 hot water drill holes, which were then loaded with explosives, and digging over 700 holes to place the geophone sensors in the snow. Although it was worth it for the end product: an idea of the type of bedrock PIG is flowing over.

Before I arrived, I had heard from Steph Cornford, who was on the first iSTAR traverse, that the weather had been exceptionally pleasant last year, with plenty of blue skies and low winds. So much so that they ate their Christmas dinner outside! This year, the weather was more like what you would expect from Antarctica – we certainly had our fair share of strong winds, which hindered progress at times, especially due to the sensitivity of the seismic work to wind speed. I got very good at estimating the wind speed based on how much my tent was shaking, or by looking at the Union Jack flying from the caboose!

Emma Smith and Alex Brisbourne (BAS) making their way to the
safety of the caboose on New Year’s Day. Image credit: Alex Taylor.
New Year on PIG was certainly one to remember. We spent the evening doing a pub quiz in the caboose and seeing in the New Year with a whisky and a poor rendition of Auld Lang Syne. By 1:30 am, however, the winds had picked up to 50 knots with gusts of up to 65 knots, creating extreme white out conditions from all the blowing snow. Many of us who were still up decided to sleep in the caboose that night. I’m glad I did because I doubt I would have slept at all in my tent (from the noise and the fear that the tent would be ripped from its pitch!). The strong winds persisted well into New Year’s Day, but we were able to assess the damage. Rather than blowing away, my tent was actually half buried by a huge drift. However, it could have been worse – James’ tent was destroyed and completely filled with snow! It took the whole of the next day to get camp cleared again – is “shovelling snow” a worthy thing to put on my CV?

Looking back, it is not working until 3 am to finish a seismic line that I remember. Rather, it is the people, as well as all the amazing experiences I had, which stick in my mind. It’s not every day that you co-pilot a plane across West Antarctica or bake a Christmas cake on 1800 m thick ice.

I would like to thank iSTAR, BAS and all the guys at the Rothera Research Station for such an awesome experience. The real work starts now – we have a lot of data to work on! Have a look on the iSTAR website for more blog posts written while we were in the field.
The second iSTAR traverse team at Christmas, complete with a ratchet strap Christmas tree. Image credit: Alex Taylor
——————————
Cabot Institute member Isabel Nias is a PhD student in the Bristol Glaciology Centre, School of Geographical Sciences at the University of Bristol.  Her PhD, which is funded through the NERC iSTAR programme, aims to use ice flow modelling to understand the sensitivity of the Amundsen Sea ice streams, and their potential impact on future sea level rise.
Isabel Nias