Sowing the seeds of collaborations to tackle African food insecurity

A group of early career researchers from 11 African countries got together in Bristol, UK, this month for a two-week training event. Nothing so unusual about that, you may think.

Yet this course, run by the Community Network for African Vector-Borne Plant Viruses (CONNECTED), broke important new ground.

The training brought together an unusual blend of researchers: plant virologists and entomologists studying insects which transmit plant diseases, as an important part of the CONNECTED project’s work to find new solutions to the devastation of many food crops in Sub-Saharan African countries.

The CONNECTED niche focus on vector-borne plant disease is the reason for bringing together insect and plant pathology experts, and plant breeders too. The event helped forge exciting new collaborations in the fight against African poverty, malnutrition and food insecurity.

‘V4’ – Virus Vector Vice Versa – was a fully-funded residential course which attracted great demand when it was advertised. Places were awarded by competitive application, with funding awarded to cover travel, accommodation, subsistence and all training costs. For every delegate who attended, five applicants were unsuccessful.

The comprehensive programme combined: scientific talks; general lab training skills; specific virology and entomology lecture and practical work; workshops; field visits, career development, mentoring, and desk-based projects.


Across the fortnight delegates received plenty of peer mentoring and team-building input, as well as an afternoon focused on ‘communicating your science.’


New
collaborations will influence African agriculture for years to come

There’s little doubt that the June event, hosted by The University of Bristol, base of CONNECTED Network Director Professor Gary Foster, has sown seeds of new alliances and partnerships that can have global impact on vector-borne plant disease in Sub-Saharan Africa for many years to come.
CONNECTED network membership has grown in its 18 months to a point where it’s approaching 1,000 researchers, from over 70 countries. The project, which derived its funding from the Global Challenges Research Fund, is actively looking at still more training events.
The V4 training course follows two successful calls for pump-prime research funding, leading to nine projects now operating in seven different countries, and still many more to come. Earlier in the year CONNECTED ran a successful virus diagnostics training event in Kenya, in close partnership with BecA-ILRI Hub. One result of that training was that its 19 delegates were set to share their new knowledge and expertise with a staggering 350 colleagues right across the continent.

Project background

Plant diseases significantly limit the ability of many of Sub-Saharan African countries to produce enough staple and cash crops such as cassava, sweet potato, maize and yam. Farmers face failing harvests and are often unable to feed their local communities as a result. The diseases ultimately hinder the countries’ economic and social development, sometimes leading to migration as communities look for better lives elsewhere.
The CONNECTED network project is funded by a £2 million grant from the UK government’s Global Challenges Research Fund, which supports research on global issues that affect developing countries. It is co-ordinated by Prof. Foster from the University of Bristol School of Biological Sciences, long recognised as world-leading in plant virology and vector-transmitted diseases, with Professor Neil Boonham, from Newcastle University its Co-Director. The funding is being used to build a sustainable network of scientists and researchers to address the challenges. The University of Bristol’s Cabot Institute, of which Prof. Foster is a member, also provides input and expertise.
———————-
This blog is written by Richard Wyatt, Communications Officer for the CONNECTED network.

Indoor air pollution: The ‘killer in the kitchen’

Image credit Clean Cooking Alliance.

Approximately 3 billion people around the world rely on biomass fuels such as wood, charcoal and animal dung which they burn on open fires and using inefficient stoves to meet their daily cooking needs.

Relying on these types of fuels and cooking technologies is a major contributor to indoor air pollution and has serious negative health impacts, including acute respiratory illnesses, pneumonia, strokes, cataracts, heart disease and cancer.

The World Health Organization estimates that indoor air pollution causes nearly 4 million premature deaths annually worldwide – more than the deaths caused by malaria and tuberculosis combined. This led the World Health Organization to label household air pollution “The Killer in the Kitchen”.

As illustrated on the map below, most deaths from indoor air pollution occur in low- and middle-income countries across Africa and Asia. Women and children are disproportionately exposed to the risks of indoor air pollution as they typically spend the most time cooking.

Number of deaths attributable to indoor air pollution in 2017. Image credit Our World in Data.
Replacing open fires and inefficient stoves with modern, cleaner solutions is essential to reduce indoor air pollution and personal exposure to emissions. However, research suggests that only significant reductions in exposure can tangibly reduce negative health impacts.
The Clean Cooking Alliance, established in 2010, has focused mainly on the dissemination of improved cookstoves (ICS) – wood-burning or charcoal stoves designed to be much more efficient than more traditional models – with some success.
Randomised control trials of sole use of ICS have shown reductions in pneumonia and the duration of respiratory infections in children. However, other studies, including some funded by the Alliance, have shown that ICS have not performed well enough in the field to sufficiently reduce indoor air pollution to lessen health risks such as pneumonia and heart disease.
Alternative fuels such as liquid petroleum gas (LPG), biogas and ethanol present other options for cooking with LPG already prevalent in many countries across the world.
LPG is clean-burning and produces much less carbon dioxide than burning biomass but is still a fossil fuel.
Biogas is a clean, renewable fuel made from organic waste, and ethanol is a clean biofuel made from a variety of feedstocks.
Image credit PEEDA

Electric cooking, once seen as a pipe dream for developing countries, is becoming more feasible and affordable due to improvements and reductions in costs of technologies like solar panels and batteries.

Improved cookstoves, alternative fuels and electric cooking have been gaining traction but there is still a long way to go to solving the deadly problem of indoor air pollution.
———————-
This blog is written by Cabot Institute member Peter Thomas, Faculty of Engineering, University of Bristol. Peter’s research focusses on access to energy in humanitarian relief. This blog is co-written by Will Clements, Faculty of Engineering.

Science in action: Air pollution in Bangkok

Bangkok haze 2019 March. Wikimedia Commons.

I was given the opportunity to spend a significant part of 2018 in Bangkok, Thailand, to work with the Chulabhorn Research Institute (CRI) Laboratory of Environmental Toxicology working on a project funded by the Newton Fund on air-quality. Bangkok is a large city with over 14 million inhabitants, which suffer high levels of traffic and congestion resulting in consequent high exposure to traffic-related pollution. It is a UN Sustainable development goal to reduce the number of deaths caused by pollution by 2030. Air pollution is a global problem – a major threat to health throughout the world – but particularly so in low and medium income countries, which account for 92% of pollution related deaths (1). The poor and the marginalised often live in areas of high pollution, and children have a disproportionate exposure to pollutants at a vulnerable stage of development.

The Chulabhorn Research Institute is an independent research institute in Bangkok whose mission includes the application of science and technology to improve the Thai people’s quality of life. The Laboratory of Toxicology, under Professor Mathuros Ruchirawat, have a very strong record in using their results to inform policy and make a real impact on the lives of people in South East Asia affected by environmental toxins. For example, a previous study undertaken by the CRI found that people living and working near busy roads were exposed to Benzene from traffic exhaust, and they demonstrated increased DNA damage. Once this was known, the Thai government was persuaded to alter fuel mixtures in cars to protect the population (2).

I was in Bangkok from January to June, then returned in September till December 2018. I brought with me particle measurement and sampling equipment to count particles and sample particulate matter (PM) in Bangkok to supplement the toxicology work of the Research institute. PM can be described by its size fractions; usually reported are PM10 (aerosol diameter 10 micrometres and lower) and PM2.5 (2.5 micrometres and lower). Less often measured, is the sum-micron range (sometimes referred to as PM1) and the ultrafine range (less than 100 nm).

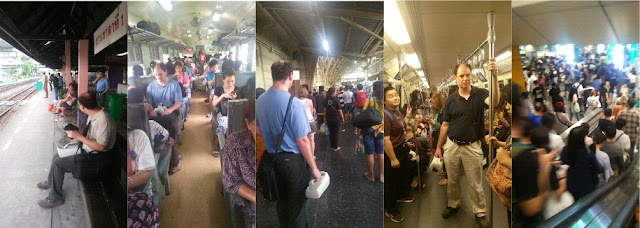
James Matthews with his particle measurement and sampling equipment on public transport in Bangkok.

Below 1 μm, it becomes more difficult to measure particle numbers as optical techniques fail on particles around 200 nm and smaller.  To count them, the particles require a solvent to grow them to a countable size. The requirement for regular solvents, and the high price of aerosol instrumentation to measure the smallest sizes, mean that particle number concentration is not always measured as a matter of course, but new research is indicating that they may be a significant health concern. The smaller particles can penetrate further into the lung and there is some evidence that this may cause them to pass further into the body, possibly even making its way into the brain. While much more research is needed – in both the toxicological and epidemiological domains – to understand the effects of these smaller particles I would not be surprised if the narrative on air quality moves further toward the ultrafine size range in the very near future.

While in Bangkok, I added my aerosol science expertise and experience in aerosol field measurements to the team in the CRI, taking measurements of particle number count using a handheld particle counter, and collecting samples of PM using both PM10 samplers, and a cascade impactor (the Dekati Electrical Low Pressure Impactor) that allowed samples to be separated by aerodynamic size, then collected for further analysis on ICP-MS (inductively coupled plasma mass spectrometry). Thus, metal concentrations within all the different size fractions of aerosol could be found. Within the first few months of the project, I was able to train the staff at the CRI to use this equipment, and so measurements could continue when I returned to the UK.

As well as taking measurements at the CRI in the Lak Si district, north of Bangkok, we chose three sites in the wider Bangkok area that represented different exposure conditions. We were given access to the Thai governmental Pollution Control Department (PCD) air quality measurements sites, where our instrumentation was set up next to their other pollutant measurements.

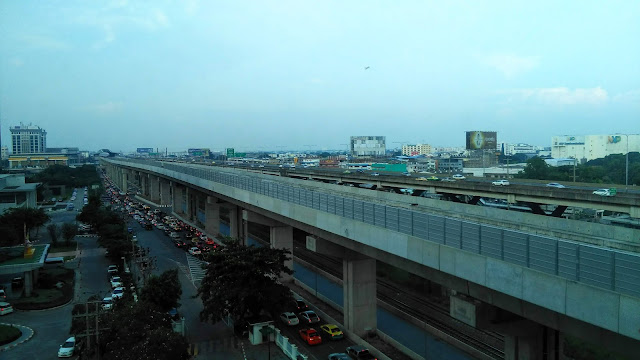
A toll road and railway in Lak Si – from Bangkok toward the Don Mueang airport. Image credit James Matthews.

The three sites included Ayutthaya, a UNESCO world heritage site north of Bangkok. Ayutthaya, while a busy tourist destination, has considerably less traffic, and therefore less traffic emission related pollutants, than the other sites. The second site, Bang Phli, was an area to the South of Bangkok where there is a lot of industry.  The third, Chok Chai, was a roadside site in central Bangkok.

Survey measurements of particle count were taken in several locations using a hand-held particle counter. The particle numbers were highest in measurements on the state railway and on the roads in Bangkok. The state railway through Bangkok is slow moving, where diesel engines repetitively start and brake, all of which contribute to particulates. Conversely the newer sky train and underground railways had low particle counts (the underground had the lowest counts I measured anywhere). At the CRI site, long term measurements near a toll road showed that the particle number count was highest at rush hours, indicating traffic as the dominant contributor. Walking routes in both Bangkok and Ayutthaya showed high concentrations near roads, and in markets and street stalls, where street vendors produce food.

Within our measurements in Bangkok, we were able to measure the mass fraction, and the metal (and some non-metals such as arsenic) content over 12 size fractions from 10 um down to 10 nm. Metals that are known to be deleterious to human health include Cadmium, Chromium, Nickel and Lead, which are class 2 (possible or probable) or class 1 (known) carcinogens. Comparing the reference site (Ayutthaya) with the roadside site (Chok Chai) over several 3-day sampling periods showed that these toxic metals were present in higher concentrations in the area with higher traffic. They were also present in higher concentration in the lower size ranges, which may result in these metals penetrating deeper into the lung.

One episode demonstrated the need for local knowledge when measurements are taken. Normally, we would expect measurements during weekdays to be higher in working areas than at weekends, due to increased work traffic, and in most cases this was the case (Ayutthaya was often an exception, likely due to weekend traffic from tourists). However, one weekend saw a notable peak in aerosol concentrations at a site one Saturday evening, which was difficult to explain. It was pointed out to me by colleagues at the institute that over this weekend was a festival during which the Chinese community in Bangkok traditionally burned items, including fake money, as a long standing tradition. The peak in particles fitted this explanation.

Knowing more about the nature and level of pollutants in a city is an important first step, but challenges persist for the people in Bangkok and other polluted cities as to how to reduce these exposures. The problem of rural crop burning is one that frustrates many in Thailand, as it is well known that the particulates from burnt crops are harmful to the population. While there are strong restrictions on the deliberate burning of crops, it is still common see fields burning in January to March in areas of northern Thailand. Similarly, Bangkok remains the city of the car, with residents accepting that they may have to sit in traffic for long periods to get anywhere.

Burning mountains in Thailand. Wikimedia Commons.

Researchers from Bristol were able to discuss our results alongside measurements from the PCD and the CRI in Bangkok in a seminar held in 2019. It was apparent that there is great awareness of the dangers of air pollution, but it still seems that more needs to be done to address these problems. In January 2019, Bangkok made the headlines for PM2.5 exposures that were at dangerously high levels. January in Thailand is during the ‘cool’ season, where both temperatures and rainfall are low. This weather results in a trapping of pollutants within the city, thus increasing exposure levels. On discussing this with the pollution experts in Thailand, it was argued that the levels this year were typical levels for January, but the reporting of those levels had changed. The Thai PCD advocate communication of pollutant levels though their website and their app, and until recently the PCD sites did not measure PM2.5 in a sufficient number of stations to use it in their air quality index calculations. This year, they changed the calculation to include PM2.5, and as a consequence, the high pollutant levels discussed above were reported. The reporting of these pollutant levels can be attributed to the greater awareness of the population to the problem of pollution, which in turn is leading to a greater urgency in finding solutions.

So there is a role for the direct engagement with the population, which may lead to pressure on governments to respond. There is also a role for science to provide leaders with tangible solutions, such as the suggestion to change fuel mixtures. But the huge challenge of reducing sources of pollutants in a growing city like Bangkok remains.

1 Landringham, P. J. et al 2017. Lancet 391, 462-512
2 Davies R., 2018. Lancet 391, 421.

————————–
This blog is written by Cabot Institute member Dr James Matthews, School of Chemistry, University of Bristol. James’ research looks at the flow of gases in urban environments, and the use of perfluorocarbon trace gas releases to map the passage of air in urban cities.
James Matthews

How we traced ‘mystery emissions’ of CFCs back to eastern China

Since being universally ratified in the 1980s, the Montreal Protocol – the treaty charged with healing the ozone layer – has been wildly successful in causing large reductions in emissions of ozone depleting substances. Along the way, it has also averted a sizeable amount of global warming, as those same substances are also potent greenhouse gases. No wonder the ozone process is often held up as a model of how the international community could work together to tackle climate change.

However, new research we have published with colleagues in Nature shows that global emissions of the second most abundant ozone-depleting gas, CFC-11, have increased globally since 2013, primarily because of increases in emissions from eastern China. Our results strongly suggest a violation of the Montreal Protocol.

A global ban on the production of CFCs has been in force since 2010, due to their central role in depleting the stratospheric ozone layer, which protects us from the sun’s ultraviolet radiation. Since global restrictions on CFC production and use began to bite, atmospheric scientists had become used to seeing steady or accelerating year-on-year declines in their concentration.

Ozone-depleting gases, measured in the lower atmosphere. Decline since the early 1990s is primarily due to the controls on production under the Montreal Protocol. AGAGE / CSIRO

But bucking the long-term trend, a strange signal began to emerge in 2013: the rate of decline of the second most abundant CFC was slowing. Before it was banned, the gas, CFC-11, was used primarily to make insulating foams. This meant that any remaining emissions should be due to leakage from “banks” of old foams in buildings and refrigerators, which should gradually decline with time.

But in that study published last year, measurements from remote monitoring stations suggested that someone was producing and using CFC-11 again, leading to thousands of tonnes of new emissions to the atmosphere each year. Hints in the data available at the time suggested that eastern Asia accounted for some unknown fraction of the global increase, but it was not clear where exactly these emissions came from.

Growing ‘plumes’ over Korea and Japan

Scientists, including ourselves, immediately began to look for clues from other measurements around the world. Most monitoring stations, primarily in North America and Europe, were consistent with gradually declining emissions in the nearby surrounding regions, as expected.
But all was not quite right at two stations: one on Jeju Island, South Korea, and the other on Hateruma Island, Japan.

These sites showed “spikes” in concentration when plumes of CFC-11 from nearby industrialised regions passed by, and these spikes had got bigger since 2013. The implication was clear: emissions had increased from somewhere nearby.

To further narrow things down, we ran computer models that could use weather data to simulate how pollution plumes travel through the atmosphere.

Atmospheric observations at Gosan and Hateruma monitoring stations showed an increase in CFC-11 emissions from China, primarily from Shandong, Hebei and surrounding provinces. Rigby et al, Author provided

From the simulations and the measured concentrations of CFC-11, it became apparent that a major change had occurred over eastern China. Emissions between 2014 and 2017 were around 7,000 tonnes per year higher than during 2008 to 2012. This represents more than a doubling of emissions from the region, and accounts for at least 40% to 60% of the global increase. In terms of the impact on climate, the new emissions are roughly equivalent to the annual CO₂ emissions of London.

The most plausible explanation for such an increase is that CFC-11 was still being produced, even after the global ban, and on-the-ground investigations by the Environmental Investigations Agency and the New York Times seemed to confirm continued production and use of CFC-11 even in 2018, although they weren’t able to determine how significant it was.

While it’s not known exactly why production and use of CFC-11 apparently restarted in China after the 2010 ban, these reports noted that it may be that some foam producers were not willing to transition to using second generation substitutes (HFCs and other gases, which are not harmful to the ozone layer) as the supply of the first generation substitutes (HCFCs) was becoming restricted for the first time in 2013.

Bigger than the ozone hole

Chinese authorities have said they will “crack-down” on any illegal production. We hope that the new data in our study will help. Ultimately, if China successfully eliminates the new emissions sources, then the long-term negative impact on the ozone layer and climate could be modest, and a megacity-sized amount of CO₂-equivalent emissions would be avoided. But if emissions continue at their current rate, it could undo part of the success of the Montreal Protocol.


The network of global (AGAGE) and US-run (NOAA) monitoring stations. Luke Western, Author provided

While this story demonstrates the critical value of atmospheric monitoring networks, it also highlights a weakness of the current system. As pollutants quickly disperse in the atmosphere, and as there are only so many measurement stations, we were only able to get detailed information on emissions from certain parts of the world.

Therefore, if the major sources of CFC-11 had been a few hundred kilometres further to the west or south in China, or in unmonitored parts of the world, such as India, Russia, South America or most of Africa, the puzzle would remain unsolved. Indeed, there are still parts of the recent global emissions rise that remain unattributed to any specific region.

When governments and policy makers are armed with this atmospheric data, they will be in a much better position to consider effective measures. Without it, detective work is severely hampered.


—————————
This blog is written by Cabot Institute member Dr Matt Rigby, Reader in Atmospheric Chemistry, University of Bristol; Luke Western, Research Associate in Atmospheric Science, University of Bristol, and Steve Montzka, Research Chemist, NOAA ESRL Global Monitoring Division, University of ColoradoThis article is republished from The Conversation under a Creative Commons license. Read the original article.

Listen to Matt Rigby talk about CFC emissions on BBC Radio 4’s Inside Science programme.

Climate change: sea level rise could displace millions of people within two generations

A small boat in the Illulissat Icefjord is dwarfed by the icebergs that have calved from the floating tongue of Greenland’s largest glacier, Jacobshavn Isbrae. Image credit: Michael Bamber

Antarctica is further from civilisation than any other place on Earth. The Greenland ice sheet is closer to home but around one tenth the size of its southern sibling. Together, these two ice masses hold enough frozen water to raise global mean sea level by 65 metres if they were to suddenly melt. But how likely is this to happen?

The Antarctic ice sheet is around one and half times larger than Australia. What’s happening in one part of Antarctica may not be the same as what’s happening in another – just like the east and west coasts of the US can experience very different responses to, for example, a change in the El Niño weather pattern. These are periodic climate events that result in wetter conditions across the southern US, warmer conditions in the north and drier weather on the north-eastern seaboard.

The ice in Antarctica is nearly 5km thick in places and we have very little idea what the conditions are like at the base, even though those conditions play a key role in determining the speed with which the ice can respond to climate change, including how fast it can flow toward and into the ocean. A warm, wet base lubricates the bedrock of land beneath the ice and allows it to slide over it.

Though invisible from the surface, melting within the ice can speed up the process by which ice sheets slide towards the sea. Gans33/Shutterstock

These issues have made it particularly difficult to produce model simulations of how ice sheets will respond to climate change in future. Models have to capture all the processes and uncertainties that we know about and those that we don’t – the “known unknowns” and the “unknown unknowns” as Donald Rumsfeld once put it. As a result, several recent studies suggest that previous Intergovernmental Panel on Climate Change reports may have underestimated how much melting ice sheets will contribute to sea level in future.

What the experts say

Fortunately, models are not the only tools for predicting the future. Structured Expert Judgement is a method from a study one of us published in 2013. Experts give their judgement on a hard-to-model problem and their judgements are combined in a way that takes into account how good they are at assessing their own uncertainty. This provides a rational consensus.

The approach has been used when the consequences of an event are potentially catastrophic, but our ability to model the system is poor. These include volcanic eruptions, earthquakes, the spread of vector-borne diseases such as malaria and even aeroplane crashes.

Since the study in 2013, scientists modelling ice sheets have improved their models by trying to incorporate processes that cause positive and negative feedback. Impurities on the surface of the Greenland ice sheet cause positive feedback as they enhance melting by absorbing more of the sun’s heat. The stabilising effect of bedrock rising as the overlying ice thins, lessening the weight on the bed, is an example of negative feedback, as it slows the rate that the ice melts.

The record of observations of ice sheet change, primarily from satellite data, has also grown in length and quality, helping to improve knowledge of the recent behaviour of the ice sheets.

With colleagues from the UK and US, we undertook a new Structured Expert Judgement exercise. With all the new research, data and knowledge, you might expect the uncertainties around how much ice sheet melting will contribute to sea level rise to have got smaller. Unfortunately, that’s not what we found. What we did find was a range of future outcomes that go from bad to worse.

Reconstructed sea level for the last 2500 years. Note the marked increase in rate since about 1900 that is unprecedented over the whole time period. Robert Kopp/Kopp et al. (2016).


Rising uncertainty

We gathered together 22 experts in the US and UK in 2018 and combined their judgements. The results are sobering. Rather than a shrinking in the uncertainty of future ice sheet behaviour over the last six years, it has grown.

If the global temperature increase stays below 2°C, the experts’ best estimate of the average contribution of the ice sheets to sea level was 26cm. They concluded, however, that there is a 5% chance that the contribution could be as much as 80cm.

If this is combined with the two other main factors that influence sea level – glaciers melting around the world and the expansion of ocean water as it warms – then global mean sea level rise could exceed one metre by 2100. If this were to occur, many small island states would experience their current once-in-a-hundred–year flood every other day and become effectively uninhabitable.

A climate refugee crisis could dwarf all previous forced migrations. Punghi/Shutterstock

For a climate change scenario closer to business as usual – where our current trajectory for economic growth continues and global temperatures increase by 5℃ – the outlook is even more bleak. The experts’ best estimate average in this case is 51cm of sea level rise caused by melting ice sheets by 2100, but with a 5% chance that global sea level rise could exceed two metres by 2100. That has the potential to displace some 200m people.

Let’s try and put this into context. The Syrian refugee crisis is estimated to have caused about a million people to migrate to Europe. This occurred over years rather than a century, giving much less time for countries to adjust. Still, sea level rise driven by migration of this size might threaten the existence of nation states and result in unimaginable stress on resources and space. There is time to change course, but not much, and the longer we delay the harder it gets, the bigger the mountain we have to climb.


Click here to subscribe to our climate action newsletter. Climate change is inevitable. Our response to it isn’t.The Conversation

This blog was written by Cabot Institute member Jonathan Bamber, Professor of Physical Geography, University of Bristol and Michael Oppenheimer, Professor of Geosciences and International Affairs, Princeton University.  This article is republished from The Conversation under a Creative Commons license. Read the original article.