Hydrological modelling and pizza making: why doesn’t mine look like the one in the picture?

Is this a question that you have asked yourself after following a recipe, for instance, to make pizza?

You have used the same ingredients and followed all the steps and still the result doesn’t look like the one in the picture…

Don’t worry: you are not alone! This is a common issue, and not only in cooking, but also in hydrological sciences, and in particular in hydrological modelling.

Most hydrological modelling studies are difficult to reproduce, even if one has access to the code and the data (Hutton et al., 2016). But why is this?

In this blog post, we will try to answer this question by using an analogy with pizza making.

Let’s imagine that we have a recipe together with all the ingredients to make pizza. Our aim is to make a pizza that looks like the one in the picture of the recipe.

This is a bit like someone wanting to reproduce the results reported in a scientific paper about a hydrological “rainfall-runoff” model. There, one would need to download the historical data (rainfall, temperature and river flows) and the model code used by the authors of the study.

However, in the same way as the recipe and the ingredients are just the start of the pizza making process, having the input data and the model code is only the start of the modelling process.

To get the pizza shown in the picture of the recipe, we first need to work the ingredients, i.e. knead the dough, proof and bake. And to get the simulated river flows shown in the study, we need to ‘work’ the data and the model code, i.e. do the model calibration, evaluation and final simulation.

Using the pizza making analogy, these are the correspondences between pizza making and hydrological modelling:

Pizza making                         Hydrological modelling

kitchen and cooking tools computer and software

ingredients                         historical data and computer code for model simulation

recipe                                 modelling process as described in a scientific paper or in a computer                                                         script / workflow

Step 1: Putting the ingredients together

Dough kneading

So, let’s start making the pizza. According to the recipe, we need to mix well the ingredients to get a dough and then we need to knead it. Kneading basically consists of pushing and stretching the dough many times and it can be done either manually or automatically (using a stand mixer).

The purpose of kneading is to develop the gluten proteins that create the structure and strength in the dough, and that allow for the trapping of gases and the rising of the dough.The recipe recommends using a stand mixer for the kneading, however if we don’t have one, we can do it manually.

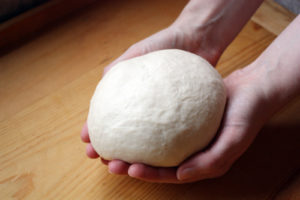
The recipe says to knead until the dough is elastic and looks silky and soft. We then knead the dough until it looks like the one in the photo shown in the recipe.

Model calibration

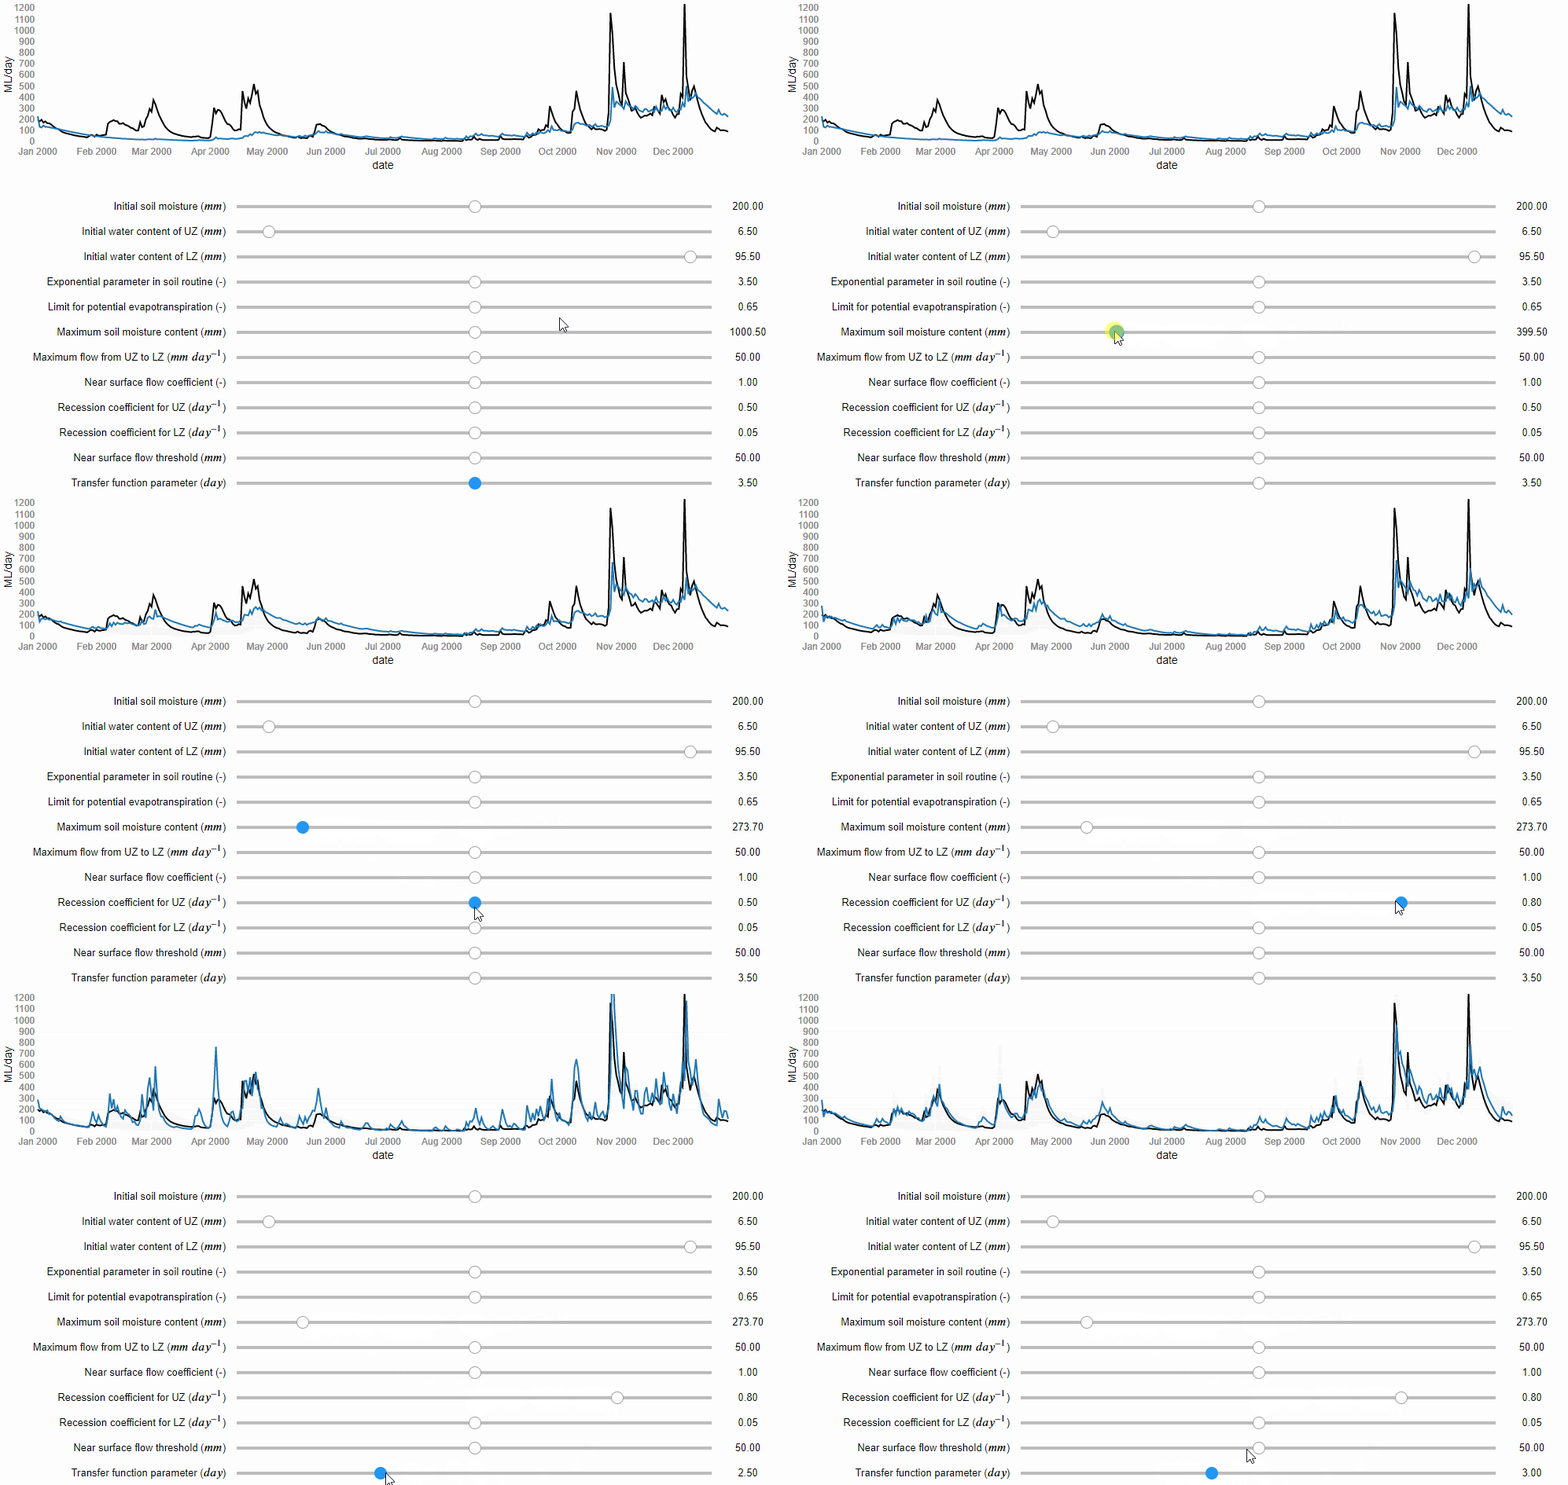
Now, let’s start the modelling process. If the paper does not report the values of the model parameters, we can determine them through model calibration. Model calibration is a mathematical process that aims to tailor a general hydrological model to a particular basin. It involves running the model many times under different combinations of the parameter values, until one is found that matches well the flow records available for that basin. Similarly to kneading, model calibration can be manual, i.e. the modeller changes manually the values of the model parameters trying to find a combination that captures the patterns in the observed flows (Figure 1), or it can be automatic, i.e. a computer algorithm is used to search for the best combination of parameter values more quickly and comprehensively.

Figure 1 Manual model calibration. The river flows predicted by the model are represented by the blue line and the observed river flows by the black line (source: iRONS toolbox)

According to the study, the authors used an algorithm implemented in an open source software for the calibration. We can download and use the same software. However, if any error occurs and we cannot install it, we could decide to calibrate the model manually. According to the study, the Nash-Sutcliffe efficiency (NSE) function was used as numerical criteria to evaluate the calibration obtaining a value of 0.82 out of 1. We then do the manual calibration until we obtain NSE = 0.82.

(source: iRONS toolbox)

Step 2: Checking our work

Dough proofing

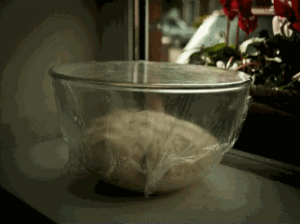
In pizza making, this step is called proofing or fermentation. In this stage, we place the dough somewhere warm, for example close to a heater, and let it rise. According to the recipe, the proofing will end after 3 hours or when the dough has doubled its volume.

The volume is important because it gives us an idea of how strong the dough is and how active the yeast is, and hence if the dough is ready for baking. We let our dough rise for 3 hours and we check. We find out that actually it has almost tripled in size… “even better!” we think.

Model evaluation

In hydrological modelling, this stage consists of running the model using the parameter values obtained by the calibration but now under a different set of temperature and rainfall records. If the differences between estimated and observed flows are still low, then our calibrated model is able to predict river flows under meteorological conditions different from the one to which it was calibrated. This makes us more confident that it will work well also under future meteorological conditions. According to the study, the evaluation gave a NSE = 0.78. We then run our calibrated model fed by the evaluation data and we get a NSE = 0.80… “even better!” we think.

Step 3: Delivering the product!

Pizza baking

Finally, we are ready to shape the dough, add the toppings and bake our pizza. According to the recipe, we should shape the dough into a round and thin pie. This takes some time as our dough keeps breaking when stretched, but we finally manage to make it into a kind of rounded shape. We then add the toppings and bake our pizza.

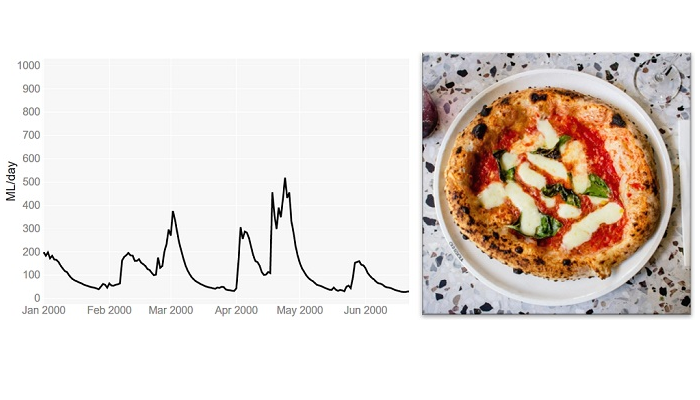
Ten minutes later we take the pizza out of the oven and… it looks completely different from the one in the picture of the recipe! … but at least it looks like a pizza…

(Source: flickr.com)

River flow simulation

And finally, after calibrating and evaluating our model, we are ready to use it to simulate recreate the same river flow predictions as shown in the results of the paper. In that study, they forced the model with seasonal forecasts of rainfall and temperature that are available from the website of the European Centre for Medium-range Weather Forecasts (ECMWF).

Downloading the forecasts takes some time because we need to write two scripts, one to download the data and one to pre-process them to be suitable for our basin (so called “bias correction”). After a few hours we are ready to run the simulation and… it looks completely different from the hydrograph shown in the study! … but at least it looks like a hydrograph…

Why we never get the exact same result?

Here are some possible explanations for our inability to exactly reproduce pizzas or modelling results:

  • We may have not kneaded the dough enough or kneaded it too much; or we may have thought that the dough was ready when it wasn’t. Similarly, in modelling, we may have stopped the calibration process too early or too late (so called “over-fitting” of the data).
  • The recipe does not provide sufficient information on how to test the dough; for example, it does not say how wet or elastic the dough should be after kneading. Similarly, in modelling, a paper may not provide sufficient information about model testing as, for instance, the model performance for different variables and different metrics.
  • We don’t have the same cooking tools as those used by the recipe’s authors; for example, we don’t have the same brand of the stand mixer or the oven. Similarly, in modelling we may use a different hardware or operating system, which means calculations may differ due to different machine precision or slightly different versions of the same software tools/dependencies.
  • Small changes in the pizza making process, such as ingredients quantities, temperature and humidity, can lead to significant changes in the final result, particularly because some processes, such as kneading, are very sensitive to small changes in conditions. Similarly, small changes in the modelling process, such as in the model setup or pre-processing of the data, can lead to rather different results.

In conclusion…

Setting up a hydrological model involves the use of different software packages, which often exist in different versions, and requires many adjustments and choices to tailor the model to a specific place. So how do we achieve reproducibility in practice? Sharing code and data is essential, but often is not enough. Sufficient information should also be provided to understand what the model code does, and whether it does it correctly when used by others. This may sound like a big task, but the good news is that we have increasingly powerful tools to efficiently develop rich and interactive documentation. And some of these tools, such as R Markdown or Jupyter Notebooks, and the online platforms that support them such as Binder, enable us not only to share data and code but also the full computational environment in which results are produced – so that others have access not only to our recipes but can directly cook in our kitchen.

—————————

This blog has been reposted with kind permission from the authors, Cabot Institute for the Environment members Dr Andres Peñuela, Dr Valentina Noacco and Dr Francesca Pianosi. View the original post on the EGU blog site.

Andres Peñuela is a Research Associate in the Water and Environmental Engineering research group at the University of Bristol. His main research interest is the development and application of models and tools to improve our understanding on the hydrological and human-impacted processes affecting water resources and water systems and to support sustainable management and knowledge transfer


Valentina Noacco is a Senior Research Associate in the Water and Environmental Engineering research group at the University of Bristol. Her main research interest is the development of tools and workflows to transfer sensitivity analysis methods and knowledge to industrial practitioners. This knowledge transfer aims at improving the consideration of uncertainty in mathematical models used in industry


Francesca Pianosi is a Senior Lecturer in Water and Environmental Engineering at the University of Bristol. Her expertise is in the application of mathematical modelling to hydrology and water systems. Her current research mainly focuses on two areas: modelling and multi-objective optimisation of water resource systems, and uncertainty and sensitivity analysis of mathematical models.



Bristol Science Film Festival 2021 – Cabot Institute for the Environment film prize


Film is a medium that so many of us connect over, whether going to the movies, watching YouTube videos with friends, or sharing clips on Instagram. With the increasing prevalence of mini-movie-making machines (smartphones), we think film is a great and accessible form of science communication! Bristol Science Film Festival runs an annual science film competition to support all those film-makers trying to tell the most interesting facts (or science fictions), no matter their resources. Shortlisted films are screened on the Big Screen in Bristol and at a special film-makers screening during the Festival. 


There will be an additional prize awarded this year for a short film submitted to the competition with an environmental or climate change theme. Cash prizes will be awarded to the winner and runner up on behalf of the Cabot Institute for the Environment.

The University of Bristol-based Institute supports evidence-based and interdisciplinary solutions to environmental challenges. The Institute makes use of an academic network of 600 that collaborate to improve the way we live now and tackle the negative impacts we have on our surroundings.

The Cabot Institute wants to see your short science fiction or fact films with an environmental theme. These could explore topics from water and food security to new technology that will help us deliver a low-carbon future. You could even show us what you think our future built environment will look like.

The Cabot Institute will award £150 to the winner and £50 to the runner up. To be considered, just submit your environmental film to our Festival via FilmFreeway and you’ll automatically be considered for the Cabot Institute for the Environment film prize.

Already submitted your film? We don’t make final decisions until after the competition closing date of May 1st, 2021. If you have already submitted your film on an environment-related topic, it’ll automatically be eligible for the Cabot Institute prize.

Any questions, please get in touch. Good luck!

———————–

This blog was reposted with kind permission from the Bristol Science Film Festival. View the original blog.

Beast from the East 2? What ‘sudden stratospheric warming’ involves and why it can cause freezing surface weather


Darryl Fonseka / shutterstock

A “sudden stratospheric warming” event took place in early January 2021, according to the Met Office, the UK’s national weather service. These events are some of the most extreme of atmospheric phenomena, and I study them as part of my academic research. The stratosphere is the layer of the atmosphere from around 10km to 50km above the Earth’s surface, and sudden warming up there can lead to very cold weather over Europe and Siberia, with an increased possibility of snow storms.


In winter the polar regions are in darkness 24 hours a day, and so the stratosphere over the north pole drops to -60℃ or even lower. The pole is surrounded by strong westerly winds, forming what is known as the polar vortex, a normal occurrence which develops every winter. However, about six times a decade, this vortex can break down in dramatic fashion. This can lead to temperatures over the pole increasing by up to 50°C over a few days, although temperatures are so low that they still remain below freezing. The average wind direction around the pole may also reverse, in which case a “sudden stratospheric warming” event has occurred.

The disturbance in the stratosphere can then be transmitted downward through the atmosphere. If this disturbance reaches the lower levels of the atmosphere it can affect the jet stream, a current of air which normally snakes eastwards around the planet, dividing colder polar air from warmer air to the south.

Where the jet stream crosses the Atlantic it usually points towards the British Isles, but sudden stratospheric warming can lead it to shift towards the equator. As air currents are temporarily rearranged, warmer Atlantic air is replaced by cold air from Siberia or the Arctic, and Europe and Northern Asia may experience unusually cold weather. This is what happened when the infamous “Beast from the East” passed through Europe in 2018, causing huge snowstorms and dozens of deaths.

It can take a number of weeks for the impact of stratospheric warming to reach the surface, or the process may only take a few days. These events are hard to predict in advance. Some can only be predicted a few days ahead while others may be forecast from around two weeks before.

A number of factors including a La Niña event in the tropical Pacific contributed to a strong vortex in early winter 2020/21. Strong vortices are hard to shift, meaning a sudden stratospheric warming event was not looking particularly likely. However, from just before Christmas, weather forecast model predictions began to converge on a likely stratospheric warming event in early January.

From stratosphere to surface

Around two thirds of stratospheric warming events have a detectable surface impact, up to 40 days after the onset of the event. This is usually marked by lower than normal temperatures across Northern Europe and Asia, extending into western Europe, but with warmer temperatures over the eastern Canadian Arctic.

It’s not yet clear why some stratospheric warming events take weeks to impact the surface while others are felt days later, but it may be related to how the polar vortex changes around the onset of a warming event. The vortex can split into two smaller “child vortices”, or it can be displaced from its more usual position centred near the pole, to being over northern Siberia.

Early indications suggested that 2021’s event was more likely to be split, but it subsequently showed more features of a displacement. It is not unusual for the vortex to show such mixed signals.

Colleagues and I recently developed a new method for tracking the impact of a warming event from its onset in the stratosphere to when its effect reaches the surface. We analysed 40 such events from the past 60 years, to try and figure out when we might expect extreme surface weather.

Most importantly, we found that warming events in which the stratospheric polar vortex splits in two generally lead to surface impacts appearing faster and stronger. So although there is an increased chance of snow and extreme cold in mid to late January 2021, other confounding factors may act to reduce this impact.

There are always competing forces at work in the atmosphere. Few people noticed the sudden stratospheric warming of January 2019 for example, which had little impact on the European winter. In that instance, there was a westerly influence on the North Atlantic winds, which originated in the tropics. This may have acted to oppose any stratospheric effect favouring easterly winds. In 2021, the battle is between the stratospheric warming and La Niña.

Sudden stratospheric warming events are a natural atmospheric fluctuation, not caused by climate change. So even with climate change, these events will still occur, which means that we need to be adaptable to an even more extreme range of temperatures.The Conversation

———————————

This blog is written by Cabot Institute member Dr Richard Hall, Research Associate, Climate Dynamics Group, University of BristolThis article is republished from The Conversation under a Creative Commons license. Read the original article.

Dr Richard Hall


Frozen Empires revisited

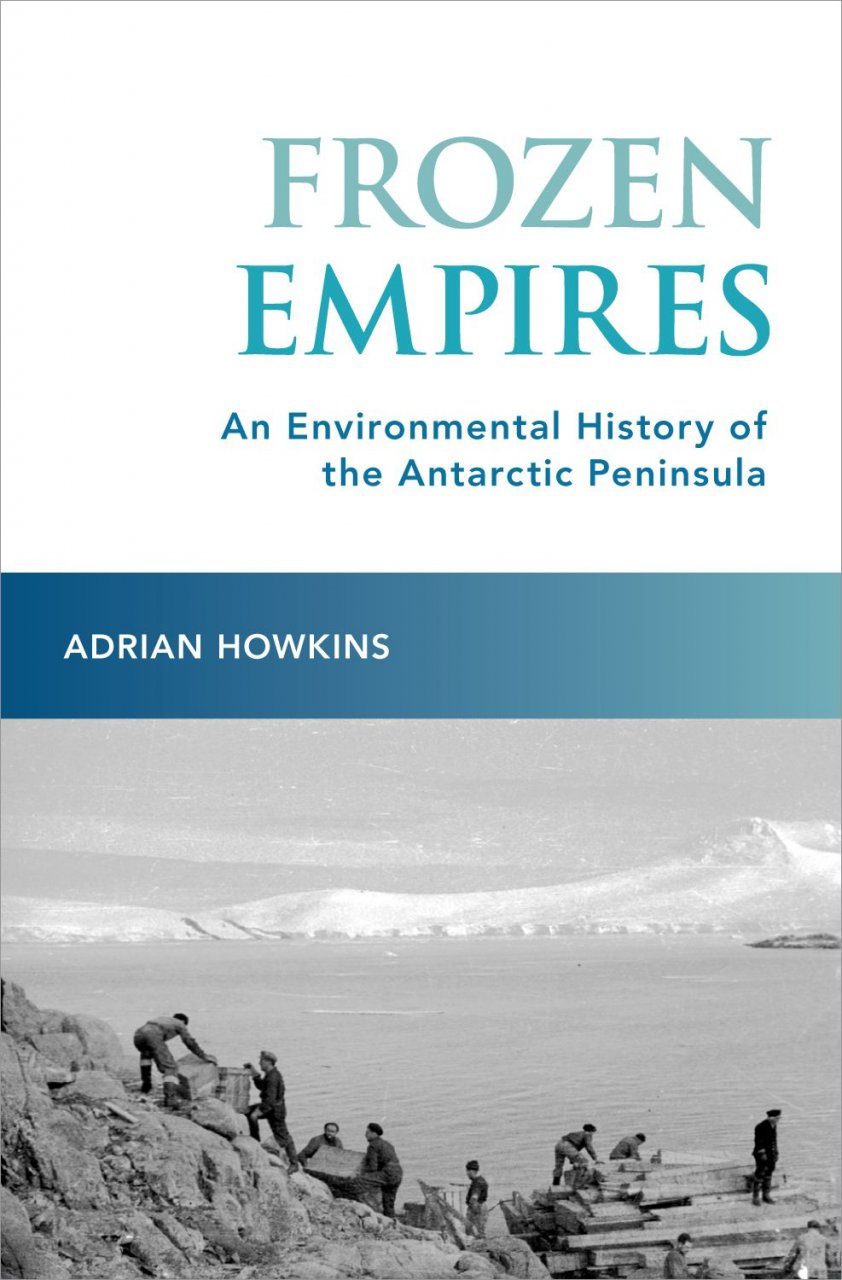
Image taken from the front cover of Adrian Howkin’s book – Frozen Empires

The recent release of the paperback edition of Frozen Empires: An Environmental History of the Antarctic Peninsula, offers an opportunity to revisit the arguments I made in this book and reflect on how it continues to shape my work in Antarctica and thinking about environmental history.  The book sets out to frame the mid-twentieth century Antarctic sovereignty dispute among Argentina, Britain, and Chile as an environmental history of decolonization.  Through a strategy I refer to as asserting ‘environmental authority’, Britain used the performance of scientific research and the production of useful knowledge to support its imperial claims to the region as a territory known as the ‘Falkland Islands Dependencies’.  Argentina and Chile both contested Britain’s claim, and put forward their own assertations to sovereignty based on a sense that this was their environment as a result of proximity, geological contiguity, and shared climate and ecosystems. In the contest between British assertions of environmental authority and Argentine and Chilean ‘environmental nationalism’ it was the imperial, scientific vision of the environment that largely won out.  There was no genuine decolonization of the Antarctic Peninsula region, or the Antarctic continent more generally.  Instead, the 1959 Antarctic Treaty, which remains in force today, retains pre-existing sovereignty claims in a state of suspended animation (‘frozen’ in the pun of the treaty negotiators) and perpetuates the close connection between science and politics across the Antarctic Continent.

Much of my work since researching and writing Frozen Empires has focused on the history of the McMurdo Dry Valleys on the opposite side of the Antarctic continent.  I am a co-PI on a US National Science Foundation funded Long Term Ecological Research (LTER) project, collaborating with scientists to ask how historical research might inform our understanding of this unique place.  The McMurdo Dry Valleys are the largest predominantly ice-free region of Antarctica and since the late 1950s have become an important site of Antarctic science.  Geologists are attracted to the Dry Valleys by the exposed rock, geomorphologists by the opportunity to study the glaciological history of the continent, and ecologists by the presence of microscopic ecosystems.  The close connection between politics and science that I identified in the Antarctic Peninsula is also applicable to the history of the McMurdo Dry Valleys.  The two most active countries in the region, New Zealand and the United States, can both be seen as making assertions of environmental authority to support their political position.  A major difference is that now I find myself on the inside of this system, working with scientists to help produce the ‘useful information’ that is being used for political purposes.

Working as more of an insider in a system I critiqued in Frozen Empires raises a number of awkward questions.  Can I retain a critical distance?  Am I contributing to the perpetuation of an unequal system?  What might the decolonization of Antarctic research look like?  These questions are not easy to answer.  Not infrequently I find myself looking back on the lack of inhibition I felt while researching and writing Frozen Empires and wishing for something similar in my current research.  Academic collaboration by definition leads to entanglements, and these entanglements increase complexity.  It is much easier, for example, to write critically about the imperial history of Antarctica than to convince scientific colleagues that this imperial history continues to have an impact on contemporary scientific research.

But for all the messiness and difficulties involved in collaboration, there are also tremendous opportunities.  I have learned a lot about how science gets done through working with the McMurdo Dry Valleys LTER site, and I have learned about working as part of an academic team.  Place-based studies offers an ideal opportunity for interdisciplinary research, and I think it is vital to have humanities perspectives represented in these collaborations.  It takes time – often more time than expected – for effective collaborations to develop, and this process involves a significant degree of mutual learning.  Researching and writing Frozen Empires fundamentally shaped what I bring to the table as an environmental historian in the McMurdo Dry Valleys project, and I remain convinced by its argument for imperial continuity.  But the process of engaging in collaborative research has unsettled at least some of my earlier positions, and the book I’m writing on the history of the McMurdo Dry Valleys will likely be quite different to Frozen Empires.

—————————————-

This blog is written by Cabot Institute member Dr Adrian Howkins, Reader in Environmental History, University of Bristol.

It has been reposted with kind permission from the Bristol Centre for Environmental Humanities. View the original blog.