Hydrological hazards across timescales

University of Bristol – Met Office Academic Partnership Meeting 

From droughts and floods to water quality and water resource management, researchers at the University of Bristol and the Met Office are world-leaders in climate and hydrological research. Building on the new academic partnership between Bristol and the Met Office, the goal of this meeting was to foster new collaborations and strengthen existing partnerships between Bristol and the Met Office on the topic of weather, climate and hydrology. 

In total, we had 29 attendees attend the workshop, with 10 from the Met Office, 17 from the University of Bristol and 2 from Fathom including weather and climate scientists, catchment hydrologists and flood modellers at a wide range of career stages. 


The meeting explored two key themes, the first half of the meeting focused on ‘Exploiting convection permitting weather and climate models for flood and drought prediction’, while the second half focused on ‘Quantifying uncertainty in hydrological projections’. For each theme, there were two short plenary talks that highlighted existing research across the Met Office and University of Bristol and then a presentation focused on an exciting piece of research covering topics on exploiting convection permitting models for flood and drought prediction (Lizzie Kendon) and towards large ensembles of km-scale precipitation simulations using AI (Peter Watson and Henry Addison).  We also had eight lighting talks on topics ranging from tropical cyclones to pan-tropics convection-permitting climate simulations to compound wind and flood risk.  


Alongside the talks, there was time for attendees to discuss ideas and opportunities focused around five key discussion topics; uncertainty estimation, compound events and multi-hazard coupling, evaluation of weather and climate driving information for hydrology, exploiting higher resolution capabilities for hydrology and from hydrological predictions to ‘services’. 


Overall, the meeting was a success and we appreciated an in person meeting fuelled by coffee, cake and cheese! Tangible outputs from the day included contributions on a NERC proposal, making new connections, ideas for future collaborations, sharing of data and methodologies and the foundations for a collaborative climate and hydrology community 


Further details from the meeting can be requested from Gemma Coxon (gemma.coxon@bristol.ac.uk). 

Hydrological modelling and pizza making: why doesn’t mine look like the one in the picture?

Is this a question that you have asked yourself after following a recipe, for instance, to make pizza?

You have used the same ingredients and followed all the steps and still the result doesn’t look like the one in the picture…

Don’t worry: you are not alone! This is a common issue, and not only in cooking, but also in hydrological sciences, and in particular in hydrological modelling.

Most hydrological modelling studies are difficult to reproduce, even if one has access to the code and the data (Hutton et al., 2016). But why is this?

In this blog post, we will try to answer this question by using an analogy with pizza making.

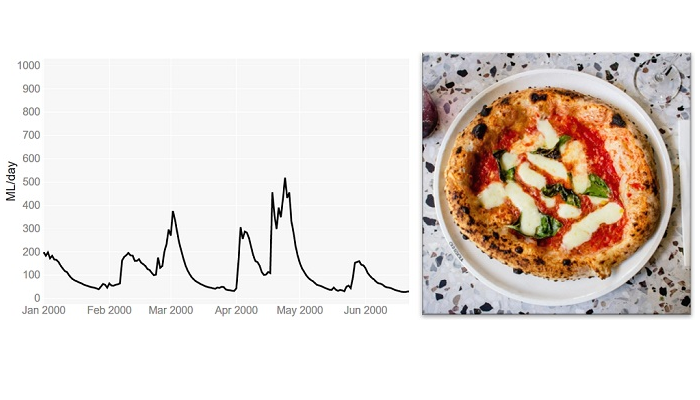
Let’s imagine that we have a recipe together with all the ingredients to make pizza. Our aim is to make a pizza that looks like the one in the picture of the recipe.

This is a bit like someone wanting to reproduce the results reported in a scientific paper about a hydrological “rainfall-runoff” model. There, one would need to download the historical data (rainfall, temperature and river flows) and the model code used by the authors of the study.

However, in the same way as the recipe and the ingredients are just the start of the pizza making process, having the input data and the model code is only the start of the modelling process.

To get the pizza shown in the picture of the recipe, we first need to work the ingredients, i.e. knead the dough, proof and bake. And to get the simulated river flows shown in the study, we need to ‘work’ the data and the model code, i.e. do the model calibration, evaluation and final simulation.

Using the pizza making analogy, these are the correspondences between pizza making and hydrological modelling:

Pizza making                         Hydrological modelling

kitchen and cooking tools computer and software

ingredients                         historical data and computer code for model simulation

recipe                                 modelling process as described in a scientific paper or in a computer                                                         script / workflow

Step 1: Putting the ingredients together

Dough kneading

So, let’s start making the pizza. According to the recipe, we need to mix well the ingredients to get a dough and then we need to knead it. Kneading basically consists of pushing and stretching the dough many times and it can be done either manually or automatically (using a stand mixer).

The purpose of kneading is to develop the gluten proteins that create the structure and strength in the dough, and that allow for the trapping of gases and the rising of the dough.The recipe recommends using a stand mixer for the kneading, however if we don’t have one, we can do it manually.

The recipe says to knead until the dough is elastic and looks silky and soft. We then knead the dough until it looks like the one in the photo shown in the recipe.

Model calibration

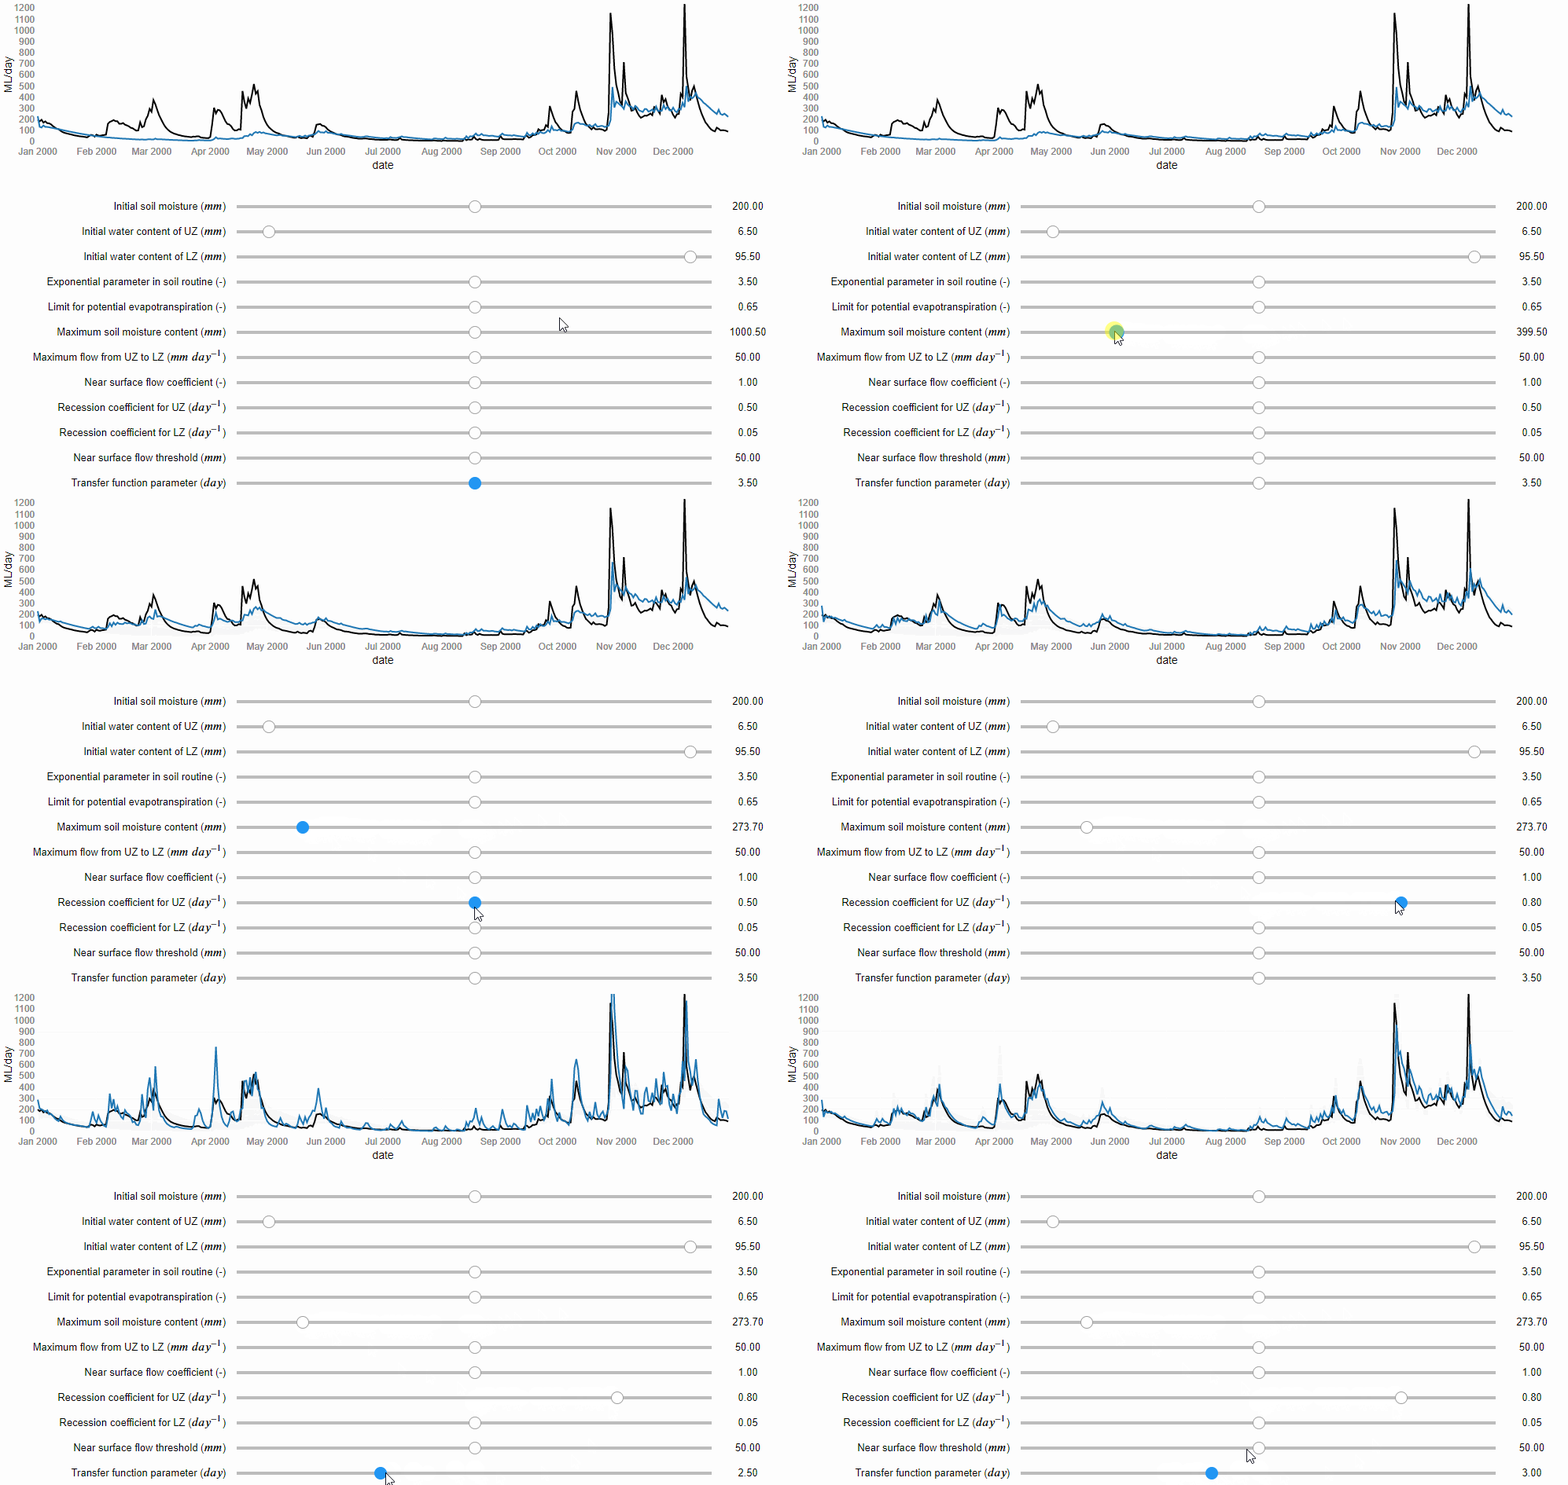
Now, let’s start the modelling process. If the paper does not report the values of the model parameters, we can determine them through model calibration. Model calibration is a mathematical process that aims to tailor a general hydrological model to a particular basin. It involves running the model many times under different combinations of the parameter values, until one is found that matches well the flow records available for that basin. Similarly to kneading, model calibration can be manual, i.e. the modeller changes manually the values of the model parameters trying to find a combination that captures the patterns in the observed flows (Figure 1), or it can be automatic, i.e. a computer algorithm is used to search for the best combination of parameter values more quickly and comprehensively.

Figure 1 Manual model calibration. The river flows predicted by the model are represented by the blue line and the observed river flows by the black line (source: iRONS toolbox)

According to the study, the authors used an algorithm implemented in an open source software for the calibration. We can download and use the same software. However, if any error occurs and we cannot install it, we could decide to calibrate the model manually. According to the study, the Nash-Sutcliffe efficiency (NSE) function was used as numerical criteria to evaluate the calibration obtaining a value of 0.82 out of 1. We then do the manual calibration until we obtain NSE = 0.82.

(source: iRONS toolbox)

Step 2: Checking our work

Dough proofing

In pizza making, this step is called proofing or fermentation. In this stage, we place the dough somewhere warm, for example close to a heater, and let it rise. According to the recipe, the proofing will end after 3 hours or when the dough has doubled its volume.

The volume is important because it gives us an idea of how strong the dough is and how active the yeast is, and hence if the dough is ready for baking. We let our dough rise for 3 hours and we check. We find out that actually it has almost tripled in size… “even better!” we think.

Model evaluation

In hydrological modelling, this stage consists of running the model using the parameter values obtained by the calibration but now under a different set of temperature and rainfall records. If the differences between estimated and observed flows are still low, then our calibrated model is able to predict river flows under meteorological conditions different from the one to which it was calibrated. This makes us more confident that it will work well also under future meteorological conditions. According to the study, the evaluation gave a NSE = 0.78. We then run our calibrated model fed by the evaluation data and we get a NSE = 0.80… “even better!” we think.

Step 3: Delivering the product!

Pizza baking

Finally, we are ready to shape the dough, add the toppings and bake our pizza. According to the recipe, we should shape the dough into a round and thin pie. This takes some time as our dough keeps breaking when stretched, but we finally manage to make it into a kind of rounded shape. We then add the toppings and bake our pizza.

Ten minutes later we take the pizza out of the oven and… it looks completely different from the one in the picture of the recipe! … but at least it looks like a pizza…

(Source: flickr.com)

River flow simulation

And finally, after calibrating and evaluating our model, we are ready to use it to simulate recreate the same river flow predictions as shown in the results of the paper. In that study, they forced the model with seasonal forecasts of rainfall and temperature that are available from the website of the European Centre for Medium-range Weather Forecasts (ECMWF).

Downloading the forecasts takes some time because we need to write two scripts, one to download the data and one to pre-process them to be suitable for our basin (so called “bias correction”). After a few hours we are ready to run the simulation and… it looks completely different from the hydrograph shown in the study! … but at least it looks like a hydrograph…

Why we never get the exact same result?

Here are some possible explanations for our inability to exactly reproduce pizzas or modelling results:

  • We may have not kneaded the dough enough or kneaded it too much; or we may have thought that the dough was ready when it wasn’t. Similarly, in modelling, we may have stopped the calibration process too early or too late (so called “over-fitting” of the data).
  • The recipe does not provide sufficient information on how to test the dough; for example, it does not say how wet or elastic the dough should be after kneading. Similarly, in modelling, a paper may not provide sufficient information about model testing as, for instance, the model performance for different variables and different metrics.
  • We don’t have the same cooking tools as those used by the recipe’s authors; for example, we don’t have the same brand of the stand mixer or the oven. Similarly, in modelling we may use a different hardware or operating system, which means calculations may differ due to different machine precision or slightly different versions of the same software tools/dependencies.
  • Small changes in the pizza making process, such as ingredients quantities, temperature and humidity, can lead to significant changes in the final result, particularly because some processes, such as kneading, are very sensitive to small changes in conditions. Similarly, small changes in the modelling process, such as in the model setup or pre-processing of the data, can lead to rather different results.

In conclusion…

Setting up a hydrological model involves the use of different software packages, which often exist in different versions, and requires many adjustments and choices to tailor the model to a specific place. So how do we achieve reproducibility in practice? Sharing code and data is essential, but often is not enough. Sufficient information should also be provided to understand what the model code does, and whether it does it correctly when used by others. This may sound like a big task, but the good news is that we have increasingly powerful tools to efficiently develop rich and interactive documentation. And some of these tools, such as R Markdown or Jupyter Notebooks, and the online platforms that support them such as Binder, enable us not only to share data and code but also the full computational environment in which results are produced – so that others have access not only to our recipes but can directly cook in our kitchen.

—————————

This blog has been reposted with kind permission from the authors, Cabot Institute for the Environment members Dr Andres Peñuela, Dr Valentina Noacco and Dr Francesca Pianosi. View the original post on the EGU blog site.

Andres Peñuela is a Research Associate in the Water and Environmental Engineering research group at the University of Bristol. His main research interest is the development and application of models and tools to improve our understanding on the hydrological and human-impacted processes affecting water resources and water systems and to support sustainable management and knowledge transfer


Valentina Noacco is a Senior Research Associate in the Water and Environmental Engineering research group at the University of Bristol. Her main research interest is the development of tools and workflows to transfer sensitivity analysis methods and knowledge to industrial practitioners. This knowledge transfer aims at improving the consideration of uncertainty in mathematical models used in industry


Francesca Pianosi is a Senior Lecturer in Water and Environmental Engineering at the University of Bristol. Her expertise is in the application of mathematical modelling to hydrology and water systems. Her current research mainly focuses on two areas: modelling and multi-objective optimisation of water resource systems, and uncertainty and sensitivity analysis of mathematical models.


Flooding in the UK: Understanding the past and preparing for the future

On the 16th of October 2019, Ivan Haigh ­Associate Professor in Coastal Oceanography at the University of Southampton – gave a presentation on the “characteristics and drivers of compound flooding events around the UK coast” at the BRIDGE research seminar in the School of Geographical Sciences. He began by outlining the seriousness of flood risk in the UK – it is the second highest civil emergency risk factor as defined by the Cabinet Office – before moving on to the first section of the talk on his work with the Environment Agency on its Thames Estuary 2100 plan (TE2100)[1].

Thames Estuary 2100 plan: 5-year review

The construction of a Thames barrier was proposed after severe flooding in London in 1953, and it eventually became operational 30 years later in 1983. Annually, the Thames barrier removes around £2bn of flood damage risk from London and is crucial to the future prosperity of the city in a changing environment.

The Thames Barrier in its closed formation. Image source: Thames Estuary 2100 Plan (2012)

Flood defences in the Thames estuary were assessed in the TE2100 plan, which takes an innovative “adaptive pathways management approach” to the future of these flood defences over the coming century. This approach means that a range of flood defence options are devised and the choice of which ones to implement is based upon the current environmental data and the latest models of future scenarios, in particular predictions of future sea level rise.

For this method to be effective, accurate observations of recent sea level changes must be made in order to determine which management pathway to implement and to see if these measurements fit with the predictions of future sea level rise used in the plan. This work is carried out in reviews of the plan at five-year intervals, and it was this work that Ivan and his colleagues were involved with.

There is significant monthly and annual variability in the local tide gauge records that measure changes in sea level, and this can make it difficult to assess whether there is any long-term trend in the record. Using statistical analysis of the tide gauge data, the team was able to filter 91% of the variability that was due to short term changes in atmospheric pressure and winds to reveal a trend of approximately 1.5 mm per year of sea level rise, in line with the predictions of the model that is incorporated into the TE2100 plan.

Compound flood events around the UK Coast

In the second half of his presentation, Ivan went on to discuss a recent paper he was involved with studying compound flood events around the UK (Hendry et al. 2019)[2]. A compound flood occurs when a storm surge, caused by low atmospheric pressure allowing the sea surface to rise locally, combines with river flooding caused by a large rainfall event. These can be the most damaging natural disasters in the UK, and from historical data sets stretching back 50 years at 33 tide gauges and 326 river stations, the team were able to determine the frequency of compound floods across the UK.

Along the west coast, there were between 3 and 6 compound flooding events per decade, whereas on the east coast, there were between 0 and 1 per decade. This difference between east and west is driven by the different weather patterns that lead to these events. On the west coast it is the same type of low-pressure system that causes coastal storm surges and high rainfall. However, on the east coast different weather patterns are responsible for high rainfall and storm surges, meaning it is very unlikely they could occur at the same time.

Number of compound flood events per decade at each of the 326 river stations in the study. Triangle symbols implies rover mouth on West coast, circles East coast and squares South coast. Image Source: Hendry et al. 2019 [2]

There is also significant variability along the west coast of the UK as well, and the team investigated whether the characteristics of the river catchments could impact the possibility of these compound flooding events occurring. They found that smaller river catchments, and steeper terrain within the catchments, increased the probability of these compound flooding events occurring as water from rainfall was delivered to the coast more quickly. From the improved understanding of the weather patterns behind compound flooding events that this work provides, the quality and timeliness of flood warnings could be improved.

From the question and answer session we heard that current flood risk assessments do not always include the potential for compound flood events, meaning flood risk could be underestimated along the west coast of the UK. We also heard that Ivan will be working with researchers in the hydrology group here at the University of Bristol to further the analysis of the impact of river catchment characteristics on the likelihood of compound flooding events, and then extending this analysis to Europe, North America and Asia.

References

[1] Environment Agency (2012), “Thames Estuary 2100 Plan”.
[2] Alistair Hendry, Ivan D. Haigh, Robert J. Nicholls, Hugo Winter, Robert Neal, Thomas Wahl, Amélie Joly-Laugel, and Stephen E. Darby, (2019). “Assessing the characteristics and drivers of compound flooding events around the UK coast”, Hydrology and Earth System Science, 23, 3117-3139.

——————————————-

This blog was written by Cabot Institute member Tom Mitcham. He is a PhD student in the School of Geographical Sciences at the University of Bristol and is studying the ice dynamics of Antarctic ice shelves and their tributary glaciers.

Tom Mitcham

Read Tom’s other blog:
1. Just the tip of the iceberg: Climate research at the Bristol Glaciology Centre

Quality through Equality – tackling gender issues in hydrology

Quality through Equality organising committee (l-r Dr Francesca Pianosi, Dr Valentina Noacco, Sebastian Gnann, Lina Stein, Dr Maria Pregnolato, Elisa Coraggio, Melike Kiraz, Lina Wang)

Results of a 1-day workshop organised by the Bristol University’s Water Engineering Group

A professor asked our group of PhD students last year, “Who here thinks of staying in academia after finishing their PhD?” Of the 10 male students present, 4 or 5 said they could imagine continuing in academia. None of the 5 female students raised their hand. When asked for their reasons for not wanting to stay in academia, some of the things mentioned were the challenge of combining family and academia, a lack of role models or different career aspirations.

This experience started the idea of organising a workshop on gender issues in hydrology, with the aim of raising awareness of unconscious biases, offer role models and discuss ideas on how to make the hydrologic community more diverse. Although the focus of the workshop was on gender diversity, most things we learned apply as well to issues related to misrepresentation of ethnic minorities or disabled scientists.

To achieve the aims mentioned above, the workshop included: three invited speakers (Prof Hannah Cloke, Dr Joshua Larsen, Prof Elena Toth) who shared their experiences regarding gender issues in hydrology; a talk and a training on unconscious biases (Prof Havi Carel); and a group discussion. The workshop was attended by 44 hydrologists, mainly PhD students, of which 28 were female and 16 were male.

One highlight of the day was the presentation of Hannah Cloke talking about her career progress to full professor while at the same time raising four kids. Together with Elena Toth and Joshua Larsen, she agreed that combining academia and raising a family is possible, because academia offers one of the most flexible work environments possible. However, it does need a supportive stance of the university to enable that flexibility (flexitime working hours, childcare facilities, flexible childcare support for conferences) and supportive colleagues. Hannah finished with good advice for all PhD students, but especially women or members of minorities: A work-family-life balance is essential. Say no before you are overwhelmed and exhausted, but: be brave! Say yes to opportunities that scare you and do great science! And encourage each other to be brave. This is definitely advice I will try to implement in my life.

The afternoon included an unconscious bias training by Professor Havi Carel (watch her TED talk about unconscious bias) and group discussions around how academia can become more diverse and how we can create an enjoyable academic environment.

Some of the topics we discussed were:

What can senior and peer colleagues do?

Often postgraduate and early career researchers suffer from lack of communication at their institutions. Peer-to-peer mentoring or senior-to-junior mentoring may offer opportunities for discussion to take place, particularly about equality/inclusion/diversity issues. When exclusion/discrimination problems are experienced/witnessed, having a range of peer and senior people to discuss with becomes very important, and facilitates reporting to leadership if needed. These meetings and discussions will also give opportunities to people who may otherwise feel their problems are overlooked, to find support, be empowered and build up their self-confidence.

What can leadership do?

To specifically include researchers with caring responsibilities some attendees mentioned that it would be helpful if institutions could improve access to affordable childcare – this may include nurseries at University as well as more flexible reimbursement for childcare during specific events, such as conferences, where children cannot be brought along by parents.

What is the role of role models?

The attendees agreed that role models can be vital in shaping career pathways as they inspire, work as advisors and can start or change career aspirations. Role models should be relatable (by gender, ethnicity, etc.) and are thus not always available in less diverse environments. However, if role models do not exist new ways to develop them can be used and should be encouraged. For example, Twitter or other social media can offer a great selection of diverse role models from all over the world.

What is success in academia (or in life)?

Success can be defined in many ways. Some people want to make a difference, some want to publish high quality material, some want a good work-family-life balance, and some want all of those together. This highlights how important it is for line managers, supervisors, and colleagues to accept and nurture this diversity. A redefinition of success should be flexible and shaped according to the people in a certain work environment. This will hopefully lead to a more enjoyable and a more productive work environment.

The feedback we received from the day was overwhelmingly positive. This includes both talking to attendees and evaluating questionnaires people filled out at the end of the day. The discussions about the topics and the opportunity to share experiences with others were found the highlights of the workshop. A large part of the participants felt more aware about biases and more empowered to tackle them. Some changes are already happening as a result of the workshop, for example our research group is diversifying social activities to be more inclusive, and both the British Hydrological Society as well as the Young Hydrologic Society have appointed EDI (Equality, Diversity & Inclusion) champions now! With one third of the 44 attendees being male, the workshop demonstrated that not just women are interested to learn about biases and discuss their experiences.

We thank the GW4 Water Security Alliance, the Cabot Institute and the School of Engineering of Bristol University for funding this event. A big thank you to our three speakers and Havi Carel who conducted the training, and to all attendees for creating an inclusive and productive atmosphere. Now it is our task to implement what we have learned and communicate the results as widespread as possible. And on a personal note, I definitely feel there is a future in academia for me now.

If you are interested in organising a similar event at your institution and have any questions, feel free to contact us: hydro-equality2019@bristol.ac.uk

Further information and material can be found on our website.

Some further reading about the topic of diversity and bias in STEM, including a list of scientific literature documenting the challenges women and minorities face in STEM subjects.

———————————-
This blog was written by Cabot Institute member Lina Stein and other members of the organising committee, a hydrology PhD student in the Department of Civil Engineering at the University of Bristol.