Wheel of Time is set thousands of years from now, yet it’s still burdened with today’s climate change

The epic fantasy series has been turned into a tv show on Amazon.
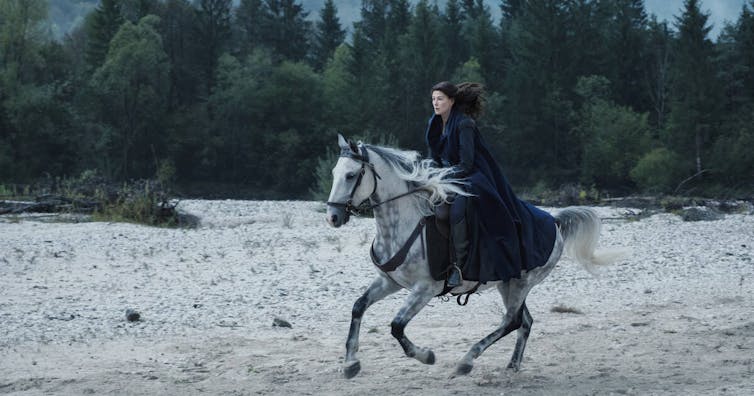
JAN THIJS/AMAZON STUDIOS

Wheel of Time, the 14-book epic fantasy now turned into an Amazon Prime TV series, is a medieval-style adventure set in the Third Age of the World of the Wheel. While not explicit in the storyline, notes from the late author suggest that the First Age was actually modern-day Earth, which ended with a dramatic event (perhaps even climate change). From these notes, we estimate the show takes place around 18,000 years from today.

For climate scientists like us, this poses an interesting question: would today’s climate change still be experienced in the World of the Wheel, even after all those centuries?

About a quarter of carbon dioxide emitted today will remain in the atmosphere even 18,000 years from now. According to biogeochemistry models, carbon dioxide levels could be as high as 1,100 parts per million (ppm) at that point. That’s compared with a present-day value of 415ppm. This very high value assumes that the Paris climate goals will be exceeded and that many natural stores of carbon will also be released into the atmosphere (melting permafrost, for instance).

But the high carbon dioxide concentrations do not necessarily mean a warmer climate. That’s because, over such a long period, slow changes in the orbit and tilt of the planet become more important. This is known as the Milankovitch Cycle and each cycle lasts for around 100,000 years. Given that we are currently at the peak of such a cycle, the planet will naturally cool over the next 50,000 years and this is why scientists were once worried about a new ice age.

But will this be enough to offset the warming from the remaining carbon dioxide in the atmosphere? The image below shows a version of the classic warming stripes, a ubiquitous symbol of the past 150 years of climate change, but instead applied over 1 million years:

Annotated stripes
Warming stripes of Earth (and the World of the Wheel) for a million years. Today’s climate crisis will disrupt the Milankovitch cycle and its effects will last for many thousands of years.
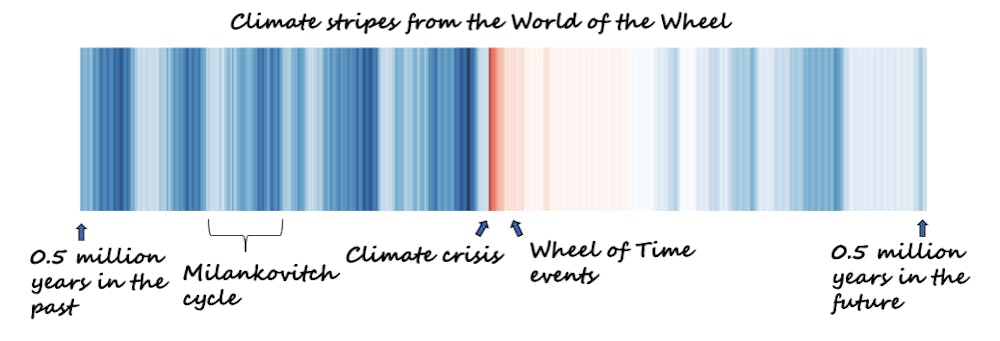
Authors modified from Dan Lunt et al, Author provided

You can clearly see the 100,000 year Milankovitch cycles. Anything red can be considered anthropogenic climate change, and the events of the Wheel of Time are well within this period. Even the descending Milankovitch cycle won’t be enough to counteract the increased warming from carbon dioxide, and so the inhabitants of the World of the Wheel would still experience elevated temperatures from a climate crisis that occurred 18,000 years ago.

Simulating the weather of the World

However, some of the weather changes from the still-elevated temperatures could be offset by other factors. Those 18,000 years aren’t very long from a geological perspective, so in normal circumstances the landmasses would not change significantly. However, in this fantasy future magical channelers “broke” the world at the end of the Second Age, creating several new supercontinents.

To find out how the climate would work in the World of the Wheel, we used an exoplanet model. This complex computer program uses fundamental principles of physics to simulate the weather patterns on the hypothetical future planet, once we had fed in its topography based on hand-drawn maps of the world, and carbon dioxide levels of 830ppm based on one of the high potential future carbon pathways.

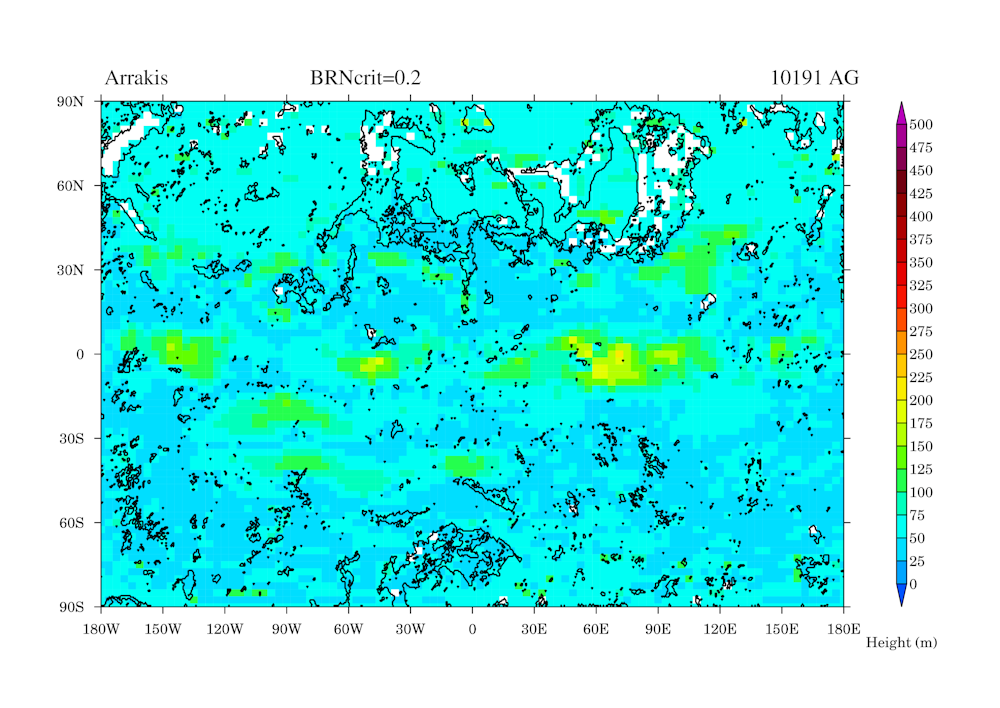
According to our model, the World of the Wheel would be warm all over the surface, with temperatures over land never being cold enough for snow apart from on the mountains. No chance of a white Christmas in this future. Here the story and the science diverge, as at times snow is mentioned in the Wheel of Time. The long-term effects of climate change may have surpassed the imagination of its author, the late great Robert Jordan.

An animated map with arrows
A simulation focused on where The Wheel of Time events take place, showing surface winds (white arrows).
climatearchive.org, Author provided

The World of the Wheel would have stronger and wavier high-altitude jet streams than modern-day Earth. This is likely because there are more mountain ranges in the World of the Wheel, which generate atmospheric waves called Rossby waves, causing oscillations in the jet. There is some limited evidence that the jet stream gets wavier with climate change as well, although this is likely to be less important than the mountain ranges. The jet would bring moisture from the western ocean on to land, and deposit it north of the Mountains of Dhoom. Surprising then, that this region (The Great Blight) is so desert-like in the books – perhaps there is some magic at play to explain this.

Our simulation of the World of the Wheel, showing the jet stream (red and yellow arrows), surface winds (white arrows) and cloud cover (white mist). Source: https://climatearchive.org/wot.

Winds would often revolve around two particularly enormous mountains, Dragonmount and Shayol Ghul, before blowing downslope and reaching far across the land masses. The peak of Dragonmount itself is nearly always surrounded by clouds, and this is because the mountain is so large the winds travelling up it force surface moisture to higher altitudes, thus cooling it, and forming clouds.

The fact winds would be so different from modern-day Earth is predominantly caused by topography, not the underlying increased temperatures from climate change. Nevertheless, in the World of the Wheel, it is clear that despite the extremely long time since carbon polluted the atmosphere, the inhabitants are still exposed to warmer than usual temperatures.

Acknowledging just how long the effects of climate change will persist for should be a catalyst for change. Yet, even after accepting the facts, we face psychological barriers to subsequent personal action, not least because comprehending the timescales of climate change requires a considerable degree of abstraction. But, given the known changes in extreme weather from climate change, and given how long these changes will remain, we must ask ourselves: how would the mysterious and powerful Aes Sedai stop the climate crisis?The Conversation

—————————

This blog is by Caboteers Professor Dann Mitchell, Professor of Climate Science, University of Bristol; Emily Ball, PhD Candidate, Climate Science, University of Bristol; Sebastian Steinig, Research Associate in Paleoclimate Modelling, University of Bristol; and Rebecca Áilish Atkinson, Research Fellow, Cognitive Psychology, University of Sussex.

This article is republished from The Conversation under a Creative Commons license. Read the original article.

Dune: how high could giant sand dunes actually grow on Arrakis?

Frank Herbert first published his science-fiction epic Dune back in 1965, though its origins lay in a chance encounter eight years previously when as a journalist he was tasked to report on a dune stabilisation programme in the US state of Oregon. Ultimately, this set the wheels in motion for the recent film adaptation.

The large and inhospitable sand dunes of the desert planet Arrakis are, of course, very prominent in both the books and film, not least because of the terrifying gigantic sandworms that hunt any movement on the surface. But just how high would sand dunes be on a realistic version of this world?

Before the movie was released, we took a scientific climate model and used it to simulate the climate of Arrakis. We now want to use insights from this same model to focus on the dunes themselves.

Sand dunes are the product of thousands or even tens of thousands of years of erosion of the underlying or surrounding geology. On a simple level, they are formed by sand being blown along the path of the prevailing wind until it meets an obstruction, at which point the sand will settle in front of it.

There is certainly no shortage of wind on Arrakis. Our simulation showed that wind would routinely exceed the minimum speed required to blow sand grains into the air, and there are even some regions where speeds regularly reach 162 km/h during the year. That’s well over hurricane force.

Diagram of sand dune formation
How sand dunes are formed. David Tarailo / US National Park Service / Geological Society of America

Sand dunes in the book are said to be on average around 100 metres high. However, this isn’t based on actual science, more likely it’s what Herbert knew from his time in Oregon as well as the world we live in. But we can use our climate model to predict what the general (and maximum) attainable height might suggest.

Where the wind blows

The size and distance between giant dunes are determined not simply by the type of sand or underlying rock, but by the lowest 2km or so of the atmosphere that interacts with the land surface. This level, also known as the planetary boundary layer, is where most of the weather we can see occurs. Above this, a thin “inversion layer” separates the weather below from the more stable higher-altitude part of the atmosphere.

The growth of sand dunes and theoretical height is determined by the depth of this boundary layer where the wind blows. Sand dunes stabilise above the wind at the altitude of the inversion layer. The height of the boundary layer – usually somewhere between 100 metres to 2,000 metres – can vary through the night as well as the year. When it is cooler, it is shallower. When there is a strong wind or lots of rising warm air, it is deeper.

Arrakis would be much hotter than Earth, which means more rising air and a boundary layer two to three times as high over land compared with ours. Our climate model simulation, therefore, predicts dunes on Arrakis would be as high as 250m, particularly in the tropics and mid-latitudes. That’s about three times the height of the Big Ben clock tower in London. Most regions would have a more modest average height of between 25m and 75m. As the boundary layer is generally higher everywhere on Arrakis the average dune height is in general twice that of Earths.

map with shaded areas
Predicted sand dune height (in metres) on Arrakis. Farnsworth et alAuthor provided

We were also able to simulate the space between dunes, which can also be determined by the height of the boundary layer. Spacing is highest in the tropics, a little over 2km between the crest of one giant sand dune to the next. However, in general, sand dunes have a spacing of around 0.5 to 1km crest to crest. Still plenty of room for a sandworm to wiggle through. Scientists looking at Saturn’s moon Titan have run this same process in reverse, using the space between dunes – easy to measure with satellite images – to estimate a boundary layer of up to 3km.

As nothing can grow on Arrakis to stabilise these sand dunes they will always be in a state of constant drift across the planet. Some large dunes on Earth can move about 5m a year. Smaller dunes can move even faster – about 20m a year.

A visualisation of the authors’ climate model of Arrakis. Source: climatearchive.org/dune.

Mountain-sized dunes?

Our simulation can only give the general height that most sand dunes would reach, and there would be exceptions to the rule. For instance, the largest known sand dune on Earth today is the Duna Federico Kirbus in Argentina, a staggering 1,234m in height. Its size shows that local factors, such as vegetation, surrounding hills or the type of local sand, can play an important role.

Given Arrakis is hotter than Earth, has a higher boundary layer and has more sand and stronger winds, it’s possible a truly mammoth dune the size of a small mountain may form somewhere – it’s just impossible for a climate model to say exactly where.

Scientists have recently revealed that as the world warms the planetary boundary layer is increasing by around 53 metres a decade. So we may well see even bigger record-breaking sand dunes as the lower atmosphere continues to warm – even if Earth will not end up like Arrakis.The Conversation

—————————–

This blog is written by Caboteers Dr Alex Farnsworth, Senior Research Associate in Meteorology, University of Bristol and Dr Sebastian Steinig, Research Associate in Paleoclimate Modelling, University of Bristol and Dr Michael Farnsworth, Research Lead Future Electrical Machines Manufacturing Hub, University of Sheffield,

This article is republished from The Conversation under a Creative Commons license. Read the original article.

Cutting edge collaborative research – using climate data to advance understanding


Perhaps you saw my recent blog post about an upcoming University of Bristol-led hackathon, which was to be part of a series following the Met Office’s Climate Data Challenge in March. The University of Bristol hackathon took place virtually earlier this month and was opened out to all UK researchers to produce cutting-edge research using Climate Model Intercomparison Project 6 (CMIP6) data. The event themes ranged from climate change to oceanography, biogeochemistry and more, and, as promised, here’s what happened.

An enabling environment

The event wouldn’t have run smoothly without the hard work of the organising team including James Thomas from the Jean Golding Institute who set up all the Github documentation and provided technical support prior and during the hackathon event. The hackathon was also a great opportunity to road test a new collaboration space that the Centre for Environmental Data Analysis (CEDA) have developed to provide a new digital platform, JASMIN Notebook Service.

As part of the introduction to the event, Professor Kate Robson Brown, Jean Golding Institute director, spoke about data science and space-enabled data. This was an excellent talk especially in terms of making connections through data and training events – you can watch her speech here. If you’re interested in more on this, there’s a data week 14-18 June 2021 for University of Bristol and external participants with details here.

Collaborating for results

Altogether there were over 100 participants at the hackathon with people involved from across the Met Office Academic Partnership (MOAP) universities and the Met Office as well as participants from across the world. There were ten project themes for delegates to work around and, as with the Met Office Climate Data Challenge, I was astounded by how far the teams got over the three days. Given the CMIP6 theme, it was great to see many projects advance our understanding by updating and improving previous model evaluation and projection analyses with the new CMIP6 datasets.

Given the work that I am involved in at the Met Office on visualisation and communication, I was particularly impressed by the thought that went into making important Intergovernmental Panel on Climate Change (IPCC) figures interactive. In three days, the team working on this managed to process data and produce a working demonstration that made the results pop out of the page.

Also related to my work on using climate data to understand impacts, another project which caught my eye looked at how the Artic Tern’s migration would be affected by changes in wind regimes and sea ice in the CMIP6 ensemble. Of particular note was the creation of a “digital arctic tern” to simulate their migratory flight path.

What’s next?

There’s lots more I could say about this excellent event, and many thanks to colleagues at the University of Bristol for hosting the hackathon. Now I am looking forward to seeing how some of the work will develop further in terms of journal papers and potentially being showcased at the UN Climate Change Conference (COP26) in Glasgow in November.

#ClimateDataChallenge

—————————-

This blog is written by Dr Fai Fung, Science Manager at the Met Office and Senior Research Fellow at the University of Bristol.

Dr Fai Fung


Hydrological modelling and pizza making: why doesn’t mine look like the one in the picture?

Is this a question that you have asked yourself after following a recipe, for instance, to make pizza?

You have used the same ingredients and followed all the steps and still the result doesn’t look like the one in the picture…

Don’t worry: you are not alone! This is a common issue, and not only in cooking, but also in hydrological sciences, and in particular in hydrological modelling.

Most hydrological modelling studies are difficult to reproduce, even if one has access to the code and the data (Hutton et al., 2016). But why is this?

In this blog post, we will try to answer this question by using an analogy with pizza making.

Let’s imagine that we have a recipe together with all the ingredients to make pizza. Our aim is to make a pizza that looks like the one in the picture of the recipe.

This is a bit like someone wanting to reproduce the results reported in a scientific paper about a hydrological “rainfall-runoff” model. There, one would need to download the historical data (rainfall, temperature and river flows) and the model code used by the authors of the study.

However, in the same way as the recipe and the ingredients are just the start of the pizza making process, having the input data and the model code is only the start of the modelling process.

To get the pizza shown in the picture of the recipe, we first need to work the ingredients, i.e. knead the dough, proof and bake. And to get the simulated river flows shown in the study, we need to ‘work’ the data and the model code, i.e. do the model calibration, evaluation and final simulation.

Using the pizza making analogy, these are the correspondences between pizza making and hydrological modelling:

Pizza making                         Hydrological modelling

kitchen and cooking tools computer and software

ingredients                         historical data and computer code for model simulation

recipe                                 modelling process as described in a scientific paper or in a computer                                                         script / workflow

Step 1: Putting the ingredients together

Dough kneading

So, let’s start making the pizza. According to the recipe, we need to mix well the ingredients to get a dough and then we need to knead it. Kneading basically consists of pushing and stretching the dough many times and it can be done either manually or automatically (using a stand mixer).

The purpose of kneading is to develop the gluten proteins that create the structure and strength in the dough, and that allow for the trapping of gases and the rising of the dough.The recipe recommends using a stand mixer for the kneading, however if we don’t have one, we can do it manually.

The recipe says to knead until the dough is elastic and looks silky and soft. We then knead the dough until it looks like the one in the photo shown in the recipe.

Model calibration

Now, let’s start the modelling process. If the paper does not report the values of the model parameters, we can determine them through model calibration. Model calibration is a mathematical process that aims to tailor a general hydrological model to a particular basin. It involves running the model many times under different combinations of the parameter values, until one is found that matches well the flow records available for that basin. Similarly to kneading, model calibration can be manual, i.e. the modeller changes manually the values of the model parameters trying to find a combination that captures the patterns in the observed flows (Figure 1), or it can be automatic, i.e. a computer algorithm is used to search for the best combination of parameter values more quickly and comprehensively.

Figure 1 Manual model calibration. The river flows predicted by the model are represented by the blue line and the observed river flows by the black line (source: iRONS toolbox)

According to the study, the authors used an algorithm implemented in an open source software for the calibration. We can download and use the same software. However, if any error occurs and we cannot install it, we could decide to calibrate the model manually. According to the study, the Nash-Sutcliffe efficiency (NSE) function was used as numerical criteria to evaluate the calibration obtaining a value of 0.82 out of 1. We then do the manual calibration until we obtain NSE = 0.82.

(source: iRONS toolbox)

Step 2: Checking our work

Dough proofing

In pizza making, this step is called proofing or fermentation. In this stage, we place the dough somewhere warm, for example close to a heater, and let it rise. According to the recipe, the proofing will end after 3 hours or when the dough has doubled its volume.

The volume is important because it gives us an idea of how strong the dough is and how active the yeast is, and hence if the dough is ready for baking. We let our dough rise for 3 hours and we check. We find out that actually it has almost tripled in size… “even better!” we think.

Model evaluation

In hydrological modelling, this stage consists of running the model using the parameter values obtained by the calibration but now under a different set of temperature and rainfall records. If the differences between estimated and observed flows are still low, then our calibrated model is able to predict river flows under meteorological conditions different from the one to which it was calibrated. This makes us more confident that it will work well also under future meteorological conditions. According to the study, the evaluation gave a NSE = 0.78. We then run our calibrated model fed by the evaluation data and we get a NSE = 0.80… “even better!” we think.

Step 3: Delivering the product!

Pizza baking

Finally, we are ready to shape the dough, add the toppings and bake our pizza. According to the recipe, we should shape the dough into a round and thin pie. This takes some time as our dough keeps breaking when stretched, but we finally manage to make it into a kind of rounded shape. We then add the toppings and bake our pizza.

Ten minutes later we take the pizza out of the oven and… it looks completely different from the one in the picture of the recipe! … but at least it looks like a pizza…

(Source: flickr.com)

River flow simulation

And finally, after calibrating and evaluating our model, we are ready to use it to simulate recreate the same river flow predictions as shown in the results of the paper. In that study, they forced the model with seasonal forecasts of rainfall and temperature that are available from the website of the European Centre for Medium-range Weather Forecasts (ECMWF).

Downloading the forecasts takes some time because we need to write two scripts, one to download the data and one to pre-process them to be suitable for our basin (so called “bias correction”). After a few hours we are ready to run the simulation and… it looks completely different from the hydrograph shown in the study! … but at least it looks like a hydrograph…

Why we never get the exact same result?

Here are some possible explanations for our inability to exactly reproduce pizzas or modelling results:

  • We may have not kneaded the dough enough or kneaded it too much; or we may have thought that the dough was ready when it wasn’t. Similarly, in modelling, we may have stopped the calibration process too early or too late (so called “over-fitting” of the data).
  • The recipe does not provide sufficient information on how to test the dough; for example, it does not say how wet or elastic the dough should be after kneading. Similarly, in modelling, a paper may not provide sufficient information about model testing as, for instance, the model performance for different variables and different metrics.
  • We don’t have the same cooking tools as those used by the recipe’s authors; for example, we don’t have the same brand of the stand mixer or the oven. Similarly, in modelling we may use a different hardware or operating system, which means calculations may differ due to different machine precision or slightly different versions of the same software tools/dependencies.
  • Small changes in the pizza making process, such as ingredients quantities, temperature and humidity, can lead to significant changes in the final result, particularly because some processes, such as kneading, are very sensitive to small changes in conditions. Similarly, small changes in the modelling process, such as in the model setup or pre-processing of the data, can lead to rather different results.

In conclusion…

Setting up a hydrological model involves the use of different software packages, which often exist in different versions, and requires many adjustments and choices to tailor the model to a specific place. So how do we achieve reproducibility in practice? Sharing code and data is essential, but often is not enough. Sufficient information should also be provided to understand what the model code does, and whether it does it correctly when used by others. This may sound like a big task, but the good news is that we have increasingly powerful tools to efficiently develop rich and interactive documentation. And some of these tools, such as R Markdown or Jupyter Notebooks, and the online platforms that support them such as Binder, enable us not only to share data and code but also the full computational environment in which results are produced – so that others have access not only to our recipes but can directly cook in our kitchen.

—————————

This blog has been reposted with kind permission from the authors, Cabot Institute for the Environment members Dr Andres Peñuela, Dr Valentina Noacco and Dr Francesca Pianosi. View the original post on the EGU blog site.

Andres Peñuela is a Research Associate in the Water and Environmental Engineering research group at the University of Bristol. His main research interest is the development and application of models and tools to improve our understanding on the hydrological and human-impacted processes affecting water resources and water systems and to support sustainable management and knowledge transfer


Valentina Noacco is a Senior Research Associate in the Water and Environmental Engineering research group at the University of Bristol. Her main research interest is the development of tools and workflows to transfer sensitivity analysis methods and knowledge to industrial practitioners. This knowledge transfer aims at improving the consideration of uncertainty in mathematical models used in industry


Francesca Pianosi is a Senior Lecturer in Water and Environmental Engineering at the University of Bristol. Her expertise is in the application of mathematical modelling to hydrology and water systems. Her current research mainly focuses on two areas: modelling and multi-objective optimisation of water resource systems, and uncertainty and sensitivity analysis of mathematical models.


For humanity to thrive, we need engineers who can lead with a conscience

Dr Hadi Abulrub argues the key to facing environmental challenges lies in intelligent manufacturing, smart infrastructure, sustainable energy and engineering modelling.

Creativity and innovation have been the drivers of social, economic and cultural progress for millennia. The Industrial Revolution accelerated our capacities and there has been exponential growth ever since – in the products and services we use to enhance our lives as much as the number of people across the world for whom these tools have become indispensable.

But have the costs been worth it?

Judging by the state of the world, the answer is no. We live in turbulent times, resulting in large part from our over-reliance on the Earth’s resources. And the stakes are high, especially in the context of the United Nations’ 2030 Agenda for the Sustainable Development Goals (SDGs) – a mere ten years remain to meet the ambitious task of setting the world on a more viable path for the sake of our collective prosperity.

How can we fulfil the complex needs of a growing population in a way that can both extend the lifespan of the finite resources that remain, and ensure the prosperity of future generations?

Conscience over convenience

Responsible consumption and production is the focus of the UN’s 9th SDG which highlights the scale and urgency of the challenge: the acceleration of worldwide material consumption has led to the over-extraction and degradation of environmental resources. According to the UN, in 1990 some 8.1 tons of natural resources were used to satisfy a person’s need, while in 2015, almost 12 tons of resources were extracted per person.

As the SDGs emphasise, the only way through is via inclusive industrialisation and innovation, sustainable economic growth, affordable energy and sustainable management of the Earth’s resources.

Recent years have seen an exceptional rise in our environmental consciousness, with consumers making more discerning choices about what and how much they buy and who they buy from. The growth of the sharing economy is further evidence of this shift in mindset towards a value-based economy, where people are increasingly looking to rent, recycle and reuse.

Corporations are responding in a similar vein. Whereas once the linear model of extraction, manufacture, distribution, consumption and disposal reigned supreme, more companies now realise that the resulting material waste and environmental damage is neither justifiable nor sustainable.

The circular economy

There is hope in the emerging model of closed-loop manufacturing and production, where there is a longer-term view focused on ensuring lasting quality and performance. Waste is being designed out of the process, with a greater focus on resource. For instance, the Belfast-based lighting manufacturer Lumenstream is using service-based business models to disrupt the industry with a servitised approach.

Servitisation means that goods are lent to customers in such a way that the company maintains full ownership of its products, from manufacture through to repair, to recycling. The company, the customer and the product are part of one interdependent ecosystem. The customer receives all the benefit without the need to worry about the physical product itself.

Liberation and leadership

One of the effects of the digitised world has been the accelerated march towards automation. According to research carried out by the McKinsey Global Institute, about half the activities people are paid for, which equates to almost $15 trillion in wages in the global economy, could be automated by around 2055.

Some argue this signals the redundancy of the human workforce. Is that really true? Are we not capable and intelligent enough to see things differently?

After all, how we respond, and whether the economy, the planet and people suffer or thrive will depend on a radical shift in our thinking. Building a more sustainable economy will require us to reimagine the world, while applying some creative problem-solving, logical thinking, and socio-cultural and emotional intelligence – qualities that are the sole preserve of human ingenuity.

As researchers, educators and scientists, engineering a brighter future has to be our focus.

This is why at the University of Bristol, we’re committed to supporting the future leaders in the engineering sector who will take the helm in intelligent manufacturing, smart infrastructure, sustainable energy and engineering modelling.

Redefining our humanity

This shift in awareness is something that I see on a daily basis, in the perspectives of the students who join us and in the way they view the challenges we face – in an educational setting and in a global context.

The so-called Fourth Industrial Revolution is already underway, which is concerned with maximising human health and wellbeing, facilitating interconnectivity and safeguarding our shared planet. These are the concerns of students who are seeking to make a difference in the world by developing the skills they need to become active agents for progressive change.

It’s this conscientious spirit, combined with entrepreneurial drive that has the potential to come up with a solution to the complex needs of a global society.

The next generation will effectively be responsible for redefining our humanity in a digitised world. It’s an immense challenge – and a tremendous opportunity to influence our collective future.

————————————-

This blog is written by Cabot Institute member Dr Hadi Abulrub, from the Faculty of Engineering at the University of Bristol. Hadi is also the Programme Director of the new MSc in Engineering with Management, designed for graduates who wish to lead in the new era of engineering and technology.  This blog was reposted from the Faculty of Engineering blog. View the original post.

Hadi Abulrub


Predicting the hazards of weather and climate; the partnering of Bristol and the Met Office

Image credit Federico Respini on Unsplash

When people think of the University of Bristol University, or indeed any university, they sometimes think of academics sitting in their ivy towers, researching into obscurities that are three stages removed from reality, and never applicable to the world they live in. Conversely, the perception of the Met Office is often one of purely applied science, forecasting the weather; hours, days, and weeks ahead of time. The reality is far from this, and today, on the rather apt Earth Day 2020, I am delighted to announce a clear example of the multidisciplinary nature of both institutes with our newly formed academic partnership.

This new and exciting partnership brings together the Met Office’s gold standard weather forecasts and climate projections, with Bristol’s world leading impact and hazard models. Our partnership goal is to expand on the advice we already give decision makers around the globe, allowing them to make evidence-based decisions on weather-related impacts, across a range of timescales.

By combining the weather and climate data from the Met Office with our hazard and impact models at Bristol, we could, for instance, model the flooding impact from a storm forecasted a week ahead, or estimate the potential health burden from heat waves in a decade’s time. This kind of advanced knowledge is crucial for decision makers in many sectors. For instance, if we were able to forecast which villages might be flooded from an incoming storm, we could prioritise emergency relief and flood defenses in that area days ahead of time. Or, if we projected that hospital admissions would increase by 10% due to more major heatwaves in London in the 2030s, then decision makers could include the need for more resilient housing and infrastructure in their planning. Infrastructure often lasts decades, so these sorts of decisions can have a long memory, and we want our decision makers to be proactive, rather than reactive in these cases.

While the examples I give are UK focussed, both the University of Bristol and the Met Office are internationally facing and work with stakeholders all over the world. Only last year, while holding a workshop in the Caribbean on island resilience to tropical cyclones; seeing the importance of our work the prime minister of Jamaica invited us to his residence for a celebration. While I don’t see this happening with Boris Johnson anytime soon, it goes to show the different behaviours and levels of engagement policy makers have in different countries. It’s all very well being able to do science around the world, but if you don’t get the culture, they won’t get your science. It is this local knowledge and connection that is essential for an international facing partnership to work, and that is where both Bristol and the Met Office can pool their experience.

To ensure we get the most out of this partnership we will launch a number of new joint Bristol-Met Office academic positions, ranging from doctoral studentships all the way to full professorships. These positions will work with our Research Advisory Group (RAP), made up of academics across the university, and be associated with both institutes. The new positions will sit in this cross-disciplinary space between theory and application; taking a combined approach to addressing some of the most pressing environmental issues of our time.

As the newly appointed Met Office Joint Chair I will be leading this partnership at Bristol over the coming years, and I welcome discussions and ideas from academics across the university; some of the best collaborations I’ve had have come from a random knock on the door, so don’t be shy in sharing your thoughts.

———————————
This blog is written by Dr Dann Mitchell – Met Office Joint Chair and co-lead of the Cabot Institute for the Environment’s Natural Hazards and Disaster Risk research.
You can follow him on Twitter @ClimateDann.

Dann Mitchell