How do you manage a dam when there’s a tropical cyclone in Mozambique?

Mozambique dam

I’d never given a huge amount of thought of what a dam manager did until I visited Pequenos Libombos dam in Mozambique in October 2023. Standing at the dam, in hot conditions, listening to the lived experience of people who work on the ground and explain what they do during a tropical cyclone leaves you with more understanding than any peer reviewed journal article. Context is everything. It’s why visiting the countries I’m researching is something I do given the chance.

That’s what members of Bristol projects REPRESA (co-led by Prof Elizabeth Kendon at University of Bristol & UK Met Office, Dr Luis Artur from Eduardo Mondlane University and Prof Francois Engelbrecht from University of the Witwatersrand) and SALIENT (led by Dr Rachel James, University of Bristol) did in October. The REPRESA project aims to understand compound tropical cyclone risks, impacts of tropical cyclones and improve early warning systems in Mozambique, Malawi and Madagascar. Seeing the research alignment in projects, the SALIENT team also joined. The SALIENT project aims to improve the characterisation and communication of future climate information for national adaptation planning in southern Africa.

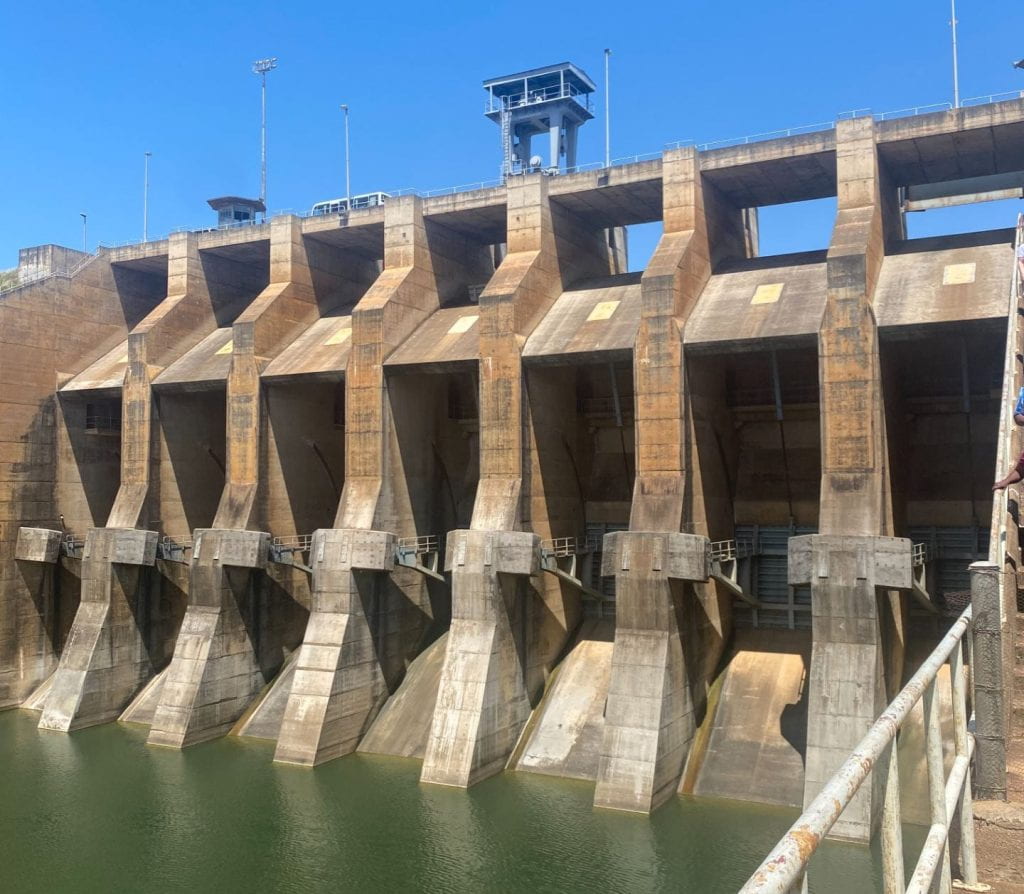
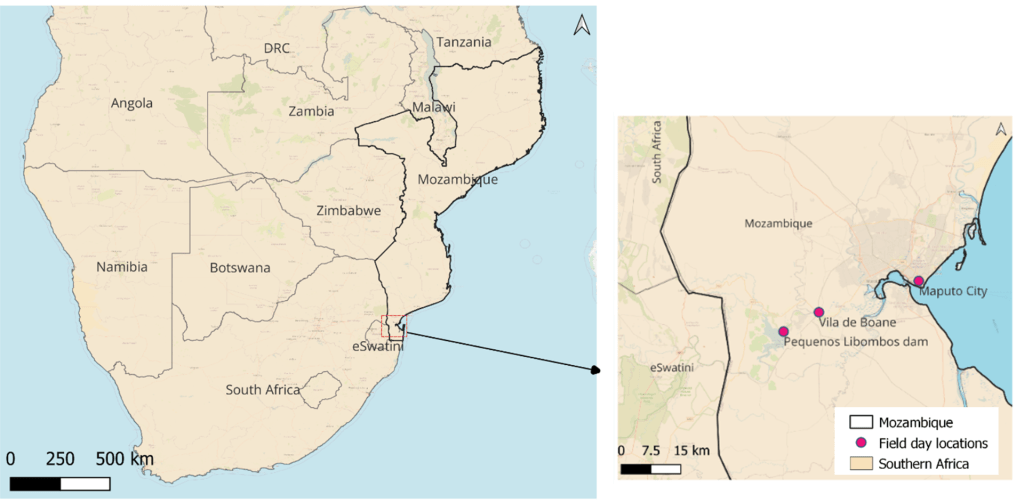
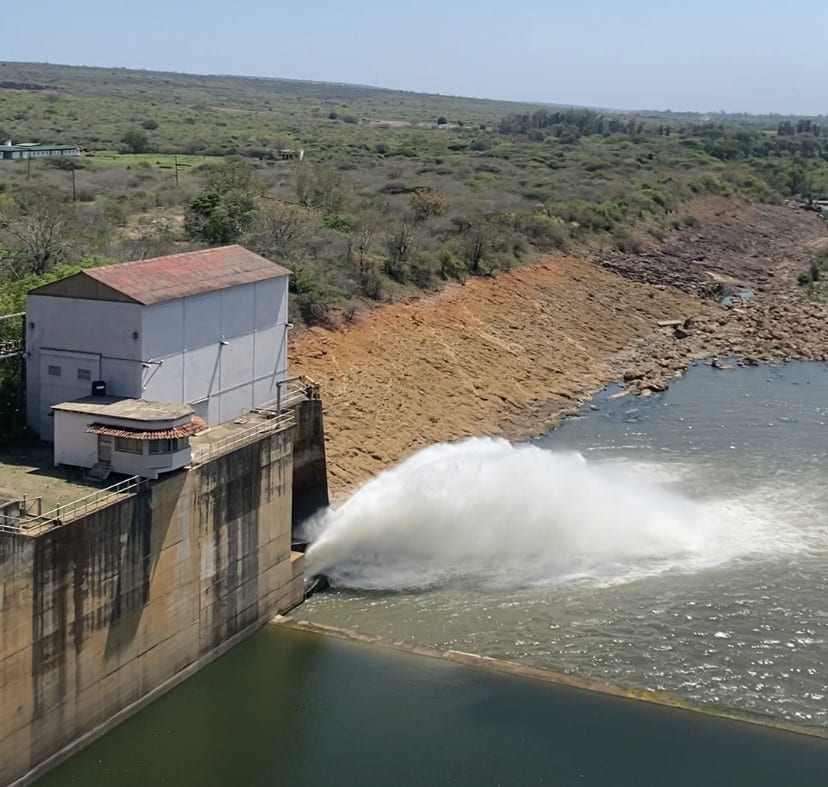
On the field trip day, we travelled to Pequenos Libombos dam and heard from a government official from the Vila De Boane Municipality. It was this day where I had my epiphany that if I ever left academia, dam management is not my calling. Providing water to the local population is the dams primary role and it provides 2 million people within Maputo Province with access to water. That is more than 4 times the population of Bristol.

The management of Pequenos Libombos dam is difficult as there are many other people and industries to consider and keep safe and happy when making decisions. From the businesses who want to use the dam’s water for industrial purposes to the farming communities that are reliant on the water for irrigation, and hydroelectricity companies that want to use the dam to create energy to the communities downstream that may be flooded if the dam releases water too quickly. The dam catchment is also shared with 2 of Mozambique’s neighbouring countries; eSwatini and South Africa, adding another element of complexity to the dams management.

Management must carefully balance both periods of water surplus and deficit and Maputo has experienced numerous extreme weather events in recent years.  The 2015-2016 southern African drought impacted Central and Southern Mozambique and more recently the remnants of tropical cyclones in 2019, 2011, 2022 and 2023. During February 2023, Tropical Cyclone (TC) Freddy passed over Madagascar and southern Mozambique before returning a couple of weeks later to central Mozambique. It is thought to be the longest lived and have the highest accumulated cyclone energy of any cyclone on record, awaiting formal investigation from the World Meteorological Organization. Although TC Freddy didn’t directly pass over Pequenos Limbombos, its associated rainfall resulted in 250 mm of rainfall at the dam in one day. For context, the Bristol experiences 265mm rainfall, on average, in October, November and December combined. To avoid a breach of the dam, discharge was released at the maximum rate, which is more than 500 time more than normal.

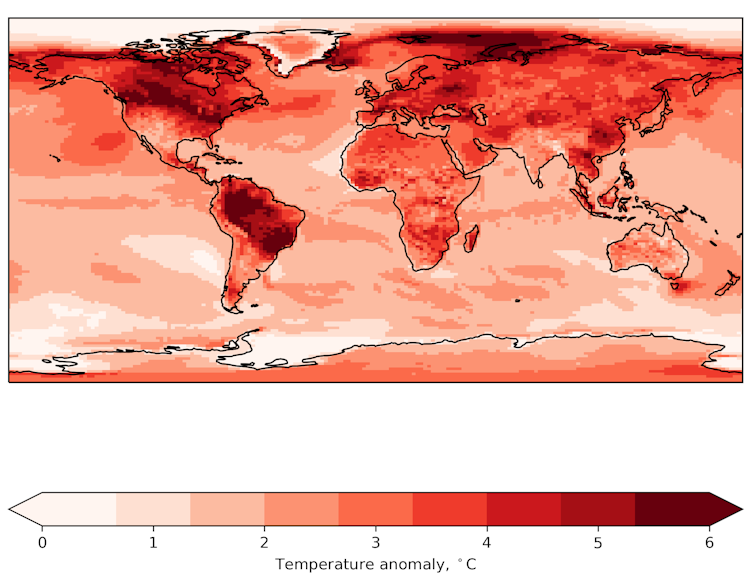
Globally there is evidence that TCs and their impacts are being impacted by climate change. The frequency, intensity and storm tracks of TCs may be changing meanwhile, rising sea levels may lead to higher storm surges. Yet we know a limited amount about how tropical cyclones may act in a future with increased global sea surface and air temperatures.  TCs in the Indian Ocean are particularly under researched, but recent and frequent events have highlighted the importance of understanding TCs in a changing climate.

After hearing about the vast amount of rain that fell in February 2023, we walk past the disused hydroelectric generator that was forced to cease operation during the drought as it was no longer economically viable. It really hammered home the complexities faced when trying to manage such a huge piece of infrastructure during extreme events. Similarly, it is clear why research projects like REPRESA and SALIENT are needed to understand how tropical cyclones may behave in the future and explore how early warning systems and climate change adaptation can be strengthened.

Mozambique dam

The human side of extreme weather

After the talk at Pequenos Libombos Dam, we visited the Municipality of Vila de Boane. Vila de Boane is located roughly 15 km downstream from the dam and the River Umbuluzi passes through the municipality. The municipality experienced large scale flooding after the dam was forced to increase to maximum discharge during the February 2023 rainfall.

Despite already hearing about TC’s Freddy’s impacts at the dam, they were not as focused on the human impact. The leader of the municipality compellingly described how 16,000 people were impacted overnight, 6000 people were displaced and 6 people sadly died. The community water pump was destroyed, leaving people without water for 3 months. The municipality leader said he had never seen that amount of water passing through the municipality at such high speed before. Meanwhile, money that had been budgeted for development initiatives, had to be redirected to repair and response. It was not clear if extra money had been sourced for the development initiatives.

It was also highlighted that the increased release of water from the dam occurred over night with little warning. The municipality had been told to expect “above normal” rainfall and to avoid being close to rivers and move farming machinery further inland. But as the municipality leader questioned, what does “above normal” actually mean? People will perceive this message differently, which will influence how they act upon it. As part of the SALIENT research project, I am researching how we best communicate future climate information to decision makers and this anecdote will stay with me. It’s clear that improved communications are needed in both weather and climate services, something REPRESA is also aiming to research further.

Reflections and collaboration

After hearing about the vast amount of impacts the flooding had on Villa de Boane, we waited for our transport back to Maputo under the shade as it was too hot to stand in the sun. It was clear everyone from the REPRESA and SALIENT teams, both physical scientists and social scientists, had taken a lot from the field day. There was discussion about what the research should consider as well as the different angles that could be taken. It also fostered collaboration, SALIENT team member, Alan-Kennedy Asser, is providing the REPRESA team with analysis of precipitation trends from a multiple ensembles of climate models to characterise the range in future projections over the region. Meanwhile I spoke with some REPRESA team members in more depth about future climate information and will be providing risk communication training session in the future.

My personal key take away is that understanding the context and hearing the lived experiences of people working and living with extreme weather events enriches me as a researcher. Similarly, collaborating with researchers and practitioners on different projects enhances your work by providing questions and inputs from different standpoints. And finally, I’m too indecisive a person to ever be a good dam manager.

——————————————

This blog is written by Cabot Institute for the Environment member, Dr Ailish Craig, School of Geographical Sciences, University of Bristol with contributions from Dr Alan Kennedy-Asser, School of Geographical Sciences, University of Bristol and Dr Rachel James, School of Geographical Sciences, University of Bristol.

Ailish Craig
Dr Ailish Craig

Why 40°C is bearable in a desert but lethal in the tropics

Phew: heat plus humidity can make Bangkok an uncomfortable place in a heatwave.
Pavel V.Khon/SHutterstock

This year, even before the northern hemisphere hot season began, temperature records were being shattered. Spain for instance saw temperatures in April (38.8°C) that would be out of the ordinary even at the peak of summer. South and south-east Asia in particular were hammered by a very persistent heatwave, and all-time record temperatures were experienced in countries such as Vietnam and Thailand (44°C and 45°C respectively). In Singapore, the more modest record was also broken, as temperatures hit 37°C. And in China, Shanghai just recorded its highest May temperature for over a century at 36.7°C.

We know that climate change makes these temperatures more likely, but also that heatwaves of similar magnitudes can have very different impacts depending on factors like humidity or how prepared an area is for extreme heat. So, how does a humid country like Vietnam cope with a 44°C heatwave, and how does it compare with dry heat, or a less hot heatwave in even-more-humid Singapore?

Weather and physiology

The recent heatwave in south-east Asia may well be remembered for its level of heat-induced stress on the body. Heat stress is mostly caused by temperature, but other weather-related factors such as humidity, radiation and wind are also important.

Our bodies gain heat from the air around us, from the sun, or from our own internal processes such as digestion and exercise. In response to this, our bodies must lose some heat. Some of this we lose directly to the air around us and some through breathing. But most heat is lost through sweating, as when the sweat on the surface of our skin evaporates it takes in energy from our skin and the air around us in the form of latent heat.

annotated diagram of person
How humans heat up and cool down.
Take from Buzan and Huber (2020) Annual Review of Earth and Planetary Sciences, Author provided

Meteorological factors affect all this. For example, being deprived of shade exposes the body to heat from direct sunlight, while higher humidity means that the rate of evaporation from our skin will decrease.

It’s this humidity that meant the recent heatwave in south-east Asia was so dangerous, as it’s already an extremely humid part of the world.

The limit of heat stress

Underlying health conditions and other personal circumstances can lead to some people being more vulnerable to heat stress. Yet heat stress can reach a limit above which all humans, even those who are not obviously vulnerable to heat risk – that is, people who are fit, healthy and well acclimatised – simply cannot survive even at a moderate level of exertion.

One way to assess heat stress is the so-called Wet Bulb Globe Temperature. In full sun conditions, that is approximately equivalent to 39°C in temperature combined with 50% relative humidity. This limit will likely have been exceeded in some places in the recent heatwave across south-east Asia.

In less humid places far from the tropics, the humidity and thus the wet bulb temperature and danger will be much lower. Spain’s heatwave in April with maximum temperatures of 38.8°C had WBGT values of “only” around 30°C, the 2022 heatwave in the UK, when temperatures exceeded 40°C, had a humidity of less than 20% and WBGT values of around 32°C.

Two of us (Eunice and Dann) were part of a team who recently used climate data to map heat stress around the world. The research highlighted regions most at risk of exceeding these thresholds, with literal hotspots including India and Pakistan, south-east Asia, the Arabian peninsula, equatorial Africa, equatorial South America and Australia. In these regions, heat stress thresholds are exceeded with increased frequency with greater global warming.

In reality, most people are already vulnerable well below the survivability thresholds, which is why we can see large death tolls in significantly cooler heat waves. Furthermore, these global analyses often do not capture some very localised extremes caused by microclimate processes. For example a certain neighbourhood in a city might trap heat more efficiently than its surroundings, or might be ventilated by a cool sea breeze, or be in the “rain shadow” of a local hill, making it less humid.

Variability and acclimatisation

The tropics typically have less variable temperatures. For example, Singapore sits almost on the equator and its daily maximum is about 32°C year round, while a typical maximum in London in mid summer is just 24°C. Yet London has a higher record temperature (40°C vs 37°C in Singapore).

Given that regions such as south-east Asia consistently have high heat stress already, perhaps that suggests that people will be well acclimatised to deal with heat. Initial reporting suggests the intense heat stress of the recent heatwave lead to surprisingly few direct deaths – but accurate reporting of deaths from indirect causes is not yet available.

On the other hand, due to the relative stability in year-round warmth, perhaps there is less preparedness for the large swings in temperature associated with the recent heatwave. Given that it is not unreasonable, even in the absence of climate change, that natural weather variability can produce significant heatwaves that break local records by several degrees Celsius, even nearing a physiological limit might be a very risky line to tread.

—————————–


This blog is written by Cabot Institute for the Environment members: Dr Alan Thomas Kennedy-Asser, Research Associate in Climate Science; Professor Dann Mitchell, Professor of Climate Science, and Dr Eunice Lo, Research Fellow in Climate Change and Health, University of Bristol. This article is republished from The Conversation under a Creative Commons license. Read the original article.

Alan Kennedy-Asser
Alan Kennedy-Asser
Dann Mitchell
Dann Mitchell
Eunice Lo
Eunice Lo

Insects will struggle to keep pace with global temperature rise – which could be bad news for humans

Animals can only endure temperatures within a given range. The upper and lower temperatures of this range are called its critical thermal limits. As these limits are exceeded, an animal must either adjust or migrate to a cooler climate.

However, temperatures are rising across the world at a rapid pace. The record-breaking heatwaves experienced across Europe this summer are indicative of this. Heatwaves such as these can cause temperatures to regularly surpass critical thermal limits, endangering many species.

In a new study, my colleagues and I assessed how well 102 species of insect can adjust their critical thermal limits to survive temperature extremes. We found that insects have a weak capacity to do so, making them particularly vulnerable to climate change.

The impact of climate change on insects could have profound consequences for human life. Many insect species serve important ecological functions while the movement of others can disrupt the balance of ecosystems.

How do animals adjust to temperature extremes?

An animal can extend its critical thermal limits through either acclimation or adaptation.

Acclimation occurs within an animal’s lifetime (often within hours). It’s the process by which previous exposure helps give an animal or insect protection against later environmental stress. Humans acclimate to intense UV exposure through gradual tanning which later protects skin against harmful UV rays.

One way insects acclimate is by producing heat shock proteins in response to heat exposure. This prevents cells dying under temperature extremes.

A ladybird drinking a speck of water on a narrow leaf.
Insects in warmer environments develop fewer spots to reduce heat retention.
mehmetkrc/Shutterstock

Some insects can also use colour to acclimate. Ladybirds that develop in warm environments emerge from the pupal stage with less spots than insects that develop in the cold. As darker spots absorb heat, having fewer spots keeps the insect cooler.

Adaptation occurs when useful genes are passed through generations via evolution. There are multiple examples of animals evolving in response to climate change.

Over the past 150 years, some Australian parrot species such as gang-gang cockatoos and red-rumped parrots have evolved larger beaks. As a greater quantity of blood can be diverted to a larger beak, more heat can be lost into the surrounding environment.

A colourful red-rumped parrot perched on a branch.
The red-rumped parrot has evolved a larger beak to cope with higher temperatures.
Alamin-Khan/Shutterstock

But evolution occurs over a longer period than acclimation and may not allow critical thermal limits to adjust in line with the current pace of global temperature rise. Upper thermal limits are particularly slow to evolve, which may be due to the large genetic changes required for greater heat tolerance.

Research into how acclimation might help animals survive exceptional temperature rise has therefore become an area of growing scientific interest.

A weak ability to adjust to temperature extremes

When exposed to a 1℃ change in temperature, we found that insects could only modify their upper thermal limit by around 10% and their lower limit by around 15% on average. In comparison, a separate study found that fish and crustaceans could modify their limits by around 30%.

But we found that there are windows during development where an insect has a greater tolerance towards heat. As juvenile insects are less mobile than adults, they are less able to use their behaviour to modify their temperature. A caterpillar in its cocoon stage, for example, cannot move into the shade to escape the heat.

Exposed to greater temperature variations, this immobile life stage has faced strong evolutionary pressure to develop mechanisms to withstand temperature stress. Juvenile insects generally had a greater capacity for acclimating to rising temperatures than adult insects. Juveniles were able to modify their upper thermal limit by 11% on average, compared to 7% for adults.

But given that their capacity to acclimate is still relatively weak and may fall as an insect leaves this life stage, the impact is likely to be limited for adjusting to future climate change.

What does this mean for the future?

A weak ability to adjust to higher temperatures will mean many insects will need to migrate to cooler climates in order to survive. The movement of insects into new environments could upset the delicate balance of ecosystems.

Insect pests account for the loss of 40% of global crop production. As their geographical distribution changes, pests could further threaten food security. A UN report from 2021 concluded that fall armyworm populations, which feed on crops such as maize, have already expanded their range due to climate change.

A damaged corn crop following an attack by fall armyworms.
The fall armyworm is a damaging crop pest which is spreading due to climate change.
Alchemist from India/Shutterstock

Insect migration may also carry profound impacts on human health. Many of the major diseases affecting humans, including malaria, are transmitted by insects. The movement of insects over time increases the possibility of introducing infectious diseases to higher latitudes.

There have been over 770 cases of West Nile virus recorded in Europe this year. Italy’s Veneto region, where the majority of the cases originate, has emerged as an ideal habitat for Culex mosquitoes, which can host and transmit the virus. Earlier this year, scientists found that the number of mosquitoes in the region had increased by 27%.

Insect species incapable of migrating may also become extinct. This is of concern because many insects perform important ecological functions. Three quarters of the crops produced globally are fertilised by pollinators. Their loss could cause a sharp reduction in global food production.

The vulnerability of insects to temperature extremes means that we face an uncertain and worrying future if we cannot curb the pace of climate change. A clear way of protecting these species is to slow the pace of climate change by reducing fossil fuel consumption. On a smaller scale, the creation of shady habitats, which contain cooler microclimates, could provide essential respite for insects facing rising temperatures.The Conversation

—————————-

This blog is written by Hester Weaving, PhD Candidate in Entomology, University of BristolThis article is republished from The Conversation under a Creative Commons license. Read the original article.

Hester Weaving


Canada’s flood havoc after summer heatwave shows how climate disasters combine to do extra damage

People living in British Columbia will feel like they have had more than their fair share of climate disasters in 2021. After a record-breaking heatwave in June, the state in western Canada has been inundated by intense rain storms in November. It’s also likely the long-lasting effects of the heatwave made the results of the recent rainfall worse, causing more landslides – which have destroyed highways and railroads – than would otherwise have happened.

In June 2021, temperature records across western North America were shattered. The town of Lytton in British Columbia registered 49.6°C, breaking the previous Canadian national record by 5°C. The unprecedented weather was caused by a high pressure system, a so-called “heat dome”, which sat over the region for several days.

Heat intensified within the dome as the high pressure compressed the air. Dry ground conditions forced temperatures even higher, as there was less water evaporating to cool things down. Although unconfirmed, it’s estimated that the heatwave caused over 400 deaths in British Columbia alone.

A helicopter flies over a burning pine forest beneath a blue sky.
Wildfires ravaged British Columbia during the hot and dry summer of 2021.
EB Adventure Photography/Shutterstock

The hot and dry weather also sparked wildfires. Just days after recording the hottest national temperature ever, the town of Lytton burned to the ground. The summer’s fires and drought left the ground charred and barren, incapable of absorbing water. These conditions make landslides more likely, as damaged tree roots can no longer hold soil in place. It also ensures water flows over the soil quicker, as it cannot soak into the baked ground.

The huge rain storm which lasted from Saturday November 13 to Monday 15 was caused by an atmospheric river – a long, narrow, band of moisture in the atmosphere stretching hundreds of miles. When this band travels over land it can generate extreme rainfall, and it did: in 48 hours, over 250mm of rain fell in the town of Hope, 100km east of Vancouver.

This much rainfall on its own would probably cause extensive flooding. But combined with the parched soil, the results have been catastrophic. Landslides have destroyed many of the region’s transport links, leaving Vancouver cut off by rail and road. But the bad news doesn’t end there; sediment washed away by these floods could make future floods this winter even worse.

British Columbia is in the grip of what scientists call a compound climate disaster. The effects of one extreme weather event, like a heatwave, amplify the effects of the next one, like a rain storm. Instead of seeing floods and wildfires as discrete events, compound disasters force us to comprehend the cascading crises which are likely to multiply as the planet warms.

How to understand compound climate disasters

The port of Vancouver is the busiest in Canada, moving US$550 million worth of cargo every day. Because rail links are damaged, ships laden with commodities sit offshore. Canada’s mining and farming industries are having to divert exports through the US. Depending on how quickly the rail links recover, significant economic impacts are possible.

Both the June heatwave and the November rainstorm are unprecedented, record-breaking events, but is their occurrence in the same year just bad luck? A rapid attribution study found that the heatwave was virtually impossible without climate change. The atmospheric river which brought the deluge is also likely to become more common and intense in a warming climate.

In British Columbia, future flooding is almost guaranteed to be more frequent and severe. This is life at 1.2°C above the pre-industrial temperature average, yet most politicians don’t seem too worried about taking the necessary action to prevent warming beyond 1.5°C – the limit which countries agreed in 2015 is a threshold beyond which catastrophic climate change becomes more likely.

Western Canada’s year of weather extremes did not come from nowhere. Past trends and future projections tell us to expect hotter summers and wetter winters in this part of the world, and record-shattering climate extremes are on the rise.

Worldwide, compound climate disasters are becoming more common as climate change accelerates. Risk assessments typically measure the impacts of one event at a time, like the damage caused by intense rain storms, without considering how the earlier drought influenced it. This leads to scientists and insurers underestimating the overall damage. With so many combinations of climate extremes – flooding following wildfires, hurricanes passing as cold spells arrive – we must prepare for every possibility.The Conversation

————————-

This blog is written by Cabot Institute for the Environment member Dr Vikki Thompson, Senior Research Associate in Geographical Sciences, University of Bristol.

This article is republished from The Conversation under a Creative Commons license. Read the original article.

Vikki Thompson

Violence and mental health are likely to get worse in a warming world

As heat levels increase, mental health conditions are likely to worsen.
Pxfuel

Extreme weather has been the cause of some of the biggest public health crises across the world in recent years. In many cases, these have been enhanced by human-induced climate change. For instance, in 2003, high summer temperatures in Europe were believed to cause 50,000 to 70,000 excess deaths across 16 European countries.

Globally, it’s been estimated that a total of 296,000 deaths over the past two decades have been related to heat.

But heat doesn’t just affect physical health. It can have equally serious effects on mental health conditions. Research has shown that rising temperatures are associated with an increase in suicides and in violent behaviour, as well as exacerbating mood and anxiety disorders.

Studies in England and Wales conducted between 1993 and 2003 have revealed that, when temperatures were above 18°C, every 1°C rise in temperature was associated with a 3.8% increased risk of suicide across the population.

Between 1996 and 2013 in Finland, every 1°C increase in temperature accounted for a 1.7% increase in violent crime across the country. It has even been estimated that 1.2 million more assaults might occur in the United States between 2010 to 2099 than would without climate change.

The association between high temperatures and mental health is an active area of research. Scientists have found that some health consequences of increased heat, like disturbed sleep and levels of serotonin – a hormone critical for adjusting our feelings, emotions and behaviours – might play a role in triggering the appearance of mental health conditions.

A world map coloured red, with darker areas indicating greater temperature rises (up to 6°C).
This map shows the projected changes in daily temperature extremes at 1.5°C of global warming compared to the pre-industrial period (since 1861).
Author provided

Sleep deprivation often occurs during heatwaves, which then may lead to frustration, irritability, impulsive behaviours and even violence.

Extreme temperatures, such as those observed during heatwaves, are also found to be associated with some forms of dementia and disturbed mental health states, especially for those who are already in vulnerable conditions such as psychiatric patients.

And low levels of serotonin are associated with depression, anxiety, impulsivity, aggression and occurrence of violent incidents.

Implications

In the future, heatwaves will be hotter and last longer. Temperature records are likely to be broken ever more frequently as the world continues to warm. In north-west Asia, for example, temperatures could increase by 8.4°C by 2100.

A world that is on average 1.5°C warmer will see many average regional temperatures rise by more than this. This problem is compounded as the population – and therefore the number of people living in cities – increases. By 2050, it is projected that two thirds of the world’s population will live in urban areas.

A city in summer
Cities are often hotter than rural regions, exacerbating negative mental health effects caused by heat.
PedroFigueras/Pixabay

Urban environments are known to be warmer than their rural surroundings, a phenomenon known as the “urban heat island”. Climate projections show not only that cities will warm faster than rural areas, but that this effect is increased at night. This may further exacerbate the effects of heat extremes on our sleep.

Both adaptation to and mitigation of climate change will be necessary to lessen these potentially devastating effects as much as possible.

Options for adapting our lives to a warmer world could include increasing air circulation within buildings and adjusted work hours in times of extreme heat. Paris, for example, has already created a network of “cool islands”: green and blue spaces such as parks, ponds and swimming pools which provide places to seek refuge from the heat.

Most simply, educating people on the potential impacts of heat on mental health, aggression and violence – allowing them to understand exactly why it is so important to support initiatives that help keep our planet cool – could support better mental health at the same time as fighting the climate crisis.

—————————————–The Conversation

This blog is written by Cabot Institute for the Environment members Dr Mary Zhang, Senior Research Associate in Policy Studies, University of Bristol; Professor Dann Mitchell, Associate Professor in Atmospheric Sciences, University of Bristol, and Dr Vikki Thompson, Senior Research Associate in Geographical Sciences, University of Bristol

This article is republished from The Conversation under a Creative Commons license. Read the original article.

Dann Mitchell
Mary Zhang
Vikki Thompson


Read all blogs in our COP26 blog series:

University of Bristol welcomes five Met Office Research Scientists as part of the new Met Office Academic Partnership


Image Credit: Federico Respini on Unsplash

In spring of 2020 the University of Bristol joined a prestigious alliance of the Met Office and six University Research Institutes that brings together expertise in weather and climate science.  The exciting, new Bristol Met Office Academic Partnership (MOAP) is focussed on the theme of “weather and climate hazards for decision making.” The aim is to align research interests through combining the Met Office world-leading ability in weather forecasting and the hazard and impact modelling expertise we have at Bristol.

A core part of the MOAP is to embed Met Office expertise within the University and to develop cross-disciplinary research in our key theme areas. We are, therefore, delighted to announce five new part-time Joint Bristol – Met Office Faculty members of staff who began working with us at the beginning of April.

Our Joint MOAP Chair based at the Met Office, Professor Chris Hewitt commented:

“We were delighted to welcome the University of Bristol to the Met Office Academic Partnership last year, and are excited that there will be five new joint faculty positions for Met Office scientists to cement the collaboration with the University’s experts working on research topics of mutual interest.”

The collaborative research will come under four interchangeable, themes:

  • Weather, climate and environmental hazards (e.g. volcanic hazards, heat waves, storms).
  • Impact and risk-based predictions.
  • Resilience to hazards and weather.
  • Climate services for making decisions.

The theme areas are co-led by eight University of Bristol researchers from Earth Sciences, Geographical Sciences and Civil Engineering and eight Met Office scientists. The new positions will work closely with the theme co-leads and have been strategically placed across the University Faculties to enhance collaboration and develop new research opportunities, particularly in the lead up to COP26.

University of Bristol-based MOAP Joint Chair, Dr Dann Mitchell says:

“We are really excited with the new joint faculty positions starting at Bristol. They represent the full spectrum of our partnership with the Met Office, from fundamental science for weather and climate hazards, to end user engagement. They will sit across three of our faculties and help solidify cross-disciplinary links between weather and climate, and the impacts on society, such as through health and hydrological modelling.”

The Faculty of Science welcomes three of the appointments: Dr Lizzie Kendon, a Science Manager and Met Office Fellow looking at high impact weather events using very high-resolution climate models, Dr Matt Palmer who leads the team at the Met Office who research sea level and ocean heat content and Dr Joseph Daron a Science Manager for International Climate Services at the Met Office.

The Faculty of Engineering welcomes our fourth appointment Dr Fai Fung who is the UK Climate Projections Climate Services Manager.. Our fifth appointment, Dr Dan Bernie, is the Science Manager for the UK Climate Resilience Team at the Met Office and is welcomed by the Faculty of Health Sciences. With regular MOAP meetings underway and events such as the CMIP6 Data Hackathon now open for applications we are excited to begin working with our new colleagues to develop a strong, collaborative relationship between Bristol and the Met Office.

The new appointments will work closely with The Cabot Institute for the Environment, Jean Golding Institute and Elizabeth Blackwell Institute to deliver cutting-edge research in weather and climate science

For further enquiries about the MOAP we can be contacted at bris-moap-coordinator@bristol.ac.uk.

———————————

This blog is written by Dr Emma Stone (Bristol MOAP Project Manager).

Emma’s role as MOAP project Manager, previously with a background in climate science, is to assist with and coordinate MOAP-related activities working alongside the MOAP Joint Chairs, Research Advisory Panel and theme co-leads to identify potential research opportunities between the University and the Met Office and see these through to development. Emma is a key point of contact for internal and external researchers, collaborators, funders and support staff.

Dr Emma Stone


Image at start of article credit: Federico Respini on Unsplash

Is extreme heat an underestimated risk in Bristol?

Evidence that the Earth is warming at an alarming rate is indisputable, having almost doubled per decade since 1981 (relative to 1880-1981). In many countries, this warming has been accompanied by more frequent and severe heatwaves – prolonged periods of significantly above-average temperatures – especially during summer months.

Heatwaves pose significant threats to human health including discomfort, heatstroke and in extreme cases, death. In the summer of 2003 (one that I am sure many remember for its tropical temperatures), these threats were clear. A European heatwave event killed over 70,000 people across the continent – over 2,000 of these deaths were in England alone. As if these statistics weren’t alarming enough, projections suggest that by 2050, such summers could occur every other year and by 2080, a similar heatwave could kill three times as many people.

Cities face heightened risks

Heat-health risks are not equally distributed. Cities face heightened risks due to the urban heat island (UHI) effect, where urban areas exhibit warmer temperatures than surrounding rural areas. This is primarily due to the concentration of dark, impervious surfaces. In the event of a heatwave, cities are therefore not only threatened by even warmer temperatures, but also by high population densities which creates greater exposure to such extreme heat.

UHIs have been observed and modelled across several of the UK’s largest cities. For example, in Birmingham an UHI intensity (the difference between urban and rural temperatures) of 9°C has been recorded. Some estimates for Manchester and London reach 10°C. However, little research has been conducted into the UK’s smaller cities, including Bristol, despite their rapidly growing populations.

Heat vulnerability

In the UK an ageing population implies that heat vulnerability will increase, especially in light of warming projections. Several other contributors to heat vulnerability are also well-established, including underlying health conditions and income. However, the relative influence of different factors is extremely context specific. What drives heat vulnerability in one city may play an insignificant role in another, making the development of tailored risk mitigation policies particularly difficult without location-specific research.

Climate resilience in Bristol

In 2018, Bristol declared ambitious intentions to be climate resilient by 2030. To achieve this, several specific targets have been put in place, including:

  • The adaptation of infrastructure to cope with extreme heat
  • The avoidance of heat-related deaths

Yet, the same report that outlines these goals also highlights an insufficient understanding of hotspots and heat risk in Bristol. This poses the question – how will Bristol achieve these targets without knowing where to target resources?

Bristol’s urban heat island

Considering the above, over the summer I worked on my MSc dissertation with two broad aims:

  1. Quantify Bristol’s urban heat island
  2. Map heat vulnerability across Bristol wards

Using a cloud-free Landsat image from a heatwave day in June 2018, I produced one of the first high-resolution maps of Bristol’s UHI (see below). The results were alarming, with several hotspots of 7-9°C in the central wards of Lawrence Hill, Easton and Southville. Maximum UHI intensity was almost 12°C, recorded at a warehouse in Avonmouth and Lawrence Weston. Though this magnitude may be amplified by the heatwave event, these findings still suggest Bristol exhibits an UHI similar to that of much larger cities including London, Birmingham and even Paris.

Image credit: Vicky Norton

Heat vulnerability in Bristol

Exploratory statistics revealed two principal determinants of an individual’s vulnerability to extreme heat in Bristol:

  1. Their socioeconomic status
  2. The combined effects of isolation, minority status and housing type.

These determinants were scored for each ward and compiled to create a heat vulnerability index (HVI). Even more concerning than Bristol’s surprising UHI intensity is that wards exhibiting the greatest heat vulnerability coincide with areas of greatest UHI intensity – Lawrence Hill and Easton (see below).

What’s also interesting about these findings is the composition of heat vulnerability in Bristol. Whilst socioeconomic status is a common determinant in many studies, the influential role of minority status and housing type appears particularly specific to Bristol. Unlike general UK projections, old age was also deemed an insignificant contributor to heat vulnerability in Bristol. Instead, the prevalence of a younger population suggests those under five years of age are of greater concern.

Image credit: Vicky Norton

Implications

But what do these findings mean for Bristol’s climate resilience endeavours? Firstly, they suggest Bristol’s UHI may be a much greater concern than previously thought, necessitating more immediate, effective mitigation efforts. Secondly, they reiterate the context specific nature of heat vulnerability and the importance of conducting location specific research. Considering UHI intensity and ward-level heat vulnerability, these findings provide a starting point for guiding adaptive and mitigative resource allocation. If Bristol is to achieve climate resilience by 2030, initial action may be best targeted towards areas most at risk – Lawrence Hill and Easton – and tailored to those most vulnerable.

—————————

This blog is written by Vicky Norton, who has recently completed an MSc in Environmental Policy and Management run by Caboteer Dr Sean Fox.

Vicky Norton


Is Europe heading for a more drought prone future?

Parched landscape of Europe during the 2018 drought. Image credit: NASA, CC0

In 2018, Europe was hit with one of the worst droughts so far in the 21st century in terms of its extent, severity and duration. This had large-scale effects on the vegetation, both agricultural and natural. Harvest yields were substantially reduced, by up to 40% in some regions, and widescale browning of vegetation occurred.

A consortium of international researchers, including members of the Atmospheric Chemistry Research Group (ACRG) at the University of Bristol, asked the question: given the major impacts on vegetation, which plays an essential role in removing carbon dioxide (CO2) from the air, was there an observable change in the amount of carbon uptake across Europe during this event?

There are at least two ways to quantify the impact that the drought had on the terrestrial carbon sink: a bottom-up or top-down approach. Our plans and timelines to mitigate climate change rely on using these methods to predict how much of anthropogenic greenhouse gas emissions can be taken up by the natural biosphere. Currently, the terrestrial carbon sink (i.e. vegetation and soils) takes up approximately a third of manmade emissions. The oceans take up about a similar amount. But this important carbon sink is subject to variation brought about by naturally occurring variation in the climate and manmade climate change.

To investigate the impact of the drought on the European terrestrial carbon sink, modellers can predict how individual processes that contribute to the terrestrial sink would respond to the climate during that period – a bottom-up approach. For example, a study by Bastos et al. (2019) compared the estimates of net ecosystem exchange during the drought period from 11 vegetation models. Net ecosystem exchange quantifies the amount of CO2 that is either taken up or released from the ecosystem and is usually quantified as a flux of CO2 to the atmosphere. This value is negative if the ecosystem is a sink and positive if it is a source of CO2 to the atmosphere. The consensus from previous studies was that an unusually sunny spring led to early vegetation growth, which depleted soil moisture, which intensified the drought during the summer period. Although more CO2 was taken up by the biosphere in spring, in some European regions, like Central Europe, the lack of rain during the summer months meant that the soils, already depleted in water, could not maintain the vegetation, and this led to CO2 losses from the ecosystem.

At the ACRG we use measurements of gases in the atmosphere, like CO2, to improve estimates of emissions and uptake of these gases using a top-down approach called inverse modelling. Measurements are obtained from carefully calibrated instruments that are part of global networks of measurement sites like AGAGE (Advanced Global Atmospheric Gases Experiment) and ICOS (Integrated Carbon Observation System). We also require initial estimates of the fluxes, which we obtain from several sources, including vegetation models and bottom-up inventories, and a model that describes atmospheric transport of the gas (a model that describes how a pocket of air will travel in the atmosphere). Using a statistical approach, we can then improve on those initial estimates to get better agreement between the modelled and observed concentrations at the measurement sites. With this method, we have to account for all sources of a gas, both anthropogenic and natural, as the concentration that is recorded at a measurement site is the sum of all contributions from all sources.

In a recent publication by Thompson et al. (2020), we compared the CO2 flux estimates for regions in Europe over the last ten years using the ACRG modelling method, along with four other approaches. The combined estimate from these five modelling systems indicated that the temperate region of Europe (i.e. Central Europe) was a small source of CO2 during 2018. This means that when carbon losses due to plant and soil respiration are compared with the carbon uptake by photosynthesis, then a small positive amount was emitted to the atmosphere on balance. This is described by a positive net flux of 0.09 ± 0.06 PgC y-1 (mean ± SD) to the atmosphere, compared with the mean of the last 10 years of -0.08 ± 0.17 PgC y-1, which is a net sink of carbon, meaning that over the last 10 years more carbon was taken up by photosynthesis than emitted through ecosystem respiration. Northern Europe was also found to be a small source in 2018. This publication was part of a special issue on the impacts of the 2018 drought on Europe.

So what does this tell us about how carbon uptake might change in the future? A 2018 study by Samaniego et al. considered future projections from climate models under different scenarios ranging from 1°C to 3°C global temperature rise. They concluded that soil moisture droughts were set to become 40% more likely by the end of the 21st century under the current 3°C future compared with 1.5°C set out in the Paris Climate Agreement. Droughts like the previous “Lucifer” event in 2003, where as many as 35,000 people lost their lives due to the effects of the drought, are expected to become twice as likely. Failing to reduce greenhouse gas emissions so that we mitigate the global temperature rise will impact on our ability to grow food and make killer drought events more likely. Our study shows that more frequent droughts will reduce the biosphere’s ability to take up our CO2 emissions due to the impact of a warmer climate on the soil and vegetation of key natural sinks, and lead to fundamental changes in the structure and species composition of these systems into the future. Unfortunately, this will further exacerbate the effects of climate change.

Bibliography

A. Bastos, P. Ciais, P. Friedlingstein, S. Sitch, J. Pongratz, L. Fan, J. P. Wigneron, U. Weber, M. Reichstein, Z. Fu, P. Anthoni, A. Arneth, V. Haverd, A. K. Jain, E. Joetzjer, J. Knauer, S. Lienert, T. Loughran, P. C. McGuire, H. Tian, N. Viovy, S. Zaehle. Direct and seasonal legacy effects of the 2018 heat wave and drought on European ecosystem productivity. Science Advances, 2020; 6 (24): eaba2724 DOI: 10.1126/sciadv.aba2724

M. Reuter, M. Buchwitz, M. Hilker, J. Heymann, H. Bovensmann, J.P. Burrows, S. Houweling, Y.Y. Liu, R. Nassar, F. Chevallier, P. Ciais, J. Marshall, M. Reichstein. How much CO2 is taken up by the European Terrestrial Biosphere? Bulletin of the American Meteorological Society, 2017; 98 (4): 665-671 DOI: 10.1175/BAMS-D-15-00310.1

L. Samaniego, S. Thober, R. Kumar, N. Wanders, O. Rakovec, M. Pan, M. Zink, J. Sheffield, E.F. Wood, A. Marx. Anthropogenic warming exacerbates European soil moisture droughts. Nature Climate Change, 2018; 8, 421-426 DOI: 10.1038/s41558-018-0138-5

R.L. Thompson, G. Broquet, C. Gerbig, T. Kock, M. Lang, G. Monteil, S. Munassar, A. Nickless, M. Scholze, M. Ramonet, U. Karstens, E. van Schaik, Z. Wu, C. Rödenbeck. Changes in net ecosystem exchange over Europe during the 2018 drought based on atmospheric observations. Philosophical Transactions of the Royal Society B, 2020; 375 (1810): 20190512 DOI: 10.1098/rstb.2019.0512

————————————-

This blog is written by Cabot Institute member Dr Alecia Nickless, a research associate in the School of Chemistry at the University of Bristol.

Siberia heatwave: why the Arctic is warming so much faster than the rest of the world

Smoke from wildfires cloaks the skies over Siberia, June 23 2020.
EPA-EFE/NASA

On the eve of the summer solstice, something very worrying happened in the Arctic Circle. For the first time in recorded history, temperatures reached 38°C (101°F) in a remote Siberian town – 18°C warmer than the maximum daily average for June in this part of the world, and the all-time temperature record for the region.

New records are being set every year, and not just for maximum temperatures, but for melting ice and wildfires too. That’s because air temperatures across the Arctic have been increasing at a rate that is about twice the global average.

All that heat has consequences. Siberia’s recent heatwave, and high summer temperatures in previous years, have been accelerating the melting of Arctic permafrost. This is the permanently frozen ground which has a thin surface layer that melts and refreezes each year. As temperatures rise, the surface layer gets deeper and structures embedded in it start to fail as the ground beneath them expands and contracts. This is what is partly to blame for the catastrophic oil spill that occurred in Siberia in June 2020, when a fuel reservoir collapsed and released more than 21,000 tonnes of fuel – the largest ever spill in the Arctic.

So what is wrong with the Arctic, and why does climate change here seem so much more severe compared to the rest of the world?

The warming models predicted

Scientists have developed models of the global climate system, called general circulation models, or GCMs for short, that reproduce the major patterns seen in weather observations. This helps us track and predict the behaviour of climate phenomena such as the Indian monsoon, El Niño, Southern Oscillations and ocean circulation such as the gulf stream.

GCMs have been used to project changes to the climate in a world with more atmospheric CO₂ since the 1990s. A common feature of these models is an effect called polar amplification. This is where warming is intensified in the polar regions and especially in the Arctic. The amplification can be between two and two and a half, meaning that for every degree of global warming, the Arctic will see double or more. This is a robust feature of our climate models, but why does it happen?

Fresh snow is the brightest natural surface on the planet. It has an albedo of about 0.85, which means that 85% of solar radiation falling on it is reflected back out to space. The ocean is the opposite – it’s the darkest natural surface on the planet and reflects just 10% of radiation (it has an albedo of 0.1). In winter, the Arctic Ocean, which covers the North Pole, is covered in sea ice and that sea ice has an insulating layer of snow on it. It’s like a huge, bright thermal blanket protecting the dark ocean underneath. As temperatures rise in spring, sea ice melts, exposing the dark ocean underneath, which absorbs even more solar radiation, increasing warming of the region, which melts even more ice. This is a positive feedback loop which is often referred to as the ice-albedo feedback mechanism.

Melting Arctic sea ice is increasing warming in the region.
Jonathan Bamber, Author provided

This ice-albedo (really snow-albedo) feedback is particular potent in the Arctic because the Arctic Ocean is almost landlocked by Eurasia and North America, and it’s less easy (compared to the Antarctic) for ocean currents to move the sea ice around and out of the region. As a result, sea ice that stays in the Arctic for longer than a year has been declining at a rate of about 13% per decade since satellite records began in the late 1970s.

In fact, there is evidence to indicate that sea ice extent has not been this low for at least the last 1,500 years. Extreme melt events over the Greenland Ice Sheet, that used to occur once in every 150 years, have been seen in 2012 and now 2019. Ice core data shows that the enhanced surface melting on the ice sheet over the past decade is unprecedented over the past three and a half centuries and potentially over the past 7,000 years.

In other words, the record-breaking temperatures seen this summer in the Arctic are not a “one-off”. They are part of a long-term trend that was predicted by climate models decades ago. Today, we’re seeing the results, with permafrost thaw and sea ice and ice sheet melting. The Arctic has sometimes been described as the canary in the coal mine for climate breakdown. Well it’s singing pretty loudly right now and it will get louder and louder in years to come.The Conversation

——————————-
This blog is written by Cabot Institute member Jonathan Bamber, Professor of Physical Geography, University of BristolThis article is republished from The Conversation under a Creative Commons license. Read the original article.

Professor Jonathan Bamber

Predicting the hazards of weather and climate; the partnering of Bristol and the Met Office

Image credit Federico Respini on Unsplash

When people think of the University of Bristol University, or indeed any university, they sometimes think of academics sitting in their ivy towers, researching into obscurities that are three stages removed from reality, and never applicable to the world they live in. Conversely, the perception of the Met Office is often one of purely applied science, forecasting the weather; hours, days, and weeks ahead of time. The reality is far from this, and today, on the rather apt Earth Day 2020, I am delighted to announce a clear example of the multidisciplinary nature of both institutes with our newly formed academic partnership.

This new and exciting partnership brings together the Met Office’s gold standard weather forecasts and climate projections, with Bristol’s world leading impact and hazard models. Our partnership goal is to expand on the advice we already give decision makers around the globe, allowing them to make evidence-based decisions on weather-related impacts, across a range of timescales.

By combining the weather and climate data from the Met Office with our hazard and impact models at Bristol, we could, for instance, model the flooding impact from a storm forecasted a week ahead, or estimate the potential health burden from heat waves in a decade’s time. This kind of advanced knowledge is crucial for decision makers in many sectors. For instance, if we were able to forecast which villages might be flooded from an incoming storm, we could prioritise emergency relief and flood defenses in that area days ahead of time. Or, if we projected that hospital admissions would increase by 10% due to more major heatwaves in London in the 2030s, then decision makers could include the need for more resilient housing and infrastructure in their planning. Infrastructure often lasts decades, so these sorts of decisions can have a long memory, and we want our decision makers to be proactive, rather than reactive in these cases.

While the examples I give are UK focussed, both the University of Bristol and the Met Office are internationally facing and work with stakeholders all over the world. Only last year, while holding a workshop in the Caribbean on island resilience to tropical cyclones; seeing the importance of our work the prime minister of Jamaica invited us to his residence for a celebration. While I don’t see this happening with Boris Johnson anytime soon, it goes to show the different behaviours and levels of engagement policy makers have in different countries. It’s all very well being able to do science around the world, but if you don’t get the culture, they won’t get your science. It is this local knowledge and connection that is essential for an international facing partnership to work, and that is where both Bristol and the Met Office can pool their experience.

To ensure we get the most out of this partnership we will launch a number of new joint Bristol-Met Office academic positions, ranging from doctoral studentships all the way to full professorships. These positions will work with our Research Advisory Group (RAP), made up of academics across the university, and be associated with both institutes. The new positions will sit in this cross-disciplinary space between theory and application; taking a combined approach to addressing some of the most pressing environmental issues of our time.

As the newly appointed Met Office Joint Chair I will be leading this partnership at Bristol over the coming years, and I welcome discussions and ideas from academics across the university; some of the best collaborations I’ve had have come from a random knock on the door, so don’t be shy in sharing your thoughts.

———————————
This blog is written by Dr Dann Mitchell – Met Office Joint Chair and co-lead of the Cabot Institute for the Environment’s Natural Hazards and Disaster Risk research.
You can follow him on Twitter @ClimateDann.

Dann Mitchell