Intense downpours in the UK will increase due to climate change – new study

A flash flood in London in October 2019.
D MacDonald/Shutterstock

Elizabeth Kendon, University of Bristol

In July 2021, Kew in London experienced a month’s rain in just three hours. Across the city, tube lines were suspended and stations closed as London experienced its wettest day in decades and flash floods broke out. Just under two weeks later, it happened again: intense downpours led to widespread disruption, including the flooding of two London hospitals.

Colleagues and I have created a new set of 100-year climate projections to more accurately assess the likelihood of heavy rain downpours like these over the coming years and decades. The short answer is climate change means these extreme downpours will happen more often in the UK – and be even more intense.

To generate these projections, we used the Met Office operational weather forecast model, but run on long climate timescales. This provided very detailed climate projections – for every 2.2km grid box over the UK, for every hour, for 100 years from 1981 to 2080. These are much more detailed than traditional climate projections and needed to be run as a series of 20-year simulations that were then stitched together. Even on the Met Office supercomputer, these still took about six months to run.

We ran 12 such 100-year projections. We are not interested in the weather on a given day but rather how the occurrence of local weather extremes varies year by year. By starting the model runs in the past, it is also possible to verify the output against observations to assess the model’s performance.

At this level of detail – the “k-scale” – it is possible to more accurately assess how the most extreme downpours will change. This is because k-scale simulations better represent the small-scale atmospheric processes, such as convection, that can lead to destructive flash flooding.

The fire service attending to a vehicle stuck in floodwater.
Flash flooding can be destructive.
Ceri Breeze/Shutterstock

More emissions, more rain

Our results are now published in Nature Communications. We found that under a high emissions scenario downpours in the UK exceeding 20mm per hour could be four times as frequent by the year 2080 compared with the 1980s. This level of rainfall can potentially produce serious damage through flash flooding, with thresholds like 20mm/hr used by planners to estimate the risk of flooding when water overwhelms the usual drainage channels. Previous less detailed climate models project a much lower increase of around two and a half times over the same period.

We note that these changes are assuming that greenhouse gas emissions continue to rise at current rates. This is therefore a plausible but upper estimate. If global carbon emissions follow a lower emissions scenario, extreme rain will still increase in the UK – though at a slower rate. However, the changes are not inevitable, and if we emit less carbon in the coming decades, extreme downpours will be less frequent.

The increases are significantly greater in certain regions. For example, extreme rainfall in north-west Scotland could be almost ten times more common, while it’s closer to three times more frequent in the south of the UK. The greater future increases in the number of extreme rainfall events in the higher resolution model compared with more traditional lower resolution climate models shows the importance of having k-scale projections to enable society to adapt to climate change.

As the atmosphere warms, it can hold more moisture, at a rate of 7% more moisture for every degree of warming. On a simple level, this explains why in many regions of the world projections show an increase in precipitation as a consequence of human-induced climate change. This new study has shown that, in the UK, the intensity of downpours could increase by about 5% in the south and up to about 15% in the north for every degree of regional warming.

Group of girls with an umbrella walking through a city.
The projected increase in the intensity of rainfall is significantly greater in certain regions.
NotarYES/Shutterstock

However, it is far from a simple picture of more extreme events, decade by decade, as a steadily increasing trend. Instead, we expect periods of rapid change – with records being broken, some by a considerable margin – and periods when there is a pause, with no new records set.

This is simply a reflection of the complex interplay between natural variability and the underlying climate change signal. An analogy for this is waves coming up a beach on an incoming tide. The tide is the long-term rising trend, but there are periods when there are larger waves, followed by lulls.

Despite the underlying trend, the time between record-breaking events at the local scale can be surprisingly long – even several decades.

Our research marks the first time that such a high-resolution data set has spanned over a century. As well as being a valuable asset for planners and policymakers to prepare for the future, it can also be used by climate attribution scientists to examine current extreme rainfall events to see how much more likely they will have been because of human greenhouse gas emissions. The research highlights the importance of meeting carbon emissions targets and also planning for increasingly prevalent extreme rainfall events, which to varying degrees of intensity, look highly likely in all greenhouse gas emissions scenarios.

The tendency for extreme years to cluster poses challenges for communities trying to adapt to intense downpours and risks infrastructure being unprepared, since climate information based on several decades of past observations may not be representative of the following decades.


This blog is written by Cabot Institute for the Environment member Elizabeth Kendon, Professor of Climate Science, University of Bristol. This article is republished from The Conversation under a Creative Commons license. Read the original article.

Lizzie Kendon
Professor Lizzie Kendon

Towards urban climate resilience: learning from Lusaka


“This is a long shot!”

These were the words used by Richard Jones (Science Fellow, Met Office) in August 2021 when he asked if I would consider leading a NERC proposal for a rapid six-month collaborative international research and scoping project, aligned to the COP26 Adaptation and Resilience theme. The deadline was incredibly tight but the opportunity was too good to pass up – we set to work!

Background to Lusaka and FRACTAL

Zambia’s capital city, Lusaka, is one of Africa’s fastest growing cities, with around 100,000 people in the early 1960s to more than 3 million people today. 70% of residents live in informal settlements and some areas are highly prone to flooding due to the low topography and highly permeable limestone sitting on impermeable bedrock, which gets easily saturated. When coupled with poor drainage and ineffective waste management, heavy rainfall events during the wet season (November to March) can lead to severe localised flooding impacting communities and creating serious health risks, such as cholera outbreaks. Evidence from climate change studies shows that heavy rainfall events are, in general, projected to increase in intensity over the coming decades (IPCC AR6, Libanda and Ngonga 2018). Addressing flood resilience in Lusaka is therefore a priority for communities and city authorities, and it became the focus of our proposal.

Lusaka was a focal city in the Future Resilience for African CiTies and Lands (FRACTAL) project funded jointly by NERC and DFID from 2015 to 2021. Led by the Climate System Analysis Group (CSAG) at the University of Cape Town, FRACTAL helped to improve scientific knowledge about regional climate in southern Africa and advance innovative engagement processes amongst researchers, practitioners, decision-makers and communities, to enhance the resilience of southern African cities in a changing climate. I was lucky enough to contribute to FRACTAL, exploring new approaches to climate data analysis (Daron et al., 2019) and climate risk communication (Jack et al., 2020), as well as taking part in engagements in Maputo, Mozambique – another focal city. At the end of FRACTAL there was a strong desire amongst partners to sustain relationships and continue collaborative research.

I joined the University of Bristol in April 2021 with a joint position through the Met Office Academic Partnership (MOAP). Motivated by the potential to grow my network, work across disciplines, and engage with experts at Bristol in climate impacts and risk research, I was excited about the opportunities ahead. So when Richard alerted me to the NERC call, it felt like an amazing opportunity to continue the work of FRACTAL and bring colleagues at the University of Bristol into the “FRACTAL family” – an affectionate term we use for the research team, which really has become a family from many years of working together.

Advancing understanding of flood risk through participatory processes

Working closely with colleagues at Bristol, University of Zambia, University of Cape Town, Stockholm Environment Institute (SEI – Oxford), Red Cross Climate Centre, and the Met Office, we honed a concept building on an idea from Chris Jack at CSAG to take a “deep dive” into the issues of flooding in Lusaka – an issue only partly explored in FRACTAL. Having already established effective relationships amongst those involved, and with high levels of trust and buy-in from key institutions in Lusaka (e.g., Lusaka City Council, Lusaka Water Security Initiative – LuWSI), it was far easier to work together and co-design the project; indeed the project conceived wouldn’t have been possible if starting from scratch. Our aim was to advance understanding of flood risk and solutions from different perspectives, and co-explore climate resilient development pathways that address the complex issue of flood risk in Lusaka, particularly in George and Kanyama compounds (informal settlements). The proposal centred on the use of participatory processes that enable different communities (researchers, local residents, city decision makers) to share and interrogate different types of knowledge, from scientific model datasets to lived experiences of flooding in vulnerable communities.

The proposal was well received and the FRACTAL-PLUS project started in October 2021, shortly before COP26; PLUS conveys how the project built upon FRACTAL but also stands for “Participatory climate information distillation for urban flood resilience in LUSaka”. The central concept of climate information distillation refers to the process of extracting meaning from multiple sources of information, through careful and open consideration of the assumptions, strengths and limitations in constructing the information.

The “Learning Lab” approach

Following an initial evidence gathering and dialogue phase at the end of 2021, we conducted two collaborative “Learning Labs” held in Lusaka in January and March 2022. Due to Covid-19, the first Learning Lab was held as a hybrid event on 26-27 January 2022. It was facilitated by the University of Zambia team with 20 in-person attendees including city stakeholders, the local project team and Richard Jones who was able to travel at short notice. The remainder of the project team joined via Zoom. Using interactive exercises, games (a great way to promote trust and exchange of ideas), presentations, and discussions on key challenges, the Lab helped unite participants to work together. I was amazed at the way participants threw themselves into the activities with such enthusiasm – in my experience, this kind of thing never happens when first engaging with people from different institutions and backgrounds. Yet because trust and relationships were already established, there was no apparent barrier to the engagement and dialogue. The Lab helped to further articulate the complexities of addressing flood risks in the city, and showed that past efforts – including expensive infrastructure investments – had done little to reduce the risks faced by many residents.

One of the highlights of the Labs, and the project overall, was the involvement of cartoon artist Bethuel Mangena, who developed a number of cartoons to support the process and extract meaning (in effect, distilling) the complicated and sensitive issues being discussed. The cartoon below was used to illustrate the purpose of the Lab, as a meeting place for ideas and conversations drawing on different sources of information (e.g., climate data, city plans and policies) and experiences of people from flood-affected communities. All of the cartoons generated in the project, including the feature image for this blog, are available in a Flickr cartoon gallery – well worth a look!

Image: Cartoon highlighting role of Learning Labs in FRACTAL-PLUS by Bethuel Mangena

Integrating scientific and experiential knowledge of flood risk

In addition to the Labs, desk-based work was completed to support the aims of the project. This included work by colleagues in Geographical Sciences at Bristol, Tom O’Shea and Jeff Neal, to generate high-resolution flood maps for Lusaka based on historic rainfall information and for future climate scenarios. In addition, Mary Zhang, now at the University of Oxford but in the School of Policy Studies at Bristol during the project, collaborated with colleagues at SEI-Oxford and the University of Zambia to design and conduct online and in-person surveys and interviews to elicit the lived experiences of flooding from residents in George and Kanyama, as well as experiences of those managing flood risks in the city authorities. This work resulted in new information and knowledge, such as the relative perceived roles of climate change and flood management approaches in the levels of risk faced, that was further interrogated in the second Learning Lab.

Thanks to a reduction in covid risk, the second lab was able to take place entirely in person. Sadly I was unable to travel to Lusaka for the Lab, but the decision to remove the virtual element and focus on in-person interactions helped further promote active engagement amongst city decision-makers, researchers and other participants, and ultimately better achieve the goals of the Lab. Indeed the project helped us learn the limits of hybrid events. Whilst I remain a big advocate for remote technology, the project showed it can be far more productive to have solely in-person events where everyone is truly present.

The second Lab took place at the end of March 2022. In addition to Lusaka participants and members of the project team, we were also joined by the Mayor of Lusaka, Ms. Chilando Chitangala. As well as demonstrating how trusted and respected our partners in Lusaka are, the attendance of the mayor showed the commitment of the city government to addressing climate risks in Lusaka. We were extremely grateful for her time engaging in the discussions and sharing her perspectives.

During the lab the team focused on interrogating all of the evidence available, including the new understanding gained through the project from surveys, interviews, climate and flood data analysis, towards collaboratively mapping climate resilient development pathways for the city. The richness and openness in the discussions allowed progress to be made, though it remains clear that addressing flood risk in informal settlements in Lusaka is an incredibly challenging endeavour.

Photo: Participants at March 2022 Learning Lab in Lusaka

What did we achieve?

The main outcomes from the project include:

  1. Enabling co-exploration of knowledge and information to guide city officials (including the mayor – see quote below) in developing Lusaka’s new integrated development plan.
  2. Demonstrating that flooding will be an ongoing issue even if current drainage plans are implemented, with projections of more intense rainfall over the 21st century pointing to the need for more holistic, long-term and potentially radical solutions.
  3. A plan to integrate flood modelling outputs into the Lusaka Water Security Initiative (LuWSI) digital flood atlas for Lusaka.
  4. Sustaining relationships between FRACTAL partners and building new links with researchers at Bristol to enable future collaborations, including input to a new proposal in development for a multi-year follow-on to FRACTAL.
  5. A range of outputs, including contributing to a FRACTAL “principles” paper (McClure et al., 2022) supporting future participatory projects.

It has been such a privilege to lead the FRACTAL-PLUS project. I’m extremely grateful to the FRACTAL family for trusting me to lead the project, and for the input from colleagues at Bristol – Jeff Neal, Tom O’Shea, Rachel James, Mary Zhang, and especially Lauren Brown who expertly managed the project and guided me throughout.

I really hope I can visit Lusaka in the future. The city has a special place in my heart, even if I have only been there via Zoom!

“FRACTAL-PLUS has done well to zero in on the issue of urban floods and how climate change pressures are making it worse. The people of Lusaka have continually experienced floods in various parts of the city. While the problem is widespread, the most affected people remain to be those in informal settlements such as George and Kanyama where climate change challenges interact with poor infrastructure, poor quality housing and poorly managed solid waste.” Mayor Ms. Chilando Chitangala, 29 March 2022

————————————————————————————-

This blog is written by Dr Joe Daron, Senior Research Fellow, Faculty of Science, University of Bristol;
Science Manager, International Climate Services, Met Office; and Cabot Institute for the Environment member.
Find out more about Joe’s research at https://research-information.bris.ac.uk/en/persons/joe-daron.


New flood maps show US damage rising 26% in next 30 years due to climate change alone, and the inequity is stark


Coastal cities like Port Arthur, Texas, are at increasing risk from flooding during storms.
Joe Raedle/Getty Images

Climate change is raising flood risks in neighborhoods across the U.S. much faster than many people realize. Over the next three decades, the cost of flood damage is on pace to rise 26% due to climate change alone, an analysis of our new flood risk maps shows.

That’s only part of the risk. Despite recent devastating floods, people are still building in high-risk areas. With population growth factored in, we found the increase in U.S. flood losses will be four times higher than the climate-only effect.

Our team develops cutting-edge flood risk maps that incorporate climate change. It’s the data that drives local risk estimates you’re likely to see on real estate websites.

In the new analysis, published Jan. 31, 2022, we estimated where flood risk is rising fastest and who is in harm’s way. The results show the high costs of flooding and lay bare the inequities of who has to endure America’s crippling flood problem. They also show the importance of altering development patterns now.

The role of climate change

Flooding is the most frequent and costliest natural disaster in the United States, and its costs are projected to rise as the climate warms. Decades of measurements, computer models and basic physics all point to increasing precipitation and sea level rise.

As the atmosphere warms, it holds about 7% more moisture for every degree Celsius that the temperature rises, meaning more moisture is available to fall as rain, potentially raising the risk of inland flooding. A warmer climate also leads to rising sea levels and higher storm surges as land ice melts and warming ocean water expands.

Yet, translating that understanding into the detailed impact of future flooding has been beyond the grasp of existing flood mapping approaches.

A map of Houston showing flooding extending much farther inland.
A map of Houston shows flood risk changing over the next 30 years. Blue areas are today’s 100-year flood-risk zones. The red areas reflect the same zones in 2050.
Wing et al., 2022

Previous efforts to link climate change to flood models offered only a broad view of the threat and didn’t zoom in close enough to provide reliable measures of local risk, although they could illustrate the general direction of change. Most local flood maps, such as those produced by the Federal Emergency Management Agency, have a different problem: They’re based on historical changes rather than incorporating the risks ahead, and the government is slow to update them.

Our maps account for flooding from rivers, rainfall and the oceans – both now and into the future – across the entire contiguous United States. They are produced at scales that show street-by-street impacts, and unlike FEMA maps, they cover floods of many different sizes, from nuisance flooding that may occur every few years to once-in-a-millennium disasters.

While hazard maps only show where floods might occur, our new risk analysis combines that with data on the U.S. building stock to understand the damage that occurs when floodwaters collide with homes and businesses. It’s the first validated analysis of climate-driven flood risk for the U.S.

The inequity of America’s flood problem

We estimated that the annual cost of flooding today is over US$32 billion nationwide, with an outsized burden on communities in Appalachia, the Gulf Coast and the Northwest.

When we looked at demographics, we found that today’s flood risk is predominantly concentrated in white, impoverished communities. Many of these are in low-lying areas directly on the coasts or Appalachian valleys at risk from heavy rainfall.

But the increase in risk as rising oceans reach farther inland during storms and high tides over the next 30 years falls disproportionately on communities with large African American populations on the Atlantic and Gulf coasts. Urban and rural areas from Texas to Florida to Virginia contain predominantly Black communities projected to see at least a 20% increase in flood risk over the next 30 years.

Historically, poorer communities haven’t seen as much investment in flood adaptation or infrastructure, leaving them more exposed. The new data, reflecting the cost of damage, contradicts a common misconception that flood risk exacerbated by sea level rise is concentrated in whiter, wealthier areas.

A woman carries a child past an area where flood water surrounds low-rise apartment buildings.
Hurricane Florence’s storm surge and extreme rainfall flooded towns on North Carolina’s Neuse River many miles inland from the ocean in 2018.
Chip Somodevilla/Getty Images

Our findings raise policy questions about disaster recovery. Prior research has found that these groups recover less quickly than more privileged residents and that disasters can further exacerbate existing inequities. Current federal disaster aid disproportionately helps wealthier residents. Without financial safety nets, disasters can be tipping points into financial stress or deeper poverty.

Population growth is a major driver of flood risk

Another important contributor to flood risk is the growing population.

As urban areas expand, people are building in riskier locations, including expanding into existing floodplains – areas that were already at risk of flooding, even in a stable climate. That’s making adapting to the rising climate risks even more difficult.

A satellite image of Kansas City showing flood risk overlaid along the rivers.
A Kansas City flood map shows developments in the 100-year flood zone.
Fathom

Hurricane Harvey made that risk painfully clear when its record rainfall sent two reservoirs spilling into neighborhoods, inundating homes that had been built in the reservoirs’ flood zones. That was in 2017, and communities in Houston are rebuilding in risky areas again.

We integrated into our model predictions how and where the increasing numbers of people will live in order to assess their future flood risk. The result: Future development patterns have a four times greater impact on 2050 flood risk than climate change alone.

On borrowed time

If these results seem alarming, consider that these are conservative estimates. We used a middle-of-the-road trajectory for atmospheric greenhouse gas concentrations, one in which global carbon emissions peak in the 2040s and then fall.

Importantly, much of this impact over the next three decades is already locked into the climate system. While cutting emissions now is crucial to slow the rate of sea level rise and reduce future flood risk, adaptation is required to protect against the losses we project to 2050.

[Over 140,000 readers rely on The Conversation’s newsletters to understand the world. Sign up today.]

If future development was directed outside of the riskiest areas, and new construction met higher standards for flood mitigation, some of these projected losses could be avoided. In previous research, we found that for a third of currently undeveloped U.S. floodplains it is cheaper to buy the land at today’s prices and preserve it for recreation and wildlife than develop it and pay for the inevitable flood damages later.

The results stress how critical land use and building codes are when it comes to adapting to climate change and managing future losses from increasing climate extremes. Protecting lives and property will mean moving existing populations out of harm’s way and stopping new construction in flood-risk areas.The Conversation

——————————-

This blog is written by Cabot Institute for the Environment members Dr Oliver Wing, Research Fellow, and Paul Bates, Professor of Hydrology, School of Geographical Sciences, University of Bristol; and Carolyn Kousky, Executive Director, Wharton Risk Center, University of Pennsylvania and Jeremy Porter, Professor of Quantitative Methods in the Social Sciences, City University of New York.

This article is republished from The Conversation under a Creative Commons license. Read the original article.

The case for case studies: a natural hazards perspective

As I wander the streets of Easton, as I have done over the last 18 months, the landscape becomes more and more familiar. Same streets, same skies. Things seem flat and still.

Living in this mundane landscape, I find it hard to believe that we live on a turbulent, roiling planet. But the Earth is not flat or still! Natural events happen daily, and extreme climatic events continue to escalate – although all we see in England is a rainy July. Some people are more vulnerable to the Earth’s vicissitudes than others. Since 2021 began, volcanoes in the Democratic Republic of Congo, Italy, Guatemala, and Iceland have erupted, and hurricanes have already gathered pace in the Atlantic. Many of these events have caused disaster for people living in these areas, losing homes, livelihoods, and lives.

Disasters erode and destroy, they leave scars and memories. We are fascinated by them: we seek to understand and to explain. How can we best do that? The case study is one way. Because of its in-depth nature, a case study is well-suited to describe disasters caused by natural hazards (earthquakes, volcanoes, landslides, floods, droughts), allowing us to tell a rich and nuanced story of events. However, we have to be prudent. There are many more natural hazards than we have scope to investigate. A good subject for a case study offers the possibility of new insights that other, limited methods have missed. Many, many times an earthquake or flood does not cause disaster. In choosing a good subject for a case study, we are looking for that event which is particularly interesting to us, and which we hope can tell us new things.

I am currently working on three case studies of disasters in Guatemala. Why and how did the disasters happen?

Coming from an Earth Sciences background, I’m not sure where to begin. There are no obvious blueprints. Why is there so little guidance on how to do a case study in our field? I think there are two reasons. Earth Sciences has always generously included other physical and social sciences (physics, chemistry, mathematics, geography), while a disaster caused by natural hazards involves both physical and social factors. So while this supports disaster’s suitability to the case study method, both science and subject use multiple philosophies and methods. It’s harder to make a cookbook with mixed methods. Secondly, Earth Sciences looks at the mutual interaction between people and nature, who operate on different timescales. Tracing a disaster through a case study requires uniting these timescales in a single narrative. That union is a difficult task and often context-specific, so not generalizable to a single blueprint. (Strangely, in an interdisciplinary case study of a disaster it’s the physical scientists who seem to study events over shorter timescales, for example on the physical triggers of a volcanic eruption. A few years ago in my undergraduate I remember tracing the story of Earth’s evolution across billions of years; now we’re operating over days and hours!)

There have been many criticisms levelled at case study research: that you can’t generalize from a single case, that theoretical knowledge is more valuable than practical knowledge, that case studies tend to confirm the researcher’s biases [1]. I have also read that case studies are excellent for qualitative research (e.g., on groups or individuals), but less so for quantitative research (e.g. on events or phenomena) [2]. I think these points are rubbish.

“You can’t generalize from a single case”, goes the argument against case studies. But generalization is not the point of a case study. We want to go deeper, to know more intimately, to sense in full colour. “Particularization, not generalization” is the point [1], and  intimate knowledge is worthwhile in itself. However, I also think the argument is false. Because it is such a rich medium, the case study affords us a wealth of observations and thus interpretations that allow us to modify our existing beliefs. As an example, a case study of the Caribbean island of Montserrat during an eruptive crisis showed Montserratians entering the no-go zone, risking their lives from the volcano to care for their crops and cattle [3]. This strongly changed the existing reasoning that people would prioritize their life over their livelihood during a volcanic eruption. How could you deny that this finding is not applicable beyond the specific case study? True, it isn’t certain to happen elsewhere, but the finding reminds us to research with caution and to challenge our assumptions. A case study might not give us a totally new understanding of an event, but it might refine our understanding – and that’s how most science progresses, both social and natural. This ‘refinement’ is also a balm for people like me who might be approaching a new case study with trepidation, concerned we might be going over old ground. Sure we might, but here we might forge a new path, there dig up fresh insights.

On the grounds of theoretical versus practical knowledge – we learn by doing! We are practical animals!

Context-dependent knowledge and experience are at the very heart of expert activity.

(Flyvbjerg, 2006) 

Does a case study confirm what we already expect to find? I think the possibility of refining our existing understanding can encourage researchers to keep our eyes open to distortions and bias. I think this final criticism comes from a false separation between the physical and social sciences. Qualitative research is held up as a contrast to “objective” quantitative research in the physical sciences, focussed on hypothesis-testing and disinterested truth. But any PhD student will tell you that the scientific process doesn’t quite work that way. Hypotheses are revised, created, and abandoned with new data, similar to how grounded theory works. And you can find any number of anecdotes where two scientists with the same data and methods came to two different interpretations. There is always some subjective bias as a researcher because (a) you’re also a human, and (b) because the natural world is inherently uncertain. (I wonder if this is an appeal for those who study pure maths – it’s the only discipline I can think of that is really objective and value-free).  Maybe qualitative/quantitative has some difference in the degree of researcher subjectivity. This would be a fascinating subject to explicitly include in those interdisciplinary case studies that involve both types of researcher – how does each consider their inherent bias towards the subject?

After flattening those objections above, I really want to make three points as to why case studies are so great.

First, they have a narrative element that we find irresistible. As Margaret Atwood said,

You’re never going to kill storytelling because it’s built into the human plan. We come with it.

A case study is not just a story, but it does have a story woven into its structure. Narratives are always partial and partisan; our case studies will be too. That’s not to say they can’t be comprehensive, just that they cannot hope to be omniscient. I love this quotation:

A story has no beginning or end: arbitrarily one chooses that moment of experience from which to look back or from which to look ahead.

Graham Greene, The End Of The Affair 

It certainly applies to case studies, too. We may find the roots of a disaster in political machinations which began decades before, or that the journey of a mudslide was hastened by years of deforestation. Attempting to paint the whole picture is futile, but you have to start somewhere.

Second, a case study provides a beautiful chance to both understand and to explain – the aims of the qualitative and the quantitative researcher, respectively. Each may approach truth and theory differently: the first sees truth as value-laden and theory to be developed in the field; the second, as objective and to be known before work is begun. It’s precisely because it’s difficult to harmonize these worldviews that we should be doing it – and the disaster case study provides an excellent arena.

Finally, the process of building a case study creates a space for dialogue. Ideas grow through conversation and criticism, and the tangle of researchers trying to reconcile their different worldviews, and of researchers reconciling their priorities with other interested people, seems both the gristle and the fat of case study research. In the case of disasters, I think this is the most important point which case study research wins. Research can uncover the most wonderful things but if it is not important to the people who are at risk of disaster, we cannot hope to effect positive change. How can we understand, and then how can we make ourselves understood? For all the confusion and frustration that it holds, we need dialogue [4]. A really beautiful example of this is the dialogue between volcano-watchers and scientists at Tungurahua volcano in Ecuador: creating a shared language allowed for early response to volcanic hazards and a network of friendships [5].

I’ve grappled with what products we should make out of these case studies. What are we making, and who are we making it for? From the above point, a valuable product of a case study can be a new relationship between different groups of people. This is not really tangible, which is hard to deal with for the researchers (how do you publish a friendship?) But a case study can produce a relationship that benefits both parties and outlasts the study itself. I think I’ve experienced this personally, through my work at Fuego volcano. I have found the opportunity to share my research and also to be transformed in my workings with local people. This has lasted longer than my PhD, I am still in touch with some of these people.

I believe in the power of case study to its own end, to create dialogue, and to mutually transform researcher and subject. And, if a new relationship is a valuable product of the case study, it is made stronger still by continued work in that area. To do that, the relationships and the ties that bind need to be supported financially and socially across years and uncertainty, beyond the current grey skies and monotony. When we are out, we will be able to renew that dialogue in person and the fruits of our labour will blossom.

[1] Flyvbjerg, 2006

[2] Stake, 1995

[3] Haynes et al., 2005

[4] Barclay et al., 2015

[5] Armijos et al., 2017

——————————-

This blog is written by Cabot Institute for the Environment member Ailsa Naismith from the School of Earth Sciences at the University of Bristol. Ailsa studies volcanic hazards in Central America.

Ailsa Naismith


Predicting the hazards of weather and climate; the partnering of Bristol and the Met Office

Image credit Federico Respini on Unsplash

When people think of the University of Bristol University, or indeed any university, they sometimes think of academics sitting in their ivy towers, researching into obscurities that are three stages removed from reality, and never applicable to the world they live in. Conversely, the perception of the Met Office is often one of purely applied science, forecasting the weather; hours, days, and weeks ahead of time. The reality is far from this, and today, on the rather apt Earth Day 2020, I am delighted to announce a clear example of the multidisciplinary nature of both institutes with our newly formed academic partnership.

This new and exciting partnership brings together the Met Office’s gold standard weather forecasts and climate projections, with Bristol’s world leading impact and hazard models. Our partnership goal is to expand on the advice we already give decision makers around the globe, allowing them to make evidence-based decisions on weather-related impacts, across a range of timescales.

By combining the weather and climate data from the Met Office with our hazard and impact models at Bristol, we could, for instance, model the flooding impact from a storm forecasted a week ahead, or estimate the potential health burden from heat waves in a decade’s time. This kind of advanced knowledge is crucial for decision makers in many sectors. For instance, if we were able to forecast which villages might be flooded from an incoming storm, we could prioritise emergency relief and flood defenses in that area days ahead of time. Or, if we projected that hospital admissions would increase by 10% due to more major heatwaves in London in the 2030s, then decision makers could include the need for more resilient housing and infrastructure in their planning. Infrastructure often lasts decades, so these sorts of decisions can have a long memory, and we want our decision makers to be proactive, rather than reactive in these cases.

While the examples I give are UK focussed, both the University of Bristol and the Met Office are internationally facing and work with stakeholders all over the world. Only last year, while holding a workshop in the Caribbean on island resilience to tropical cyclones; seeing the importance of our work the prime minister of Jamaica invited us to his residence for a celebration. While I don’t see this happening with Boris Johnson anytime soon, it goes to show the different behaviours and levels of engagement policy makers have in different countries. It’s all very well being able to do science around the world, but if you don’t get the culture, they won’t get your science. It is this local knowledge and connection that is essential for an international facing partnership to work, and that is where both Bristol and the Met Office can pool their experience.

To ensure we get the most out of this partnership we will launch a number of new joint Bristol-Met Office academic positions, ranging from doctoral studentships all the way to full professorships. These positions will work with our Research Advisory Group (RAP), made up of academics across the university, and be associated with both institutes. The new positions will sit in this cross-disciplinary space between theory and application; taking a combined approach to addressing some of the most pressing environmental issues of our time.

As the newly appointed Met Office Joint Chair I will be leading this partnership at Bristol over the coming years, and I welcome discussions and ideas from academics across the university; some of the best collaborations I’ve had have come from a random knock on the door, so don’t be shy in sharing your thoughts.

———————————
This blog is written by Dr Dann Mitchell – Met Office Joint Chair and co-lead of the Cabot Institute for the Environment’s Natural Hazards and Disaster Risk research.
You can follow him on Twitter @ClimateDann.

Dann Mitchell

World Water Day: Climate change and flash floods in Small Island Developing States

Pluvial flash flooding (otherwise known as flash flooding caused by rain) is a major hazard globally, but a particularly acute problem for Small Island Developing States (SIDS). Many SIDS experience extreme rainfall events associated with tropical cyclones (often referred to as hurricanes) which trigger excess surface water runoff and lead to pluvial flash flooding.

Following record-breaking hurricanes in the Caribbean such as Hurricane Maria in 2017 and Hurricane Dorian in 2019, the severe risk facing SIDS has been reaffirmed and labelled by many as a sign of the ‘new normal’ due to rising global temperatures under climate change. Nonetheless, in the Disaster Risk Reduction community there is a limited understanding of both current tropical-cyclone induced flood hazard and how this might change under different climate change scenarios, which inhibits attempts to build adaptive capacity and resilience to these events.

As part of the first year of my PhD research, I am applying rainfall data that has been produced by Emily Vosper and Dr Dann Mitchell in the University of Bristol BRIDGE group using a tropical cyclone rainfall model. This model uses climate model data to simulate a large number of tropical cyclone events in the Caribbean, which are used to understand how the statistics of tropical cyclone-induced rainfall might change under the 1.5C and 2C Paris Agreement scenarios. This rainfall data will be input into the hydrodynamic model LISFLOOD-FP to simulate pluvial flash flooding associated with hurricanes in Puerto Rico.

Investigating changes in flood hazard associated with different rainfall scenarios will help us to understand how flash flooding, associated with hurricanes, emerges under current conditions and how this might change under future climate change in Puerto Rico. Paired with data identifying exposure and vulnerability, my research hopes to provide some insight into how flood risk related to hurricanes could be estimated, and how resilience could be improved under future climate change.

————————————-
This blog is written by Cabot Institute member Leanne Archer, School of Geographical Sciences,  University of Bristol.
Leanne Archer

Sweet love for planet Earth: An ode to bias and fallacy

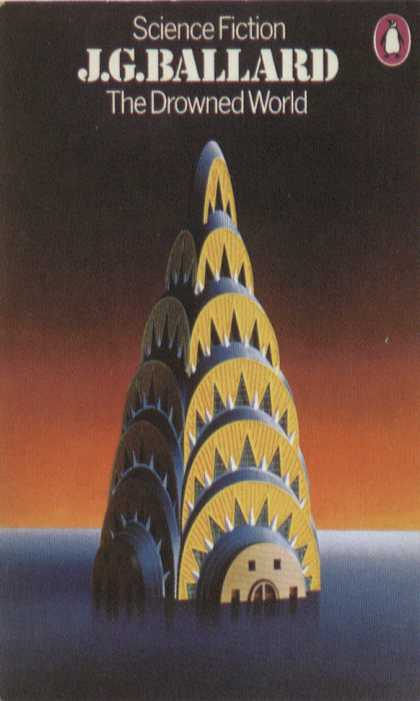
1. Apocalypse, Albert Goodwin (1903.) At the culmination of 800 paintings, Apocalypse, was the first of Goodwin’s works in which he introduced experimental techniques that marked a distinct departure from the imitations of Turner found in most of his earlier works. [picture courtesy of the Tate online collection.]
Ask for what end the heav’nly bodies shine, 
Earth for whose use? Pride answers, “Tis for mine: 
For me kind Nature wakes her genial pow’r, 
Suckles each herb, and spreads out ev’ry flow’r; 
Annual for me, the grape, the rose renew 
The juice nectareous, and the balmy dew; 
For me, the mine a thousand treasures brings; 
For me, health gushes from a thousand springs; 
Seas roll to waft me, suns to light me rise; 
My foot-stool earth, my canopy the skies.” ’
2. A section of the fifth (V) verse in the first epistle of Alexander Pope’s unfinished Essay on Man, (1733-34.)

Alexander Pope, 18th Century moral poet, pioneer in the use of the heroic couplet, second most quoted writer in the Oxford dictionary of quotations behind Shakespeare and shameless copycat. Coleridge suggested this is what held Pope back from true mastery, but It is beyond question that the results of this imitation cultured some of the finest poetry of the era. Yet still, Pope, the bel esprit of the literary decadence that proliferated within 18th Century written prose and inspiration for the excellence of Byron, Tennyson and Blake, to name but a few; spent a large amount of his creative life imitating the style of Dryden, Chaucer, and John Wilmot, Earl of Rochester. The notion that Pope (2), and Albert Goodwin (1), such precocious and natural talents, would invest so much time in mastering the artistic style of others is curious indeed, it too, provides a broad entry-point for a discussion on the roles of imitation, mimicry and mimesis in human growth, social and societal development.

You live & you learn

Having now formulated a suitable appeal to emotion, which very narrowly avoids the bandwagon, it is worth noting that imitation, and it’s cousins repetition and practice too, represent the way in which an infant might copy its parent’s behaviour, how a young artist may seek a suitably influential model as a teacher or a musician may seek to imitate sounds and transpose these as a compliment to their own polyphony, are a fundamental component in epistemology; the building of knowledge. This understanding has become increasingly important for my own research, whereby repetition and practice have not only become a primary process in developing my own knowledge but have also been important methodological heuristics for establishing imitation and mimicry as primary, collective responses for human survival during exigent situations.

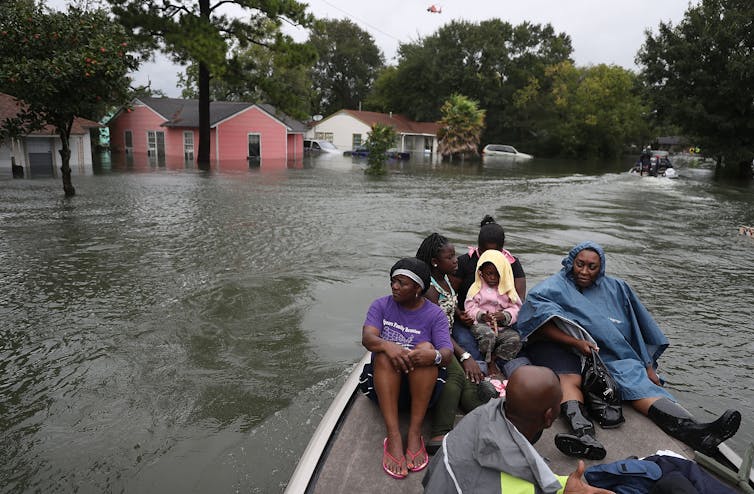
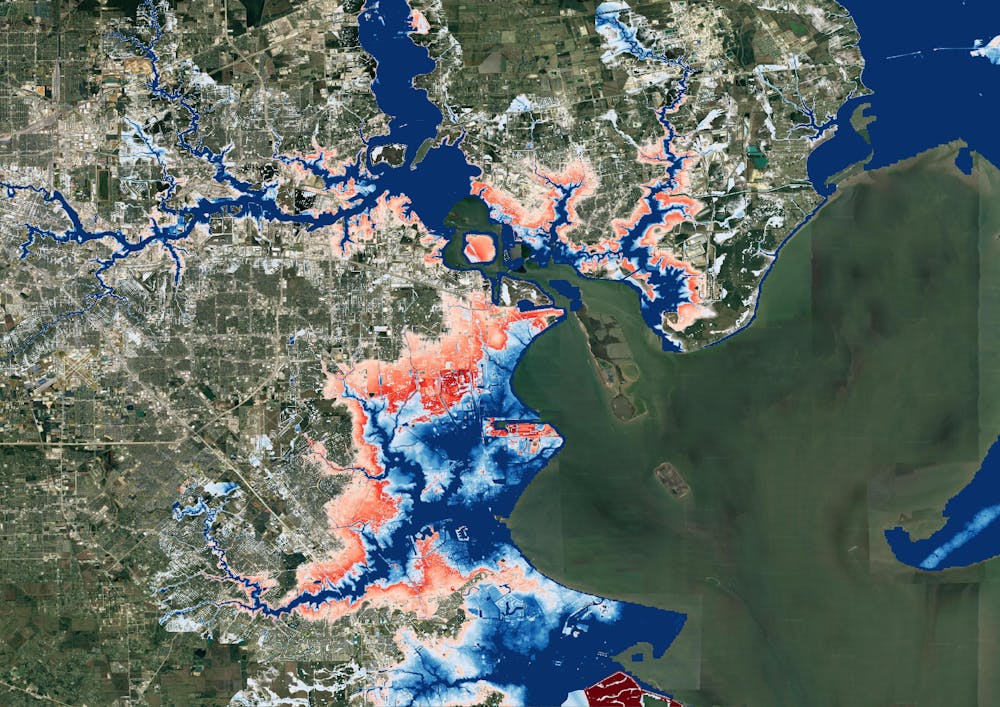
These responses and the systems within which they exist are inherently complex. In developing a robust framework to analyse and evaluate them in relation to flood scenarios for my research (3 and 4) I have utilised the agent-based model to emulate the human response to hydrodynamic data. If you have ever dealt with a HR department, any form of customer service, submitted an academic paper for publishing or bore witness to the wonders of automated passport control then you will be privy to the sentiments of human complexity, as well as our growing dependence on automation to guide us through the orbiting complexity of general life. Raillery aside, these specific examples are rather attenuated situations on which to base broad assessments of human behaviour. The agent-based model itself, a chimera rooted in computational science, born from the slightly sinister cold-war (1953-62) era overlap between computer science, biology and physics and so by implication possessing the ability to model many facets of these disciplines, their related sub-disciplines and inter-disciplines; can provide a panoptic of the broader complexities of human systems and develop our understanding of them.

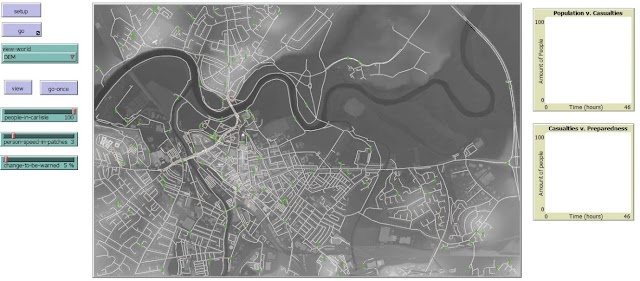
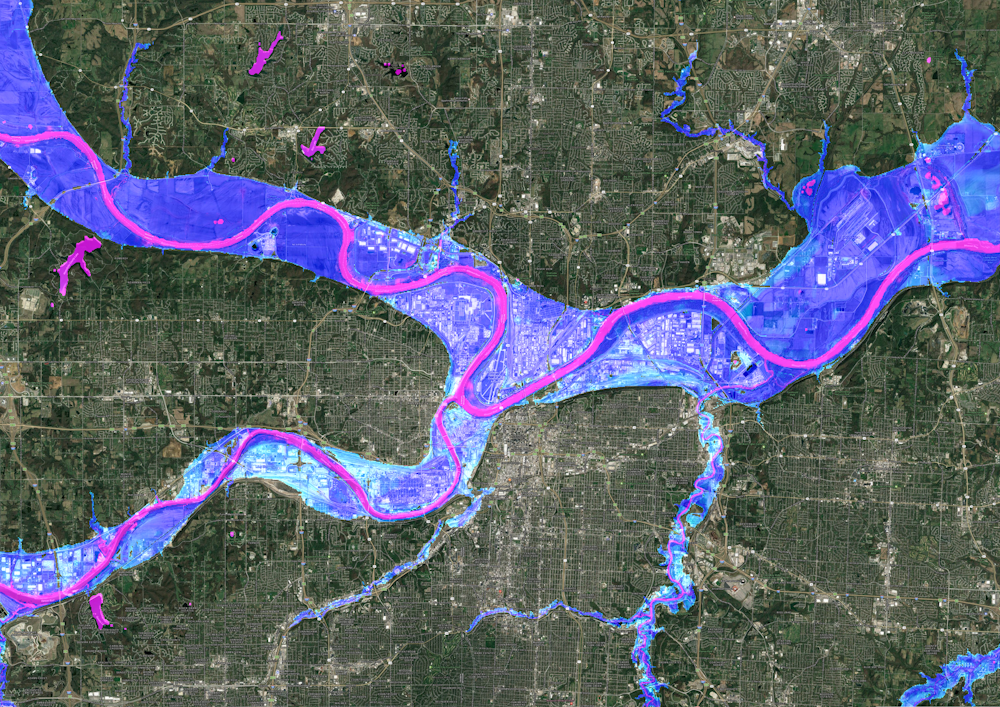
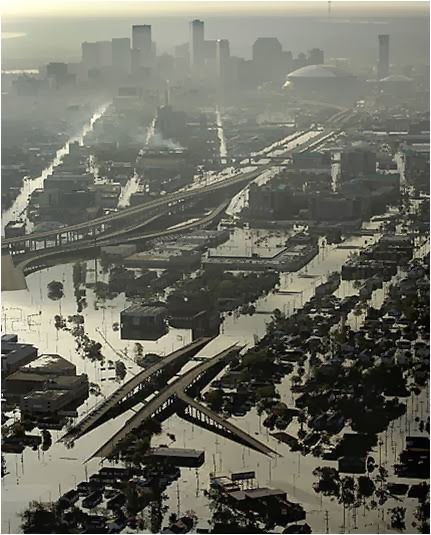
3 (above) & 4 (below). Examples of the agent-based model designed for my own research. The scenario shown is for human response to flooding in Carlisle. The population at risk (green ‘agents’) go about their daily routine until impact from the flood becomes apparent, at which point individuals can choose to go into evacuation mode (red ‘agents’.)

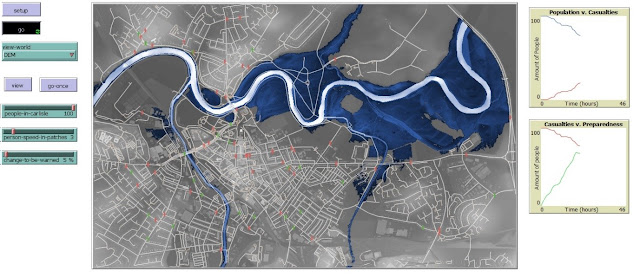
Academically, you may suggest that “these are bold claims!” (others certainly have!) tu quoque, I would retort “claims surely not beyond the horizons of your rationale or reasoning?” Diving deeper into the Carrollian involute of my research to underpin my quip (and readily expose myself to backfire bias) 12,000 simulations of the Carlisle flood case study with the aid of various choice-diffusion models to legitimise my computerised population’s decisions, have yielded a 66% preference for the population of Carlisle to interact with their neighbours and base their decision making on that of their social peers as opposed to following direct policy instruction. Broadly, this means that most of the computerised individuals respond to the flood by asking those around them what they are going to do, following their lead, imitating their evacuation decisions, mimicking their response to the flood.

Extrapolating beyond the confines of Carlisle, there are a great number of agent-based models that have explored the syncytia of human behaviours relative to systematic changes in their environment. Contra-academe and being a big fan of the veridical, I am happy to proclaim that my own model is a much wieldier alternative to the majority of those ‘big data’ models and so aims to demonstrate behavioural responses to events at a suitable point of balance between realism and interpretability. The agents represent individuals as close to reality as possible, they are defined by characteristics that define you, they and I – age, employment status etc. they are guided by self-interest and autonomously interact with a daily routine of choice that Joe public might undertake on an average day; they are (deep breath) meta-you, they and I as far as possibly mensurable, they do the same things, take the same missteps; even make the same mistakes* digitised and existent in an emulated environment replicant of ours.


(* not those kinds of mistakes.)

The cut worm forgives the plough

Veering this gnostic leviathan of an article away from the definite anecdotal and the convolvulus of complex system analysis, to what may well turn out to be a vast underestimation of reader credulity; the meat and water of this article has essentially been to provoke you into asking:

  • To what degree can choice, imitation, mimicry, influence be separated out from one another?
  • If the above is possible then how might they be measured?
  • How can these measurements be verified?
  • If verifiable then what implications do the outcomes carry?

Oliver Sachs suggested that mimicry and choice imply certain conscious intention, imitation is a pronounced psychological and physiological propensity universal to all human biology, all are traceable to instinct. In ‘The Chemical Basis of Morphogenesis, Alan Turing suggested how the various patterns of nature, spots stripes etc. could be produced from a common uniform state using reaction-diffusion equations. These equations are an important part of the algebraic family that form fractal geometry (patterns!) and the very basis of the agent-based model is a simple pattern equation known as the cellular automaton. Indeed, if you were to feed a chunk of algebra, let’s say to represent the geometric dimensions of an arbitrary but healthy and fully-formed leaf, into a graphic computer program and press go, a recursive pattern will form, and that pattern would represent the algebraic dimensions of the leaf (5.) These kinds of patterns are considered complex, the automaton, despite its rather complicated name, is a mathematically simplified way to represent complex patterns on a computer.

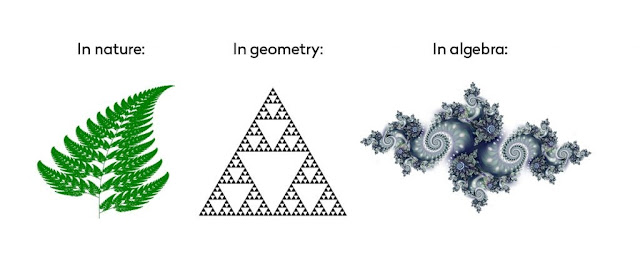
5. From nature to Timothy Leary in 3 small steps.

The patterns of agent diffusion within agent-based models could then be inferred as being
inherently representative of nature, natural process guided simply by the rules that naturally define our daily existence as defined by the automata and the demographics assigned to the agents within the agent-based model. The implications of all this fluff is that agent-based models can provide a good analogue for just that, natural process in addition to acting as an analytical tool to determine factors that may deviate those processes, providing an insight into the possible effects of affecting these processes with attenuating circumstances such as intense urbanisation, varying political climates and resource shortages; all key in the progression of human vulnerability and risk.

In terms of verification, envisage the situation where a flood is impending. You are broadly aware of flood policy and in the immediacy of impending situation you become aware of your neighbours beginning to leave their own homes or locale. Do you ask them why? Do you follow them? If so, why? If not, why not? Whatever your answers to this heavily loaded scenario may be, they will doubtlessly be littered with ‘ifs’ and ‘buts’ and this is fundamentally the obstacle policy faces in trying to ameliorate the fact that it is bound by more ‘ruban rouge’ than the Labour party directive on Brexit, is as apprehensible as the Voynich Manuscript and is as accessible as those two references compounded. Tools are required to test and visualise the compatibility interface between humans and policy before it is implemented. This will diversify and dilute it, making it more accessible; else it will forever be voided by its own hubris and lack of adequate testing. Whether the agent-based model can provide this panacea I am unsure, though one hopes.

An ode

So then, as this ode approaches the twilight of its purpose, having made it through the tour d’horizon of my research and personal interests, turgid with their own bias and logical fallacies (indicated at points, primarily to serve the author’s thirst for poetic liberty) I propose, a middle ground between pessimistic and optimistic bias, to the reader that you might embrace, and consider critically, the bias and fallacy that percolates through the world around you. In a world of climate change denial, where world leaders sharp-shoot their theses to inform decisions that affect us all and where it seems that technology and data has begun to determine our values and worth, it has never been more important to be self-aware and question the legitimacy of apathy for critique.

The ever-prescient Karl Popper suggested in his ‘conjectures and refutations’, that for science to be truly scientific a proposed theory must be refutable, as all theories have the potential to be ‘confirmed’ using the correct arrangement of words and data. It is only through refutation, or transcending the process of refutation, might we truly achieve progressive and beneficial answers to the questions upon which we base our theories. This being a process of empowerment and a sociological by-product of the positive freedom outlined by Erich Fromm. The freedom to progress collective understanding surely outweighs the freedom from fear of critical appraisal for having attempted to do so?  à chacun ses goûts, but consider this, in the final verse (7) of his Essay on Man, the final verse he ever wrote, Alexander Pope originally wrote that “One truth is clear, whatever is, is right.” By Popper’s standards, a lot of what ‘is’ today, shouldn’t be and this should ultimately leave us questioning the nature of our freedom, what exactly are we free to and free from? à chacun ses goûts?

‘All nature is but art, unknown to thee; 
All chance, direction, which thou canst not see; 
All discord, harmony, not understood; 
All partial evil, universal good: 
And, spite of pride, in erring reason’s spite, 
One truth is clear, whatever is, is right?
7. A section of the tenth (X) verse in the first epistle of Alexander Pope’s unfinished Essay on Man, (with edited last line for dramatic effect (1733-34.))
————————–
This blog was written by Cabot Institute member, Thomas O’Shea, a 2nd year Ph.D. Researcher at the School of Geographical Sciences, University of Bristol. His interests span Complex Systems, Hydrodynamics, Risk and Resilience and Machine Learning.  Please direct any desired correspondence regarding the above to his university email at: t.oshea@bristol.ac.uk.
Thomas O’Shea

Read Thomas’ other blog in this series:


Dadaism in Disaster Risk Reduction: Reflections against method

Grey Britain: Misery, urbanism & neuroaesthetics

1-in-200 year events

You often read or hear references to the ‘1-in-200 year event’, or ‘200-year event’, or ‘event with a return period of 200 years’. Other popular horizons are 1-in-30 years and 1-in-10,000 years. This term applies to hazards which can occur over a range of magnitudes, like volcanic eruptions, earthquakes, tsunamis, space weather, and various hydro-meteorological hazards like floods, storms, hot or cold spells, and droughts.

‘1-in-200 years’ refers to a particular magnitude. In floods this might be represented as a contour on a map, showing an area that is inundated. If this contour is labelled as ‘1-in-200 years’ this means that the current rate of floods at least as large as this is 1/200 /yr, or 0.005 /yr. So if your house is inside the contour, there is currently a 0.005 (0.5%) chance of being flooded in the next year, and a 0.025 (2.5%) chance of being flooded in the next five years. The general definition is this:

‘1-in-200 year magnitude is x’ = ‘the current rate for events with magnitude at least x is 1/200 /yr’.

Statisticians and risk communicators strongly deprecate the use of ‘1-in-200’ and its ilk.First, it gives the impression, wrongly, that the forecast is expected to hold for the next 200 years, but it is not: 0.005 /yr is our assessment of the current rate, and this could change next year, in response to more observations or modelling, or a change in the environment.

Second, even if the rate is unchanged for several hundred years, 200 yr is the not the average waiting time until the next large-magnitude event. It is the mathematical expectation of the waiting time, which is a different thing. The average is better represented by the median, which is 30% lower, i.e. about 140 yr. This difference between the expectation and the median arises because the waiting-time distribution has a strong positive skew, so that lots of short waiting-times are balanced out a few long ones. In 25% of all outcomes, the waiting time is less than 60 yr, and in 10% of outcomes it is less than 20 yr.

So to use ‘1-in-200 year’ in public discourse is very misleading. It gives people the impression that the event will not happen even to their children’s children, but in fact it could easily happen to them. If it does happen to them, people will understandably feel that they have been very misled, and science and policy will suffer reputational loss, which degrades its future effectiveness.

So what to use instead? ‘Annual rate of 0.005 /yr’ is much less graspable than its reciprocal, ‘200 yr’. But ‘1-in-200 year’ gives people the misleading impression that they have understood something. As Mark Twain said “It ain’t what you don’t know
that gets you into trouble. It’s what you know for sure that just ain’t so.” To demystify ‘annual rate of 0.005 /yr’, it can be associated with a much larger probability, such as 0.1 (or 10%). So I suggest ‘event with a 10% chance of happening in the next 20 yr’.

Blog post by Prof. Jonathan Rougier, Professor of Statistical Science.


First blog in series here.


Third blog in series here.

Why do flood defences fail?

More than 40,000 people were forced to leave their homes after Storm Desmond caused devastating floods and wreaked havoc in north-west England. Initial indications were that the storm may have caused the heaviest local daily rainfall on record in the UK. As much as £45m has been spent on flood defences in the region in the previous ten years and yet the rainfall still proved overwhelming. So what should we actually expect from flood defence measures in this kind of situation? And why do they sometimes fail?

We know that floods can and will happen. Yet we live and work and put our crucial societal infrastructure in places that could get flooded. Instead of keeping our entire society away from rivers and their floodplains, we accept flood risks because living in lowlands has benefits for society that outweigh the costs of flood damage. But knowing how much risk to take is a tricky business. And even when there is an overall benefit for society, the consequences for individuals can be devastating.

We also need to calculate risks when we build flood defences. We usually protect ourselves from some flood damage by building structures like flood walls and river or tidal barriers to keep rising waters away from populated areas, and storage reservoirs and canals to capture excess water and channel it away. But these structures are only designed to keep out waters from typical-sized floods. Bigger defences that could protect us from the largest possible floods, which may only happen once every 100 years, would be much more expensive to build and so we choose to accept this risk as less than the costs.

Balancing the costs and benefits

In the UK, the Environment Agency works with local communities to assess the trade off between the costs of flood protection measures, and the benefits of avoiding flood damage. We can estimate the lifetime benefits of different proposed flood protection structures in the face of typical-sized floods, as well as the results of doing nothing. On the other side of the ledger, we can also estimate the structures’ construction and maintenance costs.

In some cases, flood protection measures can be designed so that if they fail, they do the least damage possible, or at least avoid catastrophic damage. For example, a flood protection wall can be built so that if flood waters run over it they run into a park rather than residential streets or commercial premises. And secondary flood walls outside the main wall can redirect some of the overflow back towards the river channel.


Thames Barrier: big costs but bigger benefits.
Ross Angus/Flickr, CC BY-SA

The Environment Agency puts the highest priority on the projects with the largest benefits for the smallest costs. Deciding where that threshold should be set is a very important social decision, because it provides protection to some but not all parts of our communities. Communities and businesses need to be well-informed about the reasons for those thresholds, and their likely consequences.

We also protect ourselves from flood damage in other ways. Zoning rules prevent valuable assets such as houses and businesses being built where there is an exceptionally high flood risk. Through land management, we can choose to increase the amount of wooded land, which can reduce the impact of smaller floods. And flood forecasting alerts emergency services and helps communities rapidly move people and their portable valuables out of the way.

Always some risk

It’s important to realise that since flood protection measures never eliminate all the risks, there are always extra costs on some in society from exceptional events such as Storm Desmond, which produce very large floods that overwhelm protection measures. The costs of damage from these exceptional floods are difficult to estimate. Since these large floods have been rare in the past, our records of them are very limited, and we are not sure how often they will occur in the future or how much damage will they cause. We also know that the climate is changing, as are the risks of severe floods, and we are still quite uncertain about how this will affect extreme rainfall.


At the same time we know that it’s very hard to judge the risk from catastrophic events. For example, we are more likely to be afraid of catastrophic events such as nuclear radiation accidents or terrorist attacks, but do not worry so much about much larger total losses from smaller events that occur more often, such as floods.

Although the process of balancing costs against benefits seems clear and rational, choosing the best flood protection structure is not straightforward. Social attitudes to risk are complicated, and it’s difficult not to be emotionally involved if your home or livelihood are at risk.
The Conversation

————————————–
This blog is written by Cabot Institute member Dr Ross Woods, a Senior Lecturer in Water and Environmental Engineering, University of Bristol.  This article was originally published on The Conversation. Read the original article.

Ross Woods

The uncertain world

J.G Ballard’s The Drowned World
taken from fantasticalandrewfox.com

Over the next 18 months, in collaboration with Bristol Green Capital 2015 artists, civic leaders and innovative thinkers, the Cabot Institute will be participating in  a series of activities in which we examine how human actions are making our planet a much more uncertain place to live.

Fifty years ago, between 1962 and 1966, J. G. Ballard wrote a trio of seminal environmental disaster novels: The Drowned World, The Burning World and The Crystal World.  These novels remain signposts to our future, the challenges we might face and the way people respond to rapid and unexpected change to their environment. In that spirit and coinciding with the Bristol Green Capital 2015, we introduce The Uncertain World, a world in which profound uncertainty becomes as much of a challenge to society as warming and rising sea levels.

For the past twenty years, the University of Bristol has been exploring how to better understand, mitigate and live with environmental uncertainty, with the Cabot Institute serving as the focus for that effort since its founding in 2010.  Uncertainty is the oft-forgotten but arguably most challenging aspect of mankind’s centuries-long impact on the environment.  We live our lives informed by the power of experience: our own as well as the collective experience of our families, communities and wider society. When my father started dairy farming he sought advice from my mother’s grandfather, our neighbours, and the grizzled veterans at the Middlefield auction house. Experience helps us make intelligent decisions, plan strategically and anticipate challenges.

Similarly, our weather projections, water management and hazard planning are also based on experience: tens to hundreds of years of observation inform our predictions of future floods, drought, hurricanes and heat waves. These records – this experience  – can help us make sensible decisions about where to live, build and farm.

Now, however, we are changing our environment and our climate, such that the lessons of the past have less relevance to the planning of our future.  In fact, many aspects of environmental change are unprecedented not only in human experience but in Earth history. As we change our climate, the great wealth of knowledge generated from human experience is losing capital every day.

The Uncertain World is not one of which we have no knowledge – we have high confidence that temperatures and sea level will rise, although there is uncertainty in the magnitude and speed of change. Nor should we view The Uncertain World with existential fear – we know that warm worlds have existed in the past.  These were not inhospitable and most evidence from the past suggests that a climate ‘apocalypse’ resulting in an uninhabitable planet is unlikely.

Nonetheless, increasing uncertainty arising from human-induced changes to our global environment should cause deep concern.  Crucial details of our climate remain difficult to predict, and it undermines our ability to plan for our future. We do not know whether many regions of the world will become wetter or dryer. This uncertainty propagates and multiplies through complex systems: how do we make sensible predictions of coastal flood risk when there is uncertainty in sea level rise estimates, rainfall patterns and the global warming that will impact both?  We can make predictions even in such complex systems, but the predictions will inevitably come with a degree of uncertainty, a probabilistic prediction.  How do we apply such predictions to decision making? Where can we build new homes, where do we build flood defences to protect existing ones, and where do we abandon land to the sea?

Perhaps most worrying, the consequences of these rapid changes on biological and chemical systems, and the people dependent upon them, are very poorly understood. For example, the synergistic impact of warmer temperatures, more acidic waters, and more silt-choked coastal waters on coral reefs and other marine ecosystems is very difficult to predict. This is particularly concerning given that more than 2.6 billion people  depend on the oceans as their primary source of protein. Similarly, warming of Arctic permafrost could promote the growth of CO2-sequestering plants or the release of warming-accelerating methane – or both. Warm worlds with very high levels of carbon dioxide did exist in the past and these do provide some insight  into the response of the Earth system, but we are accelerating into this new world at a rate that is unprecedented in Earth history, creating additional layers of uncertainty.

During late 2014 and 2015, the Cabot Institute will host a variety of events and collaborate with a variety of partners across Bristol and beyond to explore this Uncertain World and how we can live in it. How do we better explain uncertainty and what are the ‘logical’ decisions to make when faced with uncertainty? One of our first events will explore how uncertainty in climate change predictions should motivate us to action: the more uncertain our predictions the more we should employ mitigation rather than adaptation strategies. Future events will explore how past lessons from Earth history help us better understand potential future scenarios; how future scenario planning can inform the decisions we make today; and most importantly, how we build the necessary flexibility into social structures to thrive in this Uncertain World.

This blog is by Prof Rich Pancost, Director of the Cabot Institute at the University of Bristol.

Prof Rich Pancost