East Africa must prepare for more extreme rainfall during the short rainy season – new study

Rainy season in Kenya

East Africa has recently had an unprecedented series of failed rains. But some rainy seasons are bringing the opposite: huge amounts of rainfall.

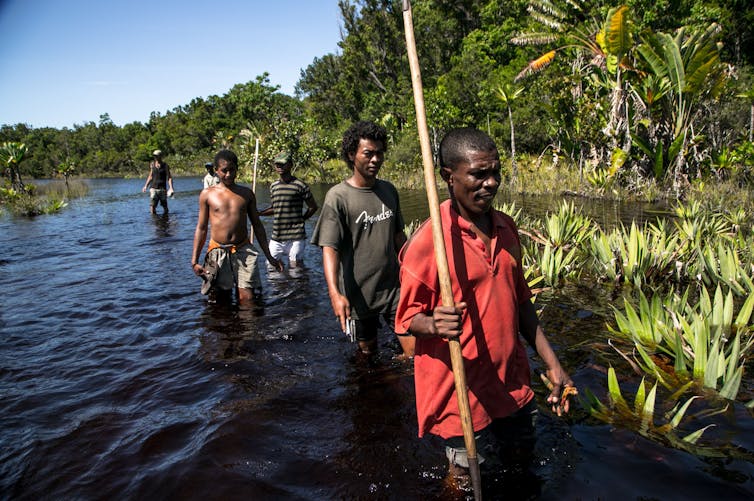
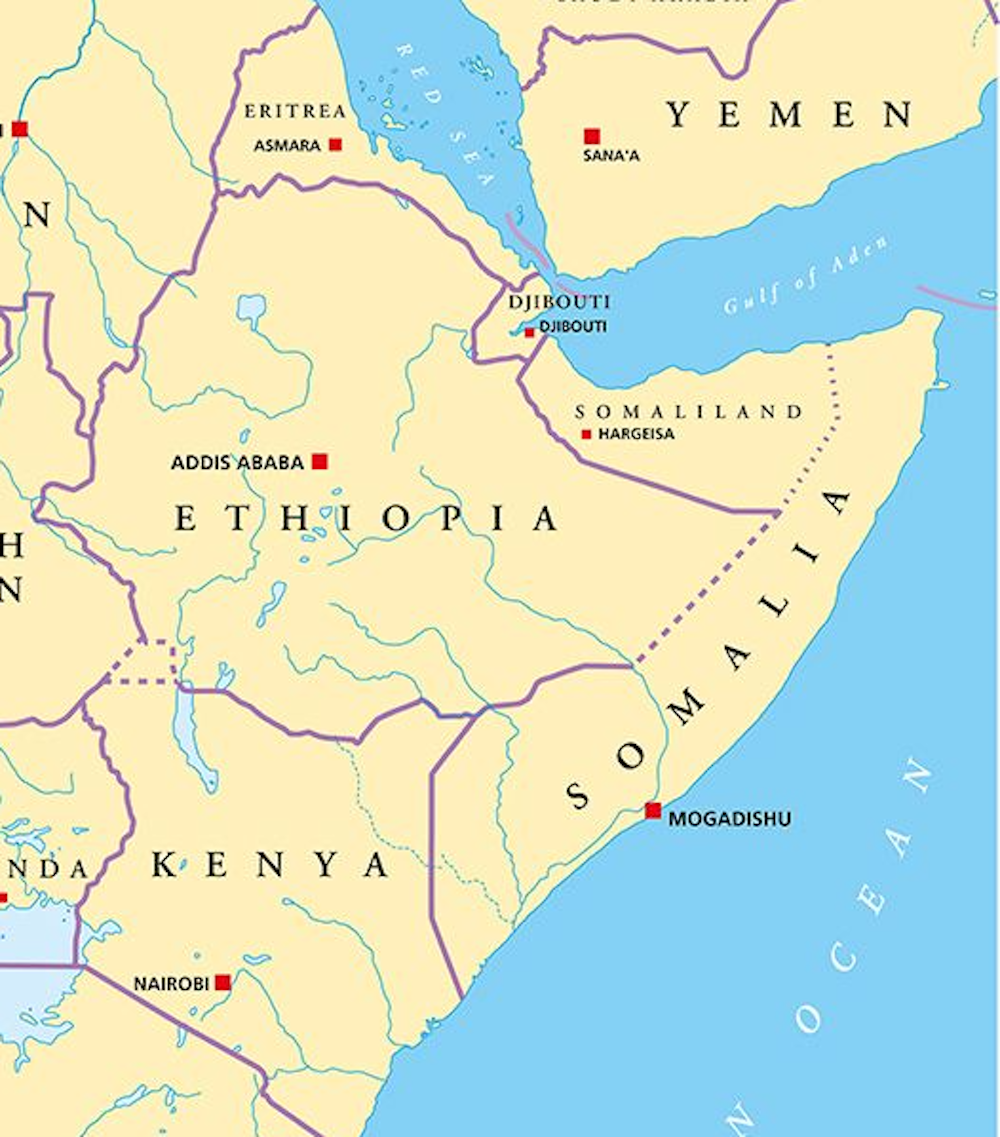
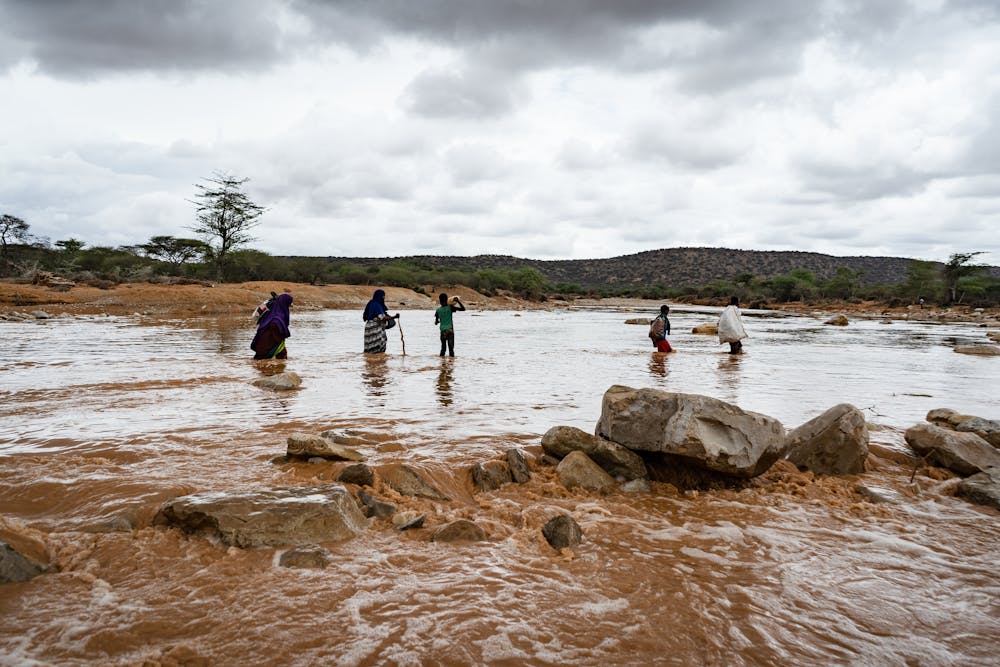
In the last few months of 2023, the rainy season known as the “short rains” was much wetter than normal. It brought severe flooding to Kenya, Somalia and Tanzania. In Somalia, more than 2 million people were affected, with over 100 killed and 750,000 displaced from their homes. Tens of thousands of people in northern Kenya lost livestock, farmland and homes.

The very wet short rainy seasons are linked to a climate event known as a positive Indian Ocean Dipole (known as the “IOD”). And climate model projections show an increasing trend of extreme Indian Ocean dipoles.

In a new research paper, we set out to investigate what effect more frequent extreme Indian Ocean Dipole events would have on rainfall in east Africa. We did this using a large number of climate simulations and models.

Our results show that they increase the likelihood of very wet days – therefore making very wet seasons.

This could lead to extreme weather events, even more extreme than the floods of 1997, which led to 10 million people requiring emergency assistance, or those of 2019, when hundreds of thousands were displaced.

We recommend that decision-makers plan for this kind of extreme rainfall, and the resulting devastating floods.

How the Indian Ocean Dipole works

Indian Ocean Dipole events tend to occur in the second half of the year, and can last for months. They have two phases: positive and negative.

Positive events occur when the temperature of the sea surface in the western Indian Ocean is warmer than normal and the temperature in the eastern Indian Ocean is cooler than normal. Put simply, this temperature difference happens when winds move warmer water away from the ocean surface in the eastern region, allowing cooler water to rise.

In the warmer western Indian Ocean, more heated air will rise, along with water vapour. This forms clouds, bringing rain. Meanwhile, the eastern part of the Indian Ocean will be cooler and drier. This is why flooding in east Africa can happen at the same time as bushfires in Australia.

The opposite is true for negative dipole events: drier in the western Indian Ocean and wetter in the east.

Under climate change we’re expecting to see more frequent and more extreme positive dipole events – bigger differences between east and west. This is shown by climate model projections. They are believed to be driven by different paces of warming across the tropical Indian Ocean – with western and northern regions projected to warm faster than eastern parts.

Often heavy rain seasons in east Africa are attributed to El Niño, but recent research has shown that the direct impact of El Niño on east African rainfall is actually relatively modest. El Niño’s principal influence lies in its capacity to bring about positive dipole events. This occurs since El Niño events tend to cool the water in the western Pacific Ocean – around Indonesia – which also helps to cool down the water in the eastern Indian Ocean. These cooler temperatures then help kick-start a positive Indian Ocean Dipole.

Examining unprecedented events

Extreme positive Indian Ocean Dipole events are rare in the recent climate record. So to examine their potential impacts on rainfall extremes, we used a large set of climate simulations. The data allowed us to diagnose the sensitivity of rainfall to larger Indian Ocean Dipole events in a statistically robust way.

Our results show that as positive dipole events become more extreme, more wet days during the short rains season can be expected. This effect was found to be largest for the frequency of extremely wet days. Additionally, we found that as the dipole strength increases, the influence on the most extreme days becomes even larger. This means that dipole events which are even slightly “record-breaking” could lead to unprecedented levels of seasonal rainfall.

Ultimately, if positive Indian Ocean Dipole seasons increase in frequency, as predicted, regular seasons of flooding impacts will become a new normal.

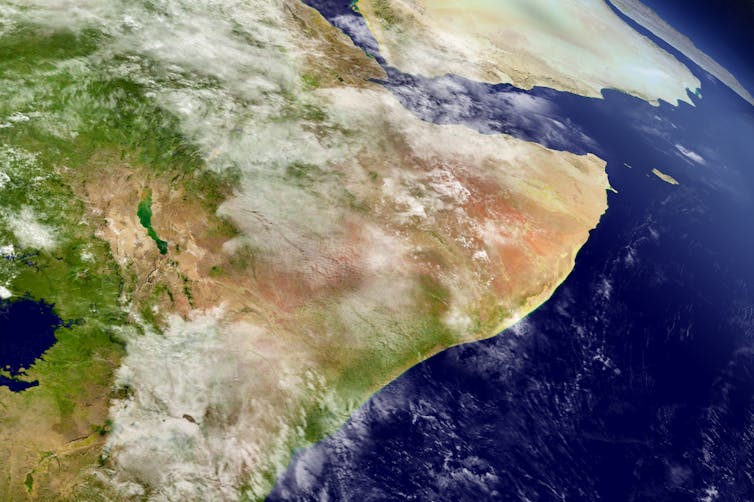
One aspect not included in our analysis is the influence of a warmer atmosphere on rainfall extremes. A warmer atmosphere holds more moisture, allowing for the development of more intense rain storms. This effect could combine with the influence of extreme positive dipoles to bring unprecedented levels of rainfall to the Horn of Africa.

2023 was a year of record-breaking temperatures driven both by El Niño and global warming. We might expect that this warmer air could have intensified rain storms during the season. Indeed, evidence from a recent assessment suggests that climate change-driven warming is highly likely responsible for increased rainfall totals.

Responding to an unprecedented future

Policymakers need to plan for this.

In the long term it is crucial to ensure that any new infrastructure is robust to withstand more frequent and heavier rains, and that government, development and humanitarian actors have the capacity to respond to the challenges.

Better use of technology, such as innovations in disseminating satellite rainfall monitoring via mobile phones, can communicate immediate risk. New frontiers in AI-based weather prediction could improve the ability to anticipate localised rain storms, including initiatives focusing on eastern Africa specifically.

Linking rainfall information with hydrological models designed for dryland environments is also essential. These will help to translate weather forecasts into impact forecasts, such as identifying risks of flash flooding down normally dry channels or bank overflow of key rivers in drylands.

These technological improvements are crucial. But better use of the forecast information we already have can also make a big difference. For instance, initiatives like “forecast-based financing”, pioneered by the Red Cross Red Crescent movement, link forecast triggers to pre-approved financing and predefined action plans, helping communities protect themselves before hazards have even started.

For these endeavours to succeed, there must be dialogue between the science and practitioner communities. The scientific community can work with practitioners to integrate key insights into decisions, while practitioners can help to ensure research efforts target critical needs. With this, we can effectively build resilience to natural hazards and resist the increasing risks of our changing climate.The Conversation

———————————

This blog is written by David MacLeod, Lecturer in Climate Risk, Cardiff University; Erik W. Kolstad, Research professor, Uni Research; Cabot Institute for the Environment member Katerina Michaelides, Professor of Dryland Hydrology, School of Geographical Sciences, University of Bristol, and Michael Singer, Professor of Hydrology and Geomorphology, Cardiff University. This article is republished from The Conversation under a Creative Commons license. Read the original article.

How do you manage a dam when there’s a tropical cyclone in Mozambique?

Mozambique dam

I’d never given a huge amount of thought of what a dam manager did until I visited Pequenos Libombos dam in Mozambique in October 2023. Standing at the dam, in hot conditions, listening to the lived experience of people who work on the ground and explain what they do during a tropical cyclone leaves you with more understanding than any peer reviewed journal article. Context is everything. It’s why visiting the countries I’m researching is something I do given the chance.

That’s what members of Bristol projects REPRESA (co-led by Prof Elizabeth Kendon at University of Bristol & UK Met Office, Dr Luis Artur from Eduardo Mondlane University and Prof Francois Engelbrecht from University of the Witwatersrand) and SALIENT (led by Dr Rachel James, University of Bristol) did in October. The REPRESA project aims to understand compound tropical cyclone risks, impacts of tropical cyclones and improve early warning systems in Mozambique, Malawi and Madagascar. Seeing the research alignment in projects, the SALIENT team also joined. The SALIENT project aims to improve the characterisation and communication of future climate information for national adaptation planning in southern Africa.

On the field trip day, we travelled to Pequenos Libombos dam and heard from a government official from the Vila De Boane Municipality. It was this day where I had my epiphany that if I ever left academia, dam management is not my calling. Providing water to the local population is the dams primary role and it provides 2 million people within Maputo Province with access to water. That is more than 4 times the population of Bristol.

The management of Pequenos Libombos dam is difficult as there are many other people and industries to consider and keep safe and happy when making decisions. From the businesses who want to use the dam’s water for industrial purposes to the farming communities that are reliant on the water for irrigation, and hydroelectricity companies that want to use the dam to create energy to the communities downstream that may be flooded if the dam releases water too quickly. The dam catchment is also shared with 2 of Mozambique’s neighbouring countries; eSwatini and South Africa, adding another element of complexity to the dams management.

Management must carefully balance both periods of water surplus and deficit and Maputo has experienced numerous extreme weather events in recent years.  The 2015-2016 southern African drought impacted Central and Southern Mozambique and more recently the remnants of tropical cyclones in 2019, 2011, 2022 and 2023. During February 2023, Tropical Cyclone (TC) Freddy passed over Madagascar and southern Mozambique before returning a couple of weeks later to central Mozambique. It is thought to be the longest lived and have the highest accumulated cyclone energy of any cyclone on record, awaiting formal investigation from the World Meteorological Organization. Although TC Freddy didn’t directly pass over Pequenos Limbombos, its associated rainfall resulted in 250 mm of rainfall at the dam in one day. For context, the Bristol experiences 265mm rainfall, on average, in October, November and December combined. To avoid a breach of the dam, discharge was released at the maximum rate, which is more than 500 time more than normal.

Globally there is evidence that TCs and their impacts are being impacted by climate change. The frequency, intensity and storm tracks of TCs may be changing meanwhile, rising sea levels may lead to higher storm surges. Yet we know a limited amount about how tropical cyclones may act in a future with increased global sea surface and air temperatures.  TCs in the Indian Ocean are particularly under researched, but recent and frequent events have highlighted the importance of understanding TCs in a changing climate.

After hearing about the vast amount of rain that fell in February 2023, we walk past the disused hydroelectric generator that was forced to cease operation during the drought as it was no longer economically viable. It really hammered home the complexities faced when trying to manage such a huge piece of infrastructure during extreme events. Similarly, it is clear why research projects like REPRESA and SALIENT are needed to understand how tropical cyclones may behave in the future and explore how early warning systems and climate change adaptation can be strengthened.

Mozambique dam

The human side of extreme weather

After the talk at Pequenos Libombos Dam, we visited the Municipality of Vila de Boane. Vila de Boane is located roughly 15 km downstream from the dam and the River Umbuluzi passes through the municipality. The municipality experienced large scale flooding after the dam was forced to increase to maximum discharge during the February 2023 rainfall.

Despite already hearing about TC’s Freddy’s impacts at the dam, they were not as focused on the human impact. The leader of the municipality compellingly described how 16,000 people were impacted overnight, 6000 people were displaced and 6 people sadly died. The community water pump was destroyed, leaving people without water for 3 months. The municipality leader said he had never seen that amount of water passing through the municipality at such high speed before. Meanwhile, money that had been budgeted for development initiatives, had to be redirected to repair and response. It was not clear if extra money had been sourced for the development initiatives.

It was also highlighted that the increased release of water from the dam occurred over night with little warning. The municipality had been told to expect “above normal” rainfall and to avoid being close to rivers and move farming machinery further inland. But as the municipality leader questioned, what does “above normal” actually mean? People will perceive this message differently, which will influence how they act upon it. As part of the SALIENT research project, I am researching how we best communicate future climate information to decision makers and this anecdote will stay with me. It’s clear that improved communications are needed in both weather and climate services, something REPRESA is also aiming to research further.

Reflections and collaboration

After hearing about the vast amount of impacts the flooding had on Villa de Boane, we waited for our transport back to Maputo under the shade as it was too hot to stand in the sun. It was clear everyone from the REPRESA and SALIENT teams, both physical scientists and social scientists, had taken a lot from the field day. There was discussion about what the research should consider as well as the different angles that could be taken. It also fostered collaboration, SALIENT team member, Alan-Kennedy Asser, is providing the REPRESA team with analysis of precipitation trends from a multiple ensembles of climate models to characterise the range in future projections over the region. Meanwhile I spoke with some REPRESA team members in more depth about future climate information and will be providing risk communication training session in the future.

My personal key take away is that understanding the context and hearing the lived experiences of people working and living with extreme weather events enriches me as a researcher. Similarly, collaborating with researchers and practitioners on different projects enhances your work by providing questions and inputs from different standpoints. And finally, I’m too indecisive a person to ever be a good dam manager.

——————————————

This blog is written by Cabot Institute for the Environment member, Dr Ailish Craig, School of Geographical Sciences, University of Bristol with contributions from Dr Alan Kennedy-Asser, School of Geographical Sciences, University of Bristol and Dr Rachel James, School of Geographical Sciences, University of Bristol.

Ailish Craig
Dr Ailish Craig

Why 40°C is bearable in a desert but lethal in the tropics

Phew: heat plus humidity can make Bangkok an uncomfortable place in a heatwave.
Pavel V.Khon/SHutterstock

This year, even before the northern hemisphere hot season began, temperature records were being shattered. Spain for instance saw temperatures in April (38.8°C) that would be out of the ordinary even at the peak of summer. South and south-east Asia in particular were hammered by a very persistent heatwave, and all-time record temperatures were experienced in countries such as Vietnam and Thailand (44°C and 45°C respectively). In Singapore, the more modest record was also broken, as temperatures hit 37°C. And in China, Shanghai just recorded its highest May temperature for over a century at 36.7°C.

We know that climate change makes these temperatures more likely, but also that heatwaves of similar magnitudes can have very different impacts depending on factors like humidity or how prepared an area is for extreme heat. So, how does a humid country like Vietnam cope with a 44°C heatwave, and how does it compare with dry heat, or a less hot heatwave in even-more-humid Singapore?

Weather and physiology

The recent heatwave in south-east Asia may well be remembered for its level of heat-induced stress on the body. Heat stress is mostly caused by temperature, but other weather-related factors such as humidity, radiation and wind are also important.

Our bodies gain heat from the air around us, from the sun, or from our own internal processes such as digestion and exercise. In response to this, our bodies must lose some heat. Some of this we lose directly to the air around us and some through breathing. But most heat is lost through sweating, as when the sweat on the surface of our skin evaporates it takes in energy from our skin and the air around us in the form of latent heat.

annotated diagram of person
How humans heat up and cool down.
Take from Buzan and Huber (2020) Annual Review of Earth and Planetary Sciences, Author provided

Meteorological factors affect all this. For example, being deprived of shade exposes the body to heat from direct sunlight, while higher humidity means that the rate of evaporation from our skin will decrease.

It’s this humidity that meant the recent heatwave in south-east Asia was so dangerous, as it’s already an extremely humid part of the world.

The limit of heat stress

Underlying health conditions and other personal circumstances can lead to some people being more vulnerable to heat stress. Yet heat stress can reach a limit above which all humans, even those who are not obviously vulnerable to heat risk – that is, people who are fit, healthy and well acclimatised – simply cannot survive even at a moderate level of exertion.

One way to assess heat stress is the so-called Wet Bulb Globe Temperature. In full sun conditions, that is approximately equivalent to 39°C in temperature combined with 50% relative humidity. This limit will likely have been exceeded in some places in the recent heatwave across south-east Asia.

In less humid places far from the tropics, the humidity and thus the wet bulb temperature and danger will be much lower. Spain’s heatwave in April with maximum temperatures of 38.8°C had WBGT values of “only” around 30°C, the 2022 heatwave in the UK, when temperatures exceeded 40°C, had a humidity of less than 20% and WBGT values of around 32°C.

Two of us (Eunice and Dann) were part of a team who recently used climate data to map heat stress around the world. The research highlighted regions most at risk of exceeding these thresholds, with literal hotspots including India and Pakistan, south-east Asia, the Arabian peninsula, equatorial Africa, equatorial South America and Australia. In these regions, heat stress thresholds are exceeded with increased frequency with greater global warming.

In reality, most people are already vulnerable well below the survivability thresholds, which is why we can see large death tolls in significantly cooler heat waves. Furthermore, these global analyses often do not capture some very localised extremes caused by microclimate processes. For example a certain neighbourhood in a city might trap heat more efficiently than its surroundings, or might be ventilated by a cool sea breeze, or be in the “rain shadow” of a local hill, making it less humid.

Variability and acclimatisation

The tropics typically have less variable temperatures. For example, Singapore sits almost on the equator and its daily maximum is about 32°C year round, while a typical maximum in London in mid summer is just 24°C. Yet London has a higher record temperature (40°C vs 37°C in Singapore).

Given that regions such as south-east Asia consistently have high heat stress already, perhaps that suggests that people will be well acclimatised to deal with heat. Initial reporting suggests the intense heat stress of the recent heatwave lead to surprisingly few direct deaths – but accurate reporting of deaths from indirect causes is not yet available.

On the other hand, due to the relative stability in year-round warmth, perhaps there is less preparedness for the large swings in temperature associated with the recent heatwave. Given that it is not unreasonable, even in the absence of climate change, that natural weather variability can produce significant heatwaves that break local records by several degrees Celsius, even nearing a physiological limit might be a very risky line to tread.

—————————–


This blog is written by Cabot Institute for the Environment members: Dr Alan Thomas Kennedy-Asser, Research Associate in Climate Science; Professor Dann Mitchell, Professor of Climate Science, and Dr Eunice Lo, Research Fellow in Climate Change and Health, University of Bristol. This article is republished from The Conversation under a Creative Commons license. Read the original article.

Alan Kennedy-Asser
Alan Kennedy-Asser
Dann Mitchell
Dann Mitchell
Eunice Lo
Eunice Lo

Climate change is threatening Madagascar’s famous forests – our study shows how serious it is

Urgent action is needed to protect Madagascar’s forests.
Rijasolo/AFP via Getty Images

Global climate change doesn’t only cause the melting of polar ice caps, rising sea levels and extreme weather events. It also has a direct effect on many tropical habitats and the animals and plants that inhabit them. As fossil fuel emissions continue to drive climate change, large areas of land are forecast to become much hotter and drier by the end of this century.

Many ecosystems, including tropical forests, wetlands, swamps and mangroves, will be unable to cope with these extreme climatic conditions. It is highly likely that the extent and condition of these ecosystems will decline. They will become more like deserts and savanna.

The island nation of Madagascar is of particular concern when it comes to climate change. Of Madagascar’s animal species, 85% cannot be found elsewhere on Earth. Of its plant species, 82% are unique to the island. Although a global biodiversity hotspot, Madagascar has experienced the highest rates of deforestation anywhere in the world. Over 80% of its original forest cover has already been cleared by humans.

This has resulted in large population declines in many species. For example, many species of lemurs (Madagascar’s flagship group of animals) have undergone rapid population decline, and over 95% of lemur species are now classified as threatened on the International Union for Conservation of Nature (IUCN) Red List.

Drier conditions brought about by climate change have already resulted in widespread bush fires throughout Madagascar. Drought and famine are increasingly severe for the people living in the far south and south-western regions of the island.

Madagascar’s future will likely depend profoundly on how swiftly and comprehensively humans deal with the current climate crisis.

What we found

Our study investigated how future climate change is likely to affect four of Madagascar’s key forest habitat types. These four forest types are the dry deciduous forests of the west, humid evergreen forests of the east, spiny bush forests of the arid south, and transitional forests of the north-west corner of the island.

Using computer-based modelling, we simulated how each forest type would respond to climate change from the current period up to the year 2080. The model used the known distribution of each forest type, and current and future climatic data.

We did this under two different conditions: a mitigation scenario, assuming human reliance on greenhouse gas reduces according to climate commitments already made; and an unmitigated scenario, assuming greenhouse gas emissions continue to increase at their current rate.

Our results suggest that unmitigated climate change will result in declines of Madagascar’s forests. The area of land covered by humid forest, the most extensive of the four forest types, is predicted to decrease by about 5.66%. Dry forest and spiny bush are also predicted to decline in response to unmitigated climate change. Transitional forest may actually increase by as much as 5.24%, but this gain will almost certainly come at the expense of other forest types.

We expected our model to show that mitigating climate change would result in net forest gain. Surprisingly, our results suggest entirely the opposite. Forest occurrence will decrease by up to 5.84%, even with efforts to mitigate climate change. This is because global temperatures are forecast to increase under both mitigated and unmitigated scenarios.

These predicted declines are in addition to the huge losses of forest already caused by ongoing deforestation throughout the island.

It looks as if the damage has already been done.

Climate change, a major threat

The results of our research highlight that climate change is indeed a major threat to Madagascar’s forests and likely other ecosystems worldwide. These findings are deeply concerning for the survival of Madagascar’s animals and plants, many of which depend entirely on forest habitat.

Not only will climate change decrease the size of existing forests, changes in temperature and rainfall will also affect the amount of fruit that trees produce.

A Lemur on tree in the forest.
Madagascar lemurs and other animal and plant species may become extinct if the forests disappear.
Rijasolo/AFP

Many of Madagascar’s animals, such as its lemurs, rely heavily on fruit for food. Changes in fruit availability will have serious impact on the health, reproductive success and population growth of these animals. Some animals may be able to adapt to changes in climate and habitat, but others are very sensitive to such changes. They are unlikely to survive in a hot, arid environment.

This will also have serious knock-on effects for human populations that depend on forests and animals for eco-tourism income. Approximately 75% of Madagascar’s population depends on the forest and subsistence farming for survival, and the tourism sector contributes over US$600 million towards the island’s economy annually.

To ensure that Madagascar’s forests survive, immediate action is needed to end deforestation, protect the remaining patches of forest, replant and restore forests, and mitigate global carbon emissions. Otherwise these remarkable forests will eventually disappear, along with all the animals and plants that depend on them.The Conversation

——————————

This blog is written by Daniel Hending, Postdoctoral Research Assistant Animal Vibration Lab, University of Oxford and Cabot Institute for the Environment member Marc Holderied, Professor in Sensory Biology, University of BristolThis article is republished from The Conversation under a Creative Commons license. Read the original article.

Marc Holderied


The Horn of Africa has had years of drought, yet groundwater supplies are increasing – why?


Harvepino / shutterstock

The Horn of Africa – which includes Somalia, Ethiopia, Kenya and some surrounding countries – has been hit by increasingly frequent and devastating droughts. Despite this, it seems the region has an increasing amount of groundwater. And this water could help support drought-stricken rural communities.

That’s the key finding from our new research, in which we discovered that while overall rainfall is decreasing, an increase in “high-intensity” rainfall has led to more water being stored deep underground. It’s a paradoxical finding, yet one that may help one of the world’s most vulnerable regions adapt to climate change.

In the Horn of Africa, rural communities live in a constant state of water scarcity punctuated by frequent periods of food insecurity. People there rely on the “long rains” between March and May and the “short rains” between October and December to support their lives and livelihoods.

As we write this, the region’s drylands are experiencing a fifth consecutive season of below-average rainfall. This has left 50 million people in acute food insecurity. The droughts have caused water shortages, livestock deaths, crop failures, conflict and even mental health challenges.

The drought is so severe that it is even affecting zebras, giraffes and other wildlife, as all surface waters are drying up and edible vegetation is becoming scarce. Worryingly, a sixth failed rainy season has already been predicted for March to May 2023.

Long rains down, short rains up

In a new paper we investigated changes in seasonal rainfall in the Horn of Africa over the past 30 years. We found the total rainfall within the “long rains” season is declining, perhaps related to the warming of a particular part of the Pacific Ocean. However, rainfall is increasing in the “short rains”. That’s largely due to a climate phenomenon known as the Indian Ocean Dipole, when a warmer-than-usual Indian Ocean produces higher rainfall in east Africa, similar to El Niño in the Pacific.

We then investigated what these rainfall trends mean for water stored below ground. Has it decreased in line with declining “long rains”, or risen due to the increasing “short rains”?

Map of East Africa
The Horn of Africa borders the Red Sea, the Gulf of Aden and the Indian Ocean.
Peter Hermes Furian / shutterstock

To do this we made use of a pair of satellites which orbit repeatedly and detect small changes in the Earth’s gravitational field that can be interpreted as changes in the mass of water storage. If there’s a significant increase in water storage underground, then the satellite will record a stronger gravity field at that location compared to the previous measurement, and vice versa. From this, the mass of water added or lost in that location can be determined.

Using these satellite-derived estimates, we found that water storage has been increasing in recent decades. The increase correlates with the increasing “short rains”, and has happened despite the “long rains” getting drier.

Given that the long rains deliver more seasonal rain than the short rains, we wanted to understand the paradoxical finding that underground water is increasing. A clue is given by examining how rainfall is converted into groundwater in drylands.

When rain is light and drizzly, much of the water that reaches the ground dampens the soil surface and soon evaporates back into the warm, dry atmosphere. To become groundwater, rainfall instead needs to be intense enough so that water will quickly infiltrate deep into the soil. This mostly happens when lots of rain falls at once and causes dry riverbeds to fill with water which can then leak into underground aquifers.

People stand in river, rainy sky.
Heavy rains fill a dry river bed in the Somali region of Ethiopia.
Stanley Dullea / shutterstock

These most intense rainfall events are increasing in the “short rains”, in line with the overall increase in total rain in that season. And despite a decrease in overall rainfall in the “long rains”, intense rainfall has remained consistently high over time. This means that both rainy seasons have enough intense rainfall to increase the amount of water stored underground.

Finally, we demonstrated that the increasing water storage in this region is not connected to any rise in soil moisture near the surface. It therefore represents “banked” water that resides deep below ground and likely contributes to a growing regional groundwater aquifer in this region.

Groundwater can help people adapt to climate change

While early warning networks and humanitarian organisations focus on the urgent impacts of drought, our new research points to a silver lining that may support long-term climate adaptation. Those rising groundwater supplies we have identified may potentially be exploited to support people in rural areas whose food and water are increasingly insecure.

But there are some caveats. First, we have not assessed the depth of the available groundwater across the region, but we suggest that the water table is shallow enough to be affected by seasonal rainfall. This means it may also be shallow enough to support new bore holes to extract it. Second, we do not know anything about the quality of the stored groundwater and whether it can be deemed suitable for drinking. Finally, we do not know exactly what will happen if the most extreme droughts of the past few seasons continue and both long and short rains fail, causing intense rainfall to decrease too.

Nevertheless, our findings point to the need for extensive groundwater surveys across the Horn of Africa drylands to ascertain whether this increasing water resource may be viable enough to offset the devastating droughts. Groundwater could potentially irrigate fields and provide drinking water for humans and livestock, as part of a strategy to help this vulnerable region adapt to the effects of climate change.The Conversation

————————

This blog was written by Cabot Institute for the Environment member Katerina Michaelides, Associate Professor, School of Geographical Sciences, University of BristolMichael Singer, Professor in Physical Geography (Hydrology and Geomorphology), Cardiff University; and Markus Adloff, PostDoctoral Researcher, Earth System Modelling, Université de BerneThis article is republished from The Conversation under a Creative Commons license. Read the original article.

India heatwave: why the region should prepare for even more extreme heat in the near future

An extreme heatwave in India and Pakistan has left more than a billion people in one of the most densely populated parts of the world facing temperatures well above 40℃. Although this has not broken all-time records for the regions, the hottest part of the year is yet to come.

Though the heatwave is already testing people’s ability to survive, and has led to crop failures and power blackouts, the really scary thing is that it could be worse: based on what has happened elsewhere at some point India is “due” an even more intense heatwave.

Together with a few other climate scientists, we recently looked for the most extreme heatwaves globally over the past 60 years – based on the greatest difference from expected temperature variability in that area, rather than by maximum heat alone. India and Pakistan do not feature in our results, now published in the journal Science Advances. Despite regularly having extremely high temperatures and levels of heat stress in absolute terms, when defined in terms of deviation from the local normal, heatwaves in India and Pakistan to date have not been all that extreme.

In fact, we highlighted India as a region with a particularly low greatest historical extreme. In the data we assessed, we didn’t find any heatwaves in India or Pakistan outside three standard deviations from the mean, when statistically such an event would be expected once every 30 or so years. The most severe heatwave we identified, in southeast Asia in 1998, was five standard deviations from the mean. An equivalent outlier heatwave in India today would mean temperatures of over 50℃ across large swaths of the country – such temperatures have only been seen at localised points so far.

Our work therefore suggests India may experience even more extreme heat. Assuming the statistical distribution of daily maximum temperatures is broadly the same across the world, statistically a record-breaking heatwave is likely to occur in India at some point. The region has not yet had reason to adapt to such temperatures, so may be particularly vulnerable.

Harvests and health

Although the current heatwave has not broken any all-time records, it is still exceptional. Many parts of India have experienced their hottest April on record. Such heat this early in the year will have devastating impacts on crops in a region where many rely on the wheat harvest both to eat and to earn a living. Usually, extreme heat in this area is closely followed by cooling monsoons – but these are still months away.

It is not just crop harvests that will bear the brunt, as heatwaves affect infrastructure, ecosystems and human health. The impacts on human health are complex as both meteorological factors (how hot and humid it is) and socioeconomic factors (how people live and how they are able to adapt) come into play. We do know that heat stress can lead to long-term health issues such as cardiovascular diseases, kidney failure, respiratory distress and liver failure, though we will be unable to know exactly how many people will die in this heatwave due to the lack of necessary health data from India and Pakistan.

What the future holds

To consider the impact of extreme heat over the next few decades, we have to look at both climate change and population growth, since it is a combination of the two that will amplify the human-health impacts of heat extremes in the Indian subcontinent.

world map with some countries shaded yellow
Hotspots of population increases over the next 50 years (red circles), all coincide with locations where no daily mortality data exists (yellow).
Mitchell, Nature Climate Change (2021), CC BY-SA

In our new study, we investigated how extremes are projected to increase in the future. We used a large ensemble of climate model simulations, which gave us many times more data than is available for the real world. We found that the statistical distribution of extremes, relative to a shift in the underlying climate as it generally gets warmer, does not change. In the climate models the daily temperature extremes increase at the same rate as the shift in the mean climate. The IPCC’s latest report stated that heat waves will become more intense and more frequent in south Asia this century. Our results support this.

The current heatwave is affecting over 1.5 billion people and over the next 50 years the population of the Indian subcontinent is projected to increase by a further 30%. That means hundreds of millions more people will be born into a region that is likely to experience more frequent and more severe heatwaves. With even larger numbers of people being affected by even greater heat extremes in the future, measures to adapt to climate change must be accelerated – urgently.The Conversation

————————-

This blog is written by Cabot Institute for the Environment members Dr Vikki Thompson, Senior Research Associate in Geographical Sciences, University of Bristol and Dr Alan Thomas Kennedy-Asser, Research Associate in Climate Science, University of Bristol.

This article is republished from The Conversation under a Creative Commons license. Read the original article.

How water stress impacts on migration

In this special blog series, Migration Mobilities Bristol (MMB) and the Cabot Institute for the Environment bring together researchers from across the University of Bristol to explore connections between movement and the environment from a multi-disciplinary perspective. Their diverse approaches highlight the importance of developing frames that incorporate both migration and environment, and in so doing benefit our understandings of both. 

————————————-

In 2015, Ioane Teitiota and his family were deported from New Zealand to the Pacific island nation of Kiribati. His asylum application had been based on the grounds that water, due to sea level rise, had made the island uninhabitable in various ways: there was a shortage of clean drinking water; the available habitable land had decreased, which had led to increased insecurity because of violent land disputes; and the main activity, subsistence farming, was impeded.

Water has always had a major influence on where we live. Whether drawing us to new locations or forcing us from existing ones, water has always been intricately connected to the movement of people. As soon as it was possible to navigate the wide-open sea, water facilitated exploration to new lands. Later, being on these wide, open seas offered hope to millions fleeing world wars, presenting a somewhat invincible fortress protecting them from persecution, suffering and premature demise. More recently, the drowning of at least 27 men, women and children attempting to make the crossing from France to England brought into sharp focus how some things have not changed since those world wars: many are still crossing seas to flee persecution, suffering and premature demise.

In recent times, it is increasingly recognised that climate change will be a significant driver of migration. Island states such as Tonga and Micronesia already have negative net migration rates and projections are that stressed freshwater resources and water-related extreme events (such as floods) will drive more migration from island states because of food insecurity and habitat loss. Some states are already purchasing land to relocate citizens, as this is considered the only reliable adaptive response. By 2014, Kiribati had purchased 6,000 acres of forest land from Fiji: ahead of the UN climate summit that year, Anote Tong, Kiribati’s president at the time, said that buying land abroad was the way to ensure ‘migration with dignity’. Meanwhile, 6,000 km to the east, the world’s ‘first environmental refugees’ were already setting up new homes in Bougainville, an autonomous island of Papua New Guinea. They had left islands that were becoming increasingly uninhabitable as sea water ingress led to shortages in arable land and clean drinking water.

It is debatable, however, whether the islanders migrating to Bougainville are indeed the world’s first group of people forced to leave their ancestral lands due to climatic changes. Lake Chad, in west Africa was once the sixth largest inland water body, with an open water area of 25,000 km2 in the 1960s. By the 1980s, over 90% of the lake had been lost due to decreased precipitation, sparking significant internal and international migration. By 2015, more than 71,000 people from Nigeria and North Cameroon had moved towards the lake’s receding shores. As the ever-growing numbers scrambled for a portion of the limited water resources to farm, water their livestock and maintain their livelihoods, violence erupted that led to further migration out of the region. With limited non-agricultural skills and no source of capital to engage in alternative livelihood strategies the situation for these people is extremely precarious.

These two case studies challenge the narrative that climate change will drive migration in the future. They show that it already does. The situation is only likely to get worse as more regions of the world are affected, and yet, the impact of water crises on migration is not well documented.

Environmental migrants

No legal definition exists to date, for people on the move due to environmental drivers. However, the International Organisation for Migration put forward the following definition in 2007:

… persons or groups of persons who, predominantly for reasons of sudden or progressive change in the environment that adversely affect their lives or living conditions, are obliged to leave their habitual homes or choose to do so, either temporarily or permanently, and who move either within their country or abroad.

(IOM, 2007:1)

Water scarcity is bound to be a major driver of migration given that 17 countries, home to 25% of the global population, are already experiencing water stress (see Figure 1). The poorest of the global population will be the most adversely affected, but, without the necessary resources, they are also the least able to leave their homelands to seek livelihoods elsewhere. It is therefore unlikely that the world will see waves of impoverished ‘water refugees’ crossing oceans and landing on the shores of wealthy nations. The World Bank estimates that residents of poor countries are four times less likely to move than residents of middle-income countries. But their inability to move will severely impact their chances of survival.

Figure 1: Predicted global water stress between 2030 and 2040 (Image: OpenStreetMap)


Conceptualising water as a driver of migration

Water has always been both a push and pull factor for migration: places with adequate sources will attract migrants while diminishing reserves have the opposite effect. To assess the interconnection between water and migration, a 3D model encompassing water quantity, water quality and water-related extremes has been suggested (see Figure 2). Deterioration of water quality – for example, resulting from chemical contamination or increased salinity – will push people away from habitats due to adverse health impacts. Increased salinity can also significantly impact food security, leading to out-migration. The third factor, water extremes – such as floods or droughts – impact both quality and quantity, but their impact on the nature of migration (whether it is temporary or permanent) depends on how frequently these events occur.

Figure 2: Three-dimensional framework conceptualising the links between water and migration (Image: Nagabhatla et al., 2020).

Which way forward?

It is important to acknowledge the ways in which water migration results in unfair outcomes both for those with means to escape water-scarce areas and those without. In developing countries, wages of workers who move from rural to urban areas due to drier climates may be up to 3.4% lower than that of a typical immigrant – a significant amount for those already on a very low income. For those unable to leave their water-scarce homes, diminished food security and loss of income from agriculture present significant blows to already disadvantaged communities.

In urban areas water supplies are also under threat from climate change. Doing nothing could prove extremely costly to local and global economies, both increasing involuntary migration and severely impacting on communities without resources to fund migration. It is therefore crucial to invest in infrastructure and policies that enhance resilience within cities as well as rural areas. Water recycling, rainwater harvesting and incentives for efficient water use are tools that can be employed to this end. Evidence shows that while people may initially be resistant to using recycled water, their willingness increases when all available options are weighed up.

Finally, protecting livelihoods at the place of origin needs to be a key strategy for addressing water-induced population movement. In rural areas climate-smart agriculture can help towards reducing the vulnerability of communities and their livelihoods to diminished water resources. In Senegal, for example, high yielding, early maturing and drought resistant varieties of sorghum, millet, cowpeas and groundnuts are being developed as an adjustment to the shorter rain seasons. Traditional varieties required at least 120 days and plenty of rain to harvest, but new varieties require less than 110 days and can withstand two to three week stretches without rain. Instead of giving up farming therefore, farmers can stay on their lands and farm in ways that are adaptable to water scarcity and a variable climate.

——————————–

This blog is written by Dr Anita Etale, a Research Associate at the Department of Aerospace Engineering at the University of Bristol. Her research focuses on finding sustainable materials for water treatment using sustainable resources as well as the environmental and social implications of water stress on communities. Anita is MMB’s Early Career Representative.

How ancient plants ‘learnt’ to use water when they moved on to land – new research

Focal point/Shutterstock

“Plants, whether they are enormous, or microscopic, are the basis of all life including ourselves.” This was David Attenborough’s introduction to The Green Planet, the latest BBC natural history series.

Over the last 500 million years, plants have become interwoven into every aspect of our lives. Plants support all other life on Earth today. They provide the oxygen people breathe, as well as cleaning the air and cooling the Earth’s temperature. But without water, plants would not survive. Originally found in aquatic environments, there are estimated to be around 500,000 land plant species that emerged from a single ancestor that floated through the water.

In our recent paper, published in New Phytologist, we investigate, at the genetic level, how plants have learnt to use and manipulate water – from the first tiny moss-like plants to live on land in the Cambrian period (around 500 million years ago) through to the giant trees forming complex forest ecosystems of today.

How plants evolved

By comparing more than 500 genomes (an organism’s DNA), our results show that different parts of plant anatomies involved in the transport of water – pores (stomata), vascular tissue, roots – were linked to different methods of gene evolution. This is important because it tells us how and why plants have evolved at distinct moments in their history.

Plants’ relationship with water has changed dramatically over the last 500 million years. Ancestors of land plants had a very limited ability to regulate water but descendants of land plants have adapted to live in drier environments. When plants first colonised land, they needed a new way to access nutrients and water without being immersed in it. The next challenge was to increase in size and stature. Eventually, plants evolved to live in arid environments such as deserts. The evolution of these genes was crucial for enabling plants to survive, but how did they help plants first adapt and then thrive on land?

Stomata, the minute pores in the surface of leaves and stems, open to allow the uptake of carbon dioxide and close to minimise water loss. Our study found that the genes involved in the development of stomata were in the first land plants. This indicates that the first land plants had the genetic tools to build stomata, a key adaptation for life on land.

The speed in which stomata respond varies between species. For example, the stomata of a daisy close more quickly than those of a fern. Our study suggests that the stomata of the first land plants did close but this ability speeded up over time thanks to gene duplication as species reproduced. Gene duplication leads to two copies of a gene, allowing one of these to carry out its original function and the other to evolve a new function. With these new genes, the stomata of plants that grow from seeds (rather reproducing via spores) were able to close and open faster, enabling them to be more adaptable to environmental conditions.

Images of a plant's stomata, open and closed.
Shutterstock

Old genes and new tricks

Vascular tissue is a plant’s plumbing system, enabling it to transport water internally and grow in size and stature. If you have ever seen the rings of a chopped tree, this is the remnants of the growth of vascular tissue.

We found that rather than evolving by new genes, vascular tissue emerged through a process of genetic tinkering. Here, old genes were repurposed to gain new functions. This shows that evolution does not always occur with new genes but that old genes can learn new tricks.

Before the move to land, plants were found in freshwater and marine habitats, such as the algal group Spirogyra. They floated and absorbed the water around them. The evolution of roots enabled plants to access water from deeper in the soil as well as providing anchorage. We found that a few key new genes emerged in the ancestor of plants that live on land and plants with seeds, corresponding to the development of root hairs and roots. This shows the importance of a complex rooting system, allowing ancient plants to access previously unavailable water.

A dam floor cracked by lack of water.
Hot weather and climate changes left this Bulgarian dam almost empty in 2021.
Minko Peev/Shutterstock

The development of these features at every major step in the history of plants highlights the importance of water as a driver of plant evolution. Our analyses shed new light on the genetic basis of the greening of the planet, highlighting the different methods of gene evolution in the diversification of the plant kingdom.

Planting for the future

As well as helping us make sense of the past, this work is important for the future. By understanding how plants have evolved, we can begin to understand the limiting factors for their growth. If researchers can identify the function of these key genes, they can begin to improve water use and drought resilience in crop species. This has particular importance for food security.

Plants may also hold the key to solving some of the most pressing questions facing humanity, such as reducing our reliance on chemical fertilisers, improving the sustainability of our food and reducing our greenhouse gas emissions.

By identifying the mechanisms controlling plant growth, researchers can begin to develop more resilient, efficient crop species. These crops would require less space, water and nutrients and would be more sustainable and reliable. With nature in decline, it is vital to find ways to live more harmoniously in our green planet.The Conversation

———————-

This blog has been written by Alexander Bowles, research associate, University of Bristol.

This article is republished from The Conversation under a Creative Commons license. Read the original article.

Alexander Bowles


#CabotNext10 Spotlight on Water


Dr Katerina Michaelides

In conversation with Dr Katerina Michaelides, co-theme lead at the Cabot Institute

Why did you choose to become a theme leader at Cabot Institute?

I was particularly attracted to this role because I am strongly committed to increasing the visibility of the great water-related work going on in the University, and because I feel strongly about developing the water research community within Bristol and further afield. Over the years since its creation, Cabot Institute has been instrumental in developing my connections with others within the University, in fostering new collaborations and in encouraging new and creative avenues of research. In that same spirit, I relished the opportunity to perform a similar role within the Cabot Water theme and give back to the community by helping to foster collaborations, contacts, and new avenues of research. I believe in the Cabot mission and ethos and felt that I can help strengthen the Water theme in this more formal role.

In your opinion, what is one of the biggest global challenges associated with your theme? (Feel free to name others if there is more than one)

One of the biggest impacts of climate change is on the water cycle. In fact, climate change can be thought of as synonymous with changes in the water cycle with far reaching implications for lives and livelihoods. Think catastrophic storms, droughts, floods, declining water quality. Water is such a fundamental part of life that many in the global north take for granted. So if I was to say one biggest challenge, I would say: addressing global water scarcity and food insecurity challenges under climate change and anthropogenic pressures. There are of course, many other challenges….

Across the portfolio of projects in your theme, what type of institutions are you working with? (For example, governments, NGO’s)

Our theme members work with a huge range of non-academic institutions – from insurance companies, charities, climate services providers, NGOs, local businesses among others.

What disciplines are currently represented within your theme?

We have a broad set of disciplines within the Water theme. These range from water and sanitation, climate impacts on water balance, flood risk and hazard modelling, flooding and infrastructure resilience, freshwater biogeochemistry (water quality), hydrometeorology, dryland hydrology, tropical hydrology, hydrological modelling, forecasting floods and droughts, water, and humanities. And much more!

In your opinion, why is it important to highlight interdisciplinary research both in general and here at Bristol?

Global challenges related to water and climate impacts are inherently multi- and interdisciplinary in their nature. It starts from understanding how climate is changing, to how these changes impact the water balance on the ground hydrology) and may lead to destructive floods or devastating droughts through their effect on agriculture and drinking water. Ultimately, because water intersects society on so many different levels (from natural disasters, to agriculture, to water resources, to droughts) research needs to be interdisciplinary and consider both environmental and social aspects of the problem.

Are there any projects which are currently underway in your theme which are interdisciplinary that you believe should be highlighted in this campaign?

There are lots of interdisciplinary projects across the Water theme. Personally, our research focusses on water scarcity, as highlighted by these two projects below:

Drought Resilience in East African dryland Regions (DRIER) – This is a collaboration between hydrologists, climatologists, social scientists, livelihoods experts, climate adaptation experts. Awarded a Royal Society Grant of £500K for 2020-2023, with Bristol leading and colleagues from Cardiff, UEA, University of Nairobi, and Addis Ababa University. DRIER has been selected as case study for the Royal Society Challenge-Led grant scheme and by BEIS for the GCRF.

Mobile App Development for Drought Adaptation in Drylands (MADDAD) – This interdisciplinary project between hydrologists and computer scientists, funded by a GCRF Translational Award (2019-2021) is developing a mobile phone app to deliver water status forecasts to remote communities in Kenyan drylands. Under climate change droughts are set to become more intense and frequent and there is a pressing need for relevant, timely, and practical information about water resources, particularly with a view to climate change adaptation. However, rural agro-pastoral populations are sparse and distant from decision-making centres making it hugely challenging to disseminate useable information in a timely manner. The provision of a mobile phone app has the potential to transform decision-making and drought adaptation for a large number of people in remote, rural dryland regions of East Africa that currently do not have access to useable and relevant information about the short- and long-term changes in water scarcity in their location.

Down2Earth – Translation of climate information into multilevel decision support for social adaptation, policy development, and resilience to water scarcity in the Horn of Africa Drylands. Awarded an EU H2020 Grant of €6.7M for 2020-2024, with Cardiff University as the lead Institution and ~€1M to University of Bristol. In total, 15 Institutions across UK, EU, East Africa, are involved, including many non-academic actors. This project is completely multi-disciplinary in nature.

For more information, visit Water.

Is Europe heading for a more drought prone future?

Parched landscape of Europe during the 2018 drought. Image credit: NASA, CC0

In 2018, Europe was hit with one of the worst droughts so far in the 21st century in terms of its extent, severity and duration. This had large-scale effects on the vegetation, both agricultural and natural. Harvest yields were substantially reduced, by up to 40% in some regions, and widescale browning of vegetation occurred.

A consortium of international researchers, including members of the Atmospheric Chemistry Research Group (ACRG) at the University of Bristol, asked the question: given the major impacts on vegetation, which plays an essential role in removing carbon dioxide (CO2) from the air, was there an observable change in the amount of carbon uptake across Europe during this event?

There are at least two ways to quantify the impact that the drought had on the terrestrial carbon sink: a bottom-up or top-down approach. Our plans and timelines to mitigate climate change rely on using these methods to predict how much of anthropogenic greenhouse gas emissions can be taken up by the natural biosphere. Currently, the terrestrial carbon sink (i.e. vegetation and soils) takes up approximately a third of manmade emissions. The oceans take up about a similar amount. But this important carbon sink is subject to variation brought about by naturally occurring variation in the climate and manmade climate change.

To investigate the impact of the drought on the European terrestrial carbon sink, modellers can predict how individual processes that contribute to the terrestrial sink would respond to the climate during that period – a bottom-up approach. For example, a study by Bastos et al. (2019) compared the estimates of net ecosystem exchange during the drought period from 11 vegetation models. Net ecosystem exchange quantifies the amount of CO2 that is either taken up or released from the ecosystem and is usually quantified as a flux of CO2 to the atmosphere. This value is negative if the ecosystem is a sink and positive if it is a source of CO2 to the atmosphere. The consensus from previous studies was that an unusually sunny spring led to early vegetation growth, which depleted soil moisture, which intensified the drought during the summer period. Although more CO2 was taken up by the biosphere in spring, in some European regions, like Central Europe, the lack of rain during the summer months meant that the soils, already depleted in water, could not maintain the vegetation, and this led to CO2 losses from the ecosystem.

At the ACRG we use measurements of gases in the atmosphere, like CO2, to improve estimates of emissions and uptake of these gases using a top-down approach called inverse modelling. Measurements are obtained from carefully calibrated instruments that are part of global networks of measurement sites like AGAGE (Advanced Global Atmospheric Gases Experiment) and ICOS (Integrated Carbon Observation System). We also require initial estimates of the fluxes, which we obtain from several sources, including vegetation models and bottom-up inventories, and a model that describes atmospheric transport of the gas (a model that describes how a pocket of air will travel in the atmosphere). Using a statistical approach, we can then improve on those initial estimates to get better agreement between the modelled and observed concentrations at the measurement sites. With this method, we have to account for all sources of a gas, both anthropogenic and natural, as the concentration that is recorded at a measurement site is the sum of all contributions from all sources.

In a recent publication by Thompson et al. (2020), we compared the CO2 flux estimates for regions in Europe over the last ten years using the ACRG modelling method, along with four other approaches. The combined estimate from these five modelling systems indicated that the temperate region of Europe (i.e. Central Europe) was a small source of CO2 during 2018. This means that when carbon losses due to plant and soil respiration are compared with the carbon uptake by photosynthesis, then a small positive amount was emitted to the atmosphere on balance. This is described by a positive net flux of 0.09 ± 0.06 PgC y-1 (mean ± SD) to the atmosphere, compared with the mean of the last 10 years of -0.08 ± 0.17 PgC y-1, which is a net sink of carbon, meaning that over the last 10 years more carbon was taken up by photosynthesis than emitted through ecosystem respiration. Northern Europe was also found to be a small source in 2018. This publication was part of a special issue on the impacts of the 2018 drought on Europe.

So what does this tell us about how carbon uptake might change in the future? A 2018 study by Samaniego et al. considered future projections from climate models under different scenarios ranging from 1°C to 3°C global temperature rise. They concluded that soil moisture droughts were set to become 40% more likely by the end of the 21st century under the current 3°C future compared with 1.5°C set out in the Paris Climate Agreement. Droughts like the previous “Lucifer” event in 2003, where as many as 35,000 people lost their lives due to the effects of the drought, are expected to become twice as likely. Failing to reduce greenhouse gas emissions so that we mitigate the global temperature rise will impact on our ability to grow food and make killer drought events more likely. Our study shows that more frequent droughts will reduce the biosphere’s ability to take up our CO2 emissions due to the impact of a warmer climate on the soil and vegetation of key natural sinks, and lead to fundamental changes in the structure and species composition of these systems into the future. Unfortunately, this will further exacerbate the effects of climate change.

Bibliography

A. Bastos, P. Ciais, P. Friedlingstein, S. Sitch, J. Pongratz, L. Fan, J. P. Wigneron, U. Weber, M. Reichstein, Z. Fu, P. Anthoni, A. Arneth, V. Haverd, A. K. Jain, E. Joetzjer, J. Knauer, S. Lienert, T. Loughran, P. C. McGuire, H. Tian, N. Viovy, S. Zaehle. Direct and seasonal legacy effects of the 2018 heat wave and drought on European ecosystem productivity. Science Advances, 2020; 6 (24): eaba2724 DOI: 10.1126/sciadv.aba2724

M. Reuter, M. Buchwitz, M. Hilker, J. Heymann, H. Bovensmann, J.P. Burrows, S. Houweling, Y.Y. Liu, R. Nassar, F. Chevallier, P. Ciais, J. Marshall, M. Reichstein. How much CO2 is taken up by the European Terrestrial Biosphere? Bulletin of the American Meteorological Society, 2017; 98 (4): 665-671 DOI: 10.1175/BAMS-D-15-00310.1

L. Samaniego, S. Thober, R. Kumar, N. Wanders, O. Rakovec, M. Pan, M. Zink, J. Sheffield, E.F. Wood, A. Marx. Anthropogenic warming exacerbates European soil moisture droughts. Nature Climate Change, 2018; 8, 421-426 DOI: 10.1038/s41558-018-0138-5

R.L. Thompson, G. Broquet, C. Gerbig, T. Kock, M. Lang, G. Monteil, S. Munassar, A. Nickless, M. Scholze, M. Ramonet, U. Karstens, E. van Schaik, Z. Wu, C. Rödenbeck. Changes in net ecosystem exchange over Europe during the 2018 drought based on atmospheric observations. Philosophical Transactions of the Royal Society B, 2020; 375 (1810): 20190512 DOI: 10.1098/rstb.2019.0512

————————————-

This blog is written by Cabot Institute member Dr Alecia Nickless, a research associate in the School of Chemistry at the University of Bristol.