Earth’s greatest mass extinction 250 million years ago shows what happens when El Niño gets out of control – new study

252 million years ago, there was only one supercontinent: Pangaea.
ManuMata / shutterstock

Around 252 million years ago, the world suddenly heated up. Over a geologically brief period of tens of thousands of years, 90% of species were wiped out. Even insects, which are rarely touched by such events, suffered catastrophic losses. The Permian-Triassic mass extinction, as it’s known, was the greatest of the “big five” mass extinctions in Earth’s history.

Scientists have generally blamed the mass extinction on greenhouse gases released from a vast network of volcanoes which covered much of modern day Siberia in lava. But the volcanic explanation was incomplete. In our new study, we show that an enormous El Niño weather pattern in the world’s major ocean added to climate chaos and led to extinctions spreading across the globe.

It’s easy to see why volcanoes were blamed. The onset of extinction coincides almost perfectly with the beginning of the second phase of volcanism in the region known as the Siberian Traps. This led to acid rain, oceans losing their oxygen and, most notably, temperatures beyond the tolerance levels of almost all organisms. It was the greatest episode of global warming in the past 500 million years.

The world 252 million years ago

Map of world with one big supercontinent
Alex Farnsworth

However, there were outstanding questions for proponents of this seemingly simple extinction scenario: when the tropics became too hot, why did species not just migrate to cooler, higher latitudes (as is happening today)? If warming was sudden and rapid, why did species on land die off tens of thousands of years before those in the sea?

There have also been many instances of volcanic eruptions of similar scale, and even other episodes of rapid warming, but why did none of these cause a similarly catastrophic mass extinction?

Our new study reveals that the oceans rapidly heated up all across the world’s low and mid latitudes. Normally, it gets cooler as you move away from the tropics, but not this time. It simply became too hot for life in too many places.

A world prone to extremes

Using a state-of-the-art computer program, we were able to simulate what the weather and climate was like 252 million years ago. We found that, even before the rapid warming, the world would have been prone to extremes of temperature and rainfall.

That’s a consequence of all the land at the time forming into one large supercontinent, Pangaea. This meant that the climates we see today at the centre of continents – dry, with hot summers and freezing winters – were magnified.

Pangaea was surrounded by a vast ocean, Panthalassa, the surface of which would fluctuate between warm and cool periods over the years, much like the El Niño phenomenon in the Pacific today. Yet once the mass Siberian volcanism started and carbon dioxide in the atmosphere increased, those prehistoric El Niños became more intense and lasted longer thanks to the larger Panthalassa ocean being able to store more heat.

An El Niño far stronger than anything today

chart of el nino fluctuations
Change in sea surface temperature (SST) compared to the long-term average. El Niño conditions are red, La Niña (or its prehistoric equivalent) is blue. Left = modern day pre-industrial Pacific Ocean. Centre = 252 million years ago, before the Siberian Traps volcanism. Right = at the peak of the mass extinction.
Alex Farnsworth

These El Niños had a profound impact on life on land, and kicked off a sequence of events that made the climate more and more extreme. Temperatures got hotter, especially in the tropics, and huge droughts and fires caused tropical forests to die off.

This in turn was bad news for the climate, as less carbon was stored by trees, allowing more to linger in the atmosphere, leading to further warming, and even stronger and longer El Niños.

252 million years ago, pre crisis:

Animated map of temperature 252m years ago
Before the Siberian Traps volcanism 252 million years ago, the world was slightly hotter than today. (Animation shows average monthly temperatures according to the authors’ climate model).
Alex Farnsworth

These stronger El Niños caused the extreme temperatures and droughts to push outside of the tropics towards the poles, and more vegetation died off and more carbon was released. Over tens of thousands of years, extreme temperatures spread over much of the world’s surface. Eventually, the warming began to harm life in the oceans, particularly tiny organisms at the bottom of the food chain.

…and at the peak of the extinction:

Animated map of temperature 252m years ago
At the peak of the extinction, temperatures regularly soared far above 40°C.
Alex Farnsworth

During the peak of the crisis, in a world that was already warming thanks to volcanic gases, an El Niño would boost average temperatures by a further 4°C. That’s more than three times the total warming we have caused over the past few centuries. Back then, the El Niño-charged climate would have regularly seen peak daytime temperatures on land of 60°C or more.

The future of El Niño

In recent years El Niños have caused major changes to rainfall and temperature patterns, around the Pacific and even further afield. A strong El Niño was a factor in record-breaking temperatures through 2023 and 2024.

Fortunately, such events typically only last a few years. However, on top of human-caused warming, even these smaller scale El Niños of the present day may be enough to push fragile ecosystems beyond their limit.

El Niño is predicted to become more variable as the climate changes, though we should note that the oceans are still yet to fully respond to current warming rates. At present, nobody is forecasting another mass extinction on the scale of the one 252 million years ago, but that event provides a worrying snapshot of what happens when El Niño gets out of control.The Conversation

———————————

This blog is written by Dr Alex Farnsworth, Senior Research Associate in Meteorology, University of Bristol; David Bond, Palaeoenvironmental Scientist, University of Hull, and Paul Wignall, Professor of Palaeoenvironments, University of LeedsThis article is republished from The Conversation under a Creative Commons license. Read the original article.

Building resilience of the UK food system to weather and climate shocks

Climate-driven changes in extreme weather events are one of the highest-risk future shocks to the UK food system, underlining the importance of preparedness across the food chain. However, the CCC’s 2023 report on adaptation progress highlighted that current climate adaptation plans and policies, and their delivery and implementation for UK food security are either insufficient or limited. Through an ongoing Met Office cross-academic partnership activity (‘SuperRAP’) working across all eight partner universities (including Bristol), Defra, the Food Standards Agency, UKRI-BBSRC and the Global Food Security Programme, a recent perspective paper, and associated online workshops and surveys in January 2023 have:  

  • Scoped out the direct impacts of weather and climate extremes on the UK food supply chain, 
  • Highlighted areas where weather and climate information could support resilience across time and space scales through decision making and action, 
  • Identified key knowledge gaps, 
  • Made recommendations for future research and funding, and 
  • Scoped out the potential adaptation/policy responses to the direct impacts of weather and climate extremes on the food chain, and the resulting trade-offs and consequences  
The potential for weather and climate information to support decision making in agricultural and food system-related activities, and improved resilience to weather and climate shocks across time and space scales. Grey background boxes represent generalised meteorological capabilities; light blue ellipses with white outlines denote potential applications. © Crown Copyright 2021, Met Office. From Falloon et al. 2022.

However, a major gap remains in understanding the changes needed to rapidly increase the delivery and implementation of climate adaptation in support of resilience in the UK food system. A workshop on this topic was held at the University of Reading’s Henley Business School on 13-14 June 2024 bringing together academics across a wide range of disciplines and presented findings back to industry and government stakeholders for their feedback and prioritisation.  

The workshop aimed to consider key areas for supporting resilience and adaptation to climate change identified by the January 2023 workshop including innovation and trialling novel management and production approaches, social innovation and enabling behavioural shifts, mutual learning, and underpinning evidence gaps. The workshop was supported by a cross-sector survey on adaptation barriers and priorities. 

Overarching themes identified in the workshop included the need for a strategic, system-wide, and long-term approach, underpinned by strong inter- and transdisciplinary collaboration. 

Critical evidence gaps include improving understanding of: 

  • Impacts of international dimensions and trade on UK food ingredient and packaging availability, compared to UK-sourced products – and their interactions
  • Impacts of climate extremes on production and transport and effective adaptation options
  • Impacts of climate shocks on UK livelihood systems, households and consumers
  • Broader adaptation and transformation needed to escape existing ‘doom loops’
  • Application of tech solutions (e.g. GM/gene editing) for climate resilience and adaptation

Other issues raised included thresholds for change, land pressures, substitutability of different foods, impacts of government policy, nutrition, regenerative practices, and interactions with the energy sector. 

Recommended ways forward include: 

  • Tools, models, and methods that consider risks across the food chain and system outcomes
  • A focus on inter- and trans-disciplinary approaches.
  • Increased international collaboration/cooperation, and stronger government-science interactions
  • Enhancing food chain data access, use and integration, and a supportive enabling environment
  • Long-term trials: to provide evidence of impacts of alternative practices
  • Preparing the transport network for climate extremes.
  • A refresh of the National Food Strategy, building on latest science
  • A new funding landscape: long-term, strategic, visionary, systemic, trans- and interdisciplinary, co-designed and coordinated.

Other issues raised included: sharing responsibility and joined-up, transparent approaches across sectors and institutions; risk mitigation tools; use cases and roadmaps; welfare responses; interdisciplinary skills training; and research across a wider range of crops. 

We are aiming to produce a peer-reviewed perspective paper on critical research (and practice) gaps, and recommendations for the way forward.  

———————————–

This blog was written by Professor Pete Falloon from the Cabot Institute for the Environment and Met Office.

A bald headed man smiling with dark rimmed glasses.
Professor Pete Falloon

How glacier algae are challenging the way we think about evolution

Wirestock Creators/Shutterstock

People often underestimate tiny beings. But microscopic algal cells not only evolved to thrive in one of the most extreme habitats on Earth – glaciers – but are also shaping them.

With a team of scientists from the UK and Canada, we traced the evolution of purple algae back hundreds of millions of years and our findings challenge a key idea about how evolution works. Though small, these algae are having a dramatic effect on the glaciers they live on.

Glaciers are among the planet’s fastest changing ecosystems. During the summer melt season as liquid water forms on glaciers, blooms of purple algae darken the surface of the ice, accelerating the rate of melt. This fascinating adaptation to glaciers requires microscopic algae to control their growth and photosynthesis. This must be balanced with tolerance of extreme ice melt, temperature and light exposure.

Our study, published in New Phytologist, reveals how and when their adaptations to live in these extreme environments first evolved. We sequenced and analysed genome data of the glacier algae Ancylonema nordenskiöldii. Our results show that the purple colour of glacier algae, which acts like a sunscreen, was generated by new genes involved in pigment production.

This pigment, purpurogallin, protects algal cells from damage of ultraviolet (UV) and visible light. It is also linked with tolerance of low temperatures and desiccation, characteristic features of glacial environments. Our genetic analysis suggests that the evolution of this purple pigment was probably vital for several adaptations in glacier algae.

We also identified new genes that helped increase the algae’s tolerance to UV and visible light, important adaptations for living in a bright, exposed environment. Interestingly these were linked to increased light perception as well as improved mechanisms of repair to sun damage. This work reveals how algae are adapted to live on glaciers in the present day.

Next, we wanted to understand when this adaptation evolved in Earth’s deep history.

The evolution of glacier algae

Earth has experienced many fluctuations of colder and warmer climates. Across thousands and sometimes millions of years, global climates have changed slowly between glacial (cold) to interglacial (warm) periods.

One of the most dramatic cold periods was the Cryogenian, dating back to 720-635 million years ago, when Earth was almost entirely covered in snow and ice. So widespread were these glaciations, they are sometimes referred to by scientists as “Snowball Earth”.

Scientists think that these conditions would have been similar to the glaciers and ice sheets we see on Earth today. So we wondered could this period be the force driving the evolution of glacier algae?

After analysing genetic data and fossilised algae, we estimated that glacier algae evolved around 520-455 million years ago. This suggests that the evolution of glacier algae was not linked to the Snowball Earth environments of the Cryogenian.

As the origin of glacier algae is later than the Cryogenian, a more recent glacial period must have been the driver of glacial adaptations in algae. Scientists think there has continuously been glacial environments on Earth up to 60 million years ago.

We did, however, identify that the common ancestor of glacier algae and land plants evolved around the Cryogenian.

In February 2024, our previous analysis demonstrated that this ancient algae was multicellular. The group containing glacier algae lost the ability to create complex multicellular forms, possibly in response to the extreme environmental pressures of the Cryogenian.

Rather than becoming more complex, we have demonstrated that these algae became simple and persevered to the present day. This is an example of evolution by reducing complexity. It also contradicts the well-established “march of progress” hypothesis, the idea that organisms evolve into increasingly complex versions of their ancestors.

Our work showed that this loss of multicellularity was accompanied by a huge loss of genetic diversity. These lost genes were mainly linked to multicellular development. This is a signature of the evolution of their simple morphology from a more complex ancestor.

Over the last 700 million years, these algae have survived by being tiny, insulated from cold and protected from the Sun. These adaptations prepared them for life on glaciers in the present day.

So specialised is this adaptation, that only a handful of algae have evolved to live on glaciers. This is in contrast to the hundreds of algal species living on snow. Despite this, glacier algae have dramatic effects across vast ice fields when liquid water forms on glacier surfaces. In 2016, on the Greenland ice sheet, algal growth led to an additional 4,400–6,000 million tonnes of runoff.

Understanding these algae helps us appreciate their role in shaping fragile ecosystems.

Our study gives insight into the evolutionary journey of glacier algae from the deep past to the present. As we face a changing climate, understanding these microscopic organisms is key to predicting the future of Earth’s icy environments.The Conversation

————————–

This blog is written by Dr Alexander Bowles, Postdoctoral research associate, University of Bristol

This article is republished from The Conversation under a Creative Commons license. Read the original article.

Alexander Bowles
Alexander Bowles

East Africa must prepare for more extreme rainfall during the short rainy season – new study

Rainy season in Kenya

East Africa has recently had an unprecedented series of failed rains. But some rainy seasons are bringing the opposite: huge amounts of rainfall.

In the last few months of 2023, the rainy season known as the “short rains” was much wetter than normal. It brought severe flooding to Kenya, Somalia and Tanzania. In Somalia, more than 2 million people were affected, with over 100 killed and 750,000 displaced from their homes. Tens of thousands of people in northern Kenya lost livestock, farmland and homes.

The very wet short rainy seasons are linked to a climate event known as a positive Indian Ocean Dipole (known as the “IOD”). And climate model projections show an increasing trend of extreme Indian Ocean dipoles.

In a new research paper, we set out to investigate what effect more frequent extreme Indian Ocean Dipole events would have on rainfall in east Africa. We did this using a large number of climate simulations and models.

Our results show that they increase the likelihood of very wet days – therefore making very wet seasons.

This could lead to extreme weather events, even more extreme than the floods of 1997, which led to 10 million people requiring emergency assistance, or those of 2019, when hundreds of thousands were displaced.

We recommend that decision-makers plan for this kind of extreme rainfall, and the resulting devastating floods.

How the Indian Ocean Dipole works

Indian Ocean Dipole events tend to occur in the second half of the year, and can last for months. They have two phases: positive and negative.

Positive events occur when the temperature of the sea surface in the western Indian Ocean is warmer than normal and the temperature in the eastern Indian Ocean is cooler than normal. Put simply, this temperature difference happens when winds move warmer water away from the ocean surface in the eastern region, allowing cooler water to rise.

In the warmer western Indian Ocean, more heated air will rise, along with water vapour. This forms clouds, bringing rain. Meanwhile, the eastern part of the Indian Ocean will be cooler and drier. This is why flooding in east Africa can happen at the same time as bushfires in Australia.

The opposite is true for negative dipole events: drier in the western Indian Ocean and wetter in the east.

Under climate change we’re expecting to see more frequent and more extreme positive dipole events – bigger differences between east and west. This is shown by climate model projections. They are believed to be driven by different paces of warming across the tropical Indian Ocean – with western and northern regions projected to warm faster than eastern parts.

Often heavy rain seasons in east Africa are attributed to El Niño, but recent research has shown that the direct impact of El Niño on east African rainfall is actually relatively modest. El Niño’s principal influence lies in its capacity to bring about positive dipole events. This occurs since El Niño events tend to cool the water in the western Pacific Ocean – around Indonesia – which also helps to cool down the water in the eastern Indian Ocean. These cooler temperatures then help kick-start a positive Indian Ocean Dipole.

Examining unprecedented events

Extreme positive Indian Ocean Dipole events are rare in the recent climate record. So to examine their potential impacts on rainfall extremes, we used a large set of climate simulations. The data allowed us to diagnose the sensitivity of rainfall to larger Indian Ocean Dipole events in a statistically robust way.

Our results show that as positive dipole events become more extreme, more wet days during the short rains season can be expected. This effect was found to be largest for the frequency of extremely wet days. Additionally, we found that as the dipole strength increases, the influence on the most extreme days becomes even larger. This means that dipole events which are even slightly “record-breaking” could lead to unprecedented levels of seasonal rainfall.

Ultimately, if positive Indian Ocean Dipole seasons increase in frequency, as predicted, regular seasons of flooding impacts will become a new normal.

One aspect not included in our analysis is the influence of a warmer atmosphere on rainfall extremes. A warmer atmosphere holds more moisture, allowing for the development of more intense rain storms. This effect could combine with the influence of extreme positive dipoles to bring unprecedented levels of rainfall to the Horn of Africa.

2023 was a year of record-breaking temperatures driven both by El Niño and global warming. We might expect that this warmer air could have intensified rain storms during the season. Indeed, evidence from a recent assessment suggests that climate change-driven warming is highly likely responsible for increased rainfall totals.

Responding to an unprecedented future

Policymakers need to plan for this.

In the long term it is crucial to ensure that any new infrastructure is robust to withstand more frequent and heavier rains, and that government, development and humanitarian actors have the capacity to respond to the challenges.

Better use of technology, such as innovations in disseminating satellite rainfall monitoring via mobile phones, can communicate immediate risk. New frontiers in AI-based weather prediction could improve the ability to anticipate localised rain storms, including initiatives focusing on eastern Africa specifically.

Linking rainfall information with hydrological models designed for dryland environments is also essential. These will help to translate weather forecasts into impact forecasts, such as identifying risks of flash flooding down normally dry channels or bank overflow of key rivers in drylands.

These technological improvements are crucial. But better use of the forecast information we already have can also make a big difference. For instance, initiatives like “forecast-based financing”, pioneered by the Red Cross Red Crescent movement, link forecast triggers to pre-approved financing and predefined action plans, helping communities protect themselves before hazards have even started.

For these endeavours to succeed, there must be dialogue between the science and practitioner communities. The scientific community can work with practitioners to integrate key insights into decisions, while practitioners can help to ensure research efforts target critical needs. With this, we can effectively build resilience to natural hazards and resist the increasing risks of our changing climate.The Conversation

———————————

This blog is written by David MacLeod, Lecturer in Climate Risk, Cardiff University; Erik W. Kolstad, Research professor, Uni Research; Cabot Institute for the Environment member Katerina Michaelides, Professor of Dryland Hydrology, School of Geographical Sciences, University of Bristol, and Michael Singer, Professor of Hydrology and Geomorphology, Cardiff University. This article is republished from The Conversation under a Creative Commons license. Read the original article.

Dune: what the climate of Arrakis can tell us about the hunt for habitable exoplanets

Frank Herbert’s Dune is epic sci-fi storytelling with an environmental message at its heart. The novels and movies are set on the desert planet of Arrakis, which various characters dream of transforming into a greener world – much like some envision for Mars today.

We investigated Arrakis using a climate model, a computer program similar to those used to give weather forecasts. We found the world that Herbert had created, well before climate models even existed, was remarkably accurate – and would be habitable, if not hospitable.

However, Arrakis wasn’t always a desert. In Dune lore, 91% of the planet was once covered by oceans, until some ancient catastrophe led to its desertification. What water remained was further removed by sand trout, an invasive species brought to Arrakis. These proliferated and carried liquid into cavities deep underground, leading to the planet becoming more and more arid.

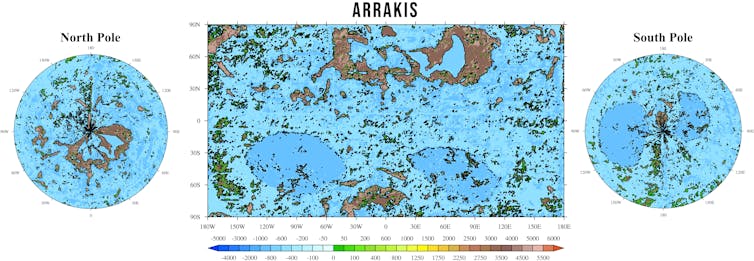
To see what a large ocean would mean for the planet’s climate and habitability, we have now used the same climate model – putting in an ocean while changing no other factors.

When most of Arrakis is flooded, we calculate that the global average temperature would be reduced by 4°C. This is mostly because oceans add moisture to the atmosphere, which leads to more snow and certain types of cloud, both of which reflect the sun’s energy back into space. But it’s also because oceans on Earth and (we assume) on Arrakis emit “halogens” that cool the planet by depleting ozone, a potent greenhouse gas which Arrakis would have significantly more of than Earth.

Map of Arrakis
The authors gathered information from the books and the Dune Encyclopedia to build their original model. Then they added an ocean with 1,000 metres average depth.
Farnsworth et al, CC BY-SA

Unsurprisingly, the ocean world is a whopping 86 times wetter, as so much water evaporates from the oceans. This means plants can grow as water is no longer a finite resource, as it is on desert Arrakis.

A wetter world would be more stable

Oceans also reduce temperature extremes, as water heats and cools more slowly than land. (This is one reason Britain, surrounded by oceans, has relatively mild winters and summers, while places far inland tend to be hotter in summer and very cold in winter). The climate of an ocean planet is therefore more stable than a desert world.

In desert Arrakis, temperatures would reach 70°C or more, while in its ocean state, we put the highest recorded temperatures at about 45°C. That means the ocean Arrakis would be liveable even in summer. Forests and arable crops could grow outside of the (still cold and snowy) poles.

There is one downside, however. Tropical regions would be buffeted by large cyclones since the huge, warm oceans would contain lots of the energy and moisture required to drive hurricanes.

The search for habitable planets

All this isn’t an entirely abstract exercise, as scientists searching for habitable “exoplanets” in distant galaxies are looking for these sorts of things too. At the moment, we can only detect such planets using huge telescopes in space to search for those that are similar to Earth in size, temperature, available energy, ability to host water, and other factors.

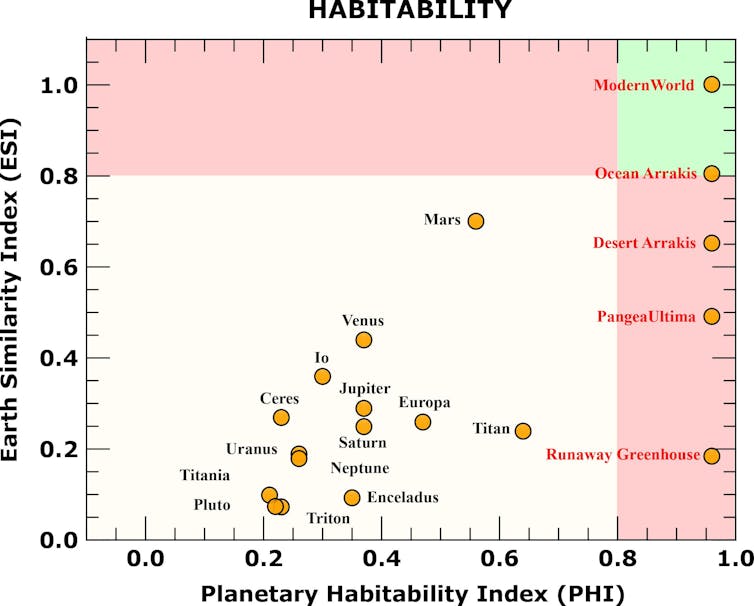
Scatter chart of planets comparing habitability and similarity to Earth.
Both desert and ocean Arrakis are considerably more habitable than any other planet we have discovered.
Farnsworth et al, CC BY-SA

We know that desert worlds are probably more common than Earth-like planets in the universe. Planets with potentially life-sustaining oceans will usually be found in the so-called “Goldilocks zone”: far enough from the Sun to avoid being too hot (so further away than boiling hot Venus), but close enough to avoid everything being frozen (so nearer than Jupiter’s icy moon Ganymede).

Research has found this habitable zone is particularly small for planets with large oceans. Their water is at risk of either completely freezing, therefore making the planet even colder, or of evaporating as part of a runaway greenhouse effect in which a layer of water vapour prevents heat from escaping and the planet gets hotter and hotter.

The habitable zone is therefore much larger for desert planets, since at the outer edge they will have less snow and ice cover and will absorb more of their sun’s heat, while at the inner edge there is less water vapour and so less risk of a runaway greenhouse effect.

It’s also important to note that, though distance from their local star can give a general average temperature for a planet, such an average can be misleading. For instance, both desert and ocean Arrakis have a habitable average temperature, but the day-to-day temperature extremes on the ocean planet are much more hospitable.

Currently, even the most powerful telescopes cannot sense temperatures at this detail. They also cannot see in detail how the continents are arranged on distant planets. This again could mean the averages are misleading. For instance, while the ocean Arrakis we modelled would be very habitable, most of the land is in the polar regions which are under snow year-round – so the actual amount of inhabitable land is much less.

Such considerations could be important in our own far-future, when the Earth is projected to form a supercontinent centred on the equator. That continent would make the planet far too hot for mammals and other life to survive, potentially leading to mass extinction.

If the most likely liveable planets in the universe are deserts, they may well be very extreme environments that require significant technological solutions and resources to enable life – desert worlds will probably not have an oxygen-rich atmosphere, for instance.

But that won’t stop humans from trying. For instance, Elon Musk and SpaceX have grand ambitions to create a colony on our closest desert world, Mars. But the many challenges they will face only emphasises how important our own Earth is as the cradle of civilisation – especially as ocean-rich worlds may not be as plentiful as we’d hope. If humans eventually colonise other worlds, they’re likely to have to deal with many of the same problems as the characters in Dune.The Conversation

————————

This blog is written by Cabot Institute for the Environment members Dr Alex Farnsworth, Senior Research Associate in Meteorology, and Sebastian Steinig, Research Associate in Paleoclimate Modelling, University of Bristol; and Michael Farnsworth, Research Lead Future Electrical Machines Manufacturing Hub, University of Sheffield. This article is republished from The Conversation under a Creative Commons license. Read the original article.

Climate summits are too big and key voices are being crowded out – here’s a better solution

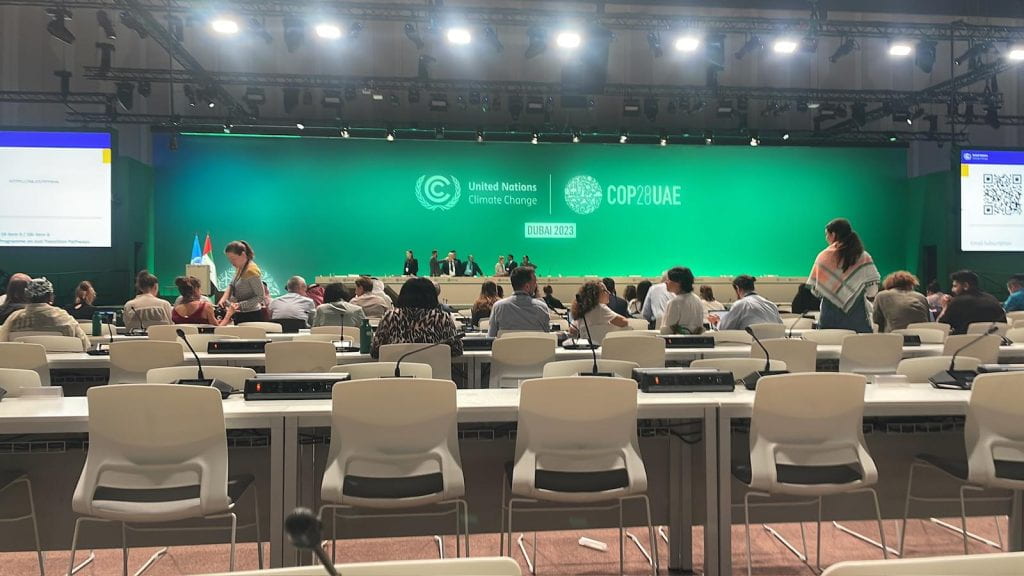
Conference room at COP28

Every year, the official UN climate summits are getting bigger. In 2021 at COP26 in Glasgow there were around 40,000 participants, COP27 in 2022 in Sharm el-Sheikh had 50,000.

But this year blew all previous records out of the water. More than 97,000 participants had badges to attend COP28 in Dubai in person. This raises questions about who is attending COPs and what they are doing there, who gets their voices heard and, on a more practical note, how this affects the negotiations.

For those not familiar with the COP setup, there are two “worlds” that exist side by side. One is the negotiations, which are run under the UN’s climate change body the UNFCCC, and the other is a very long list of talks and social events. These take place in pavilion exhibition spaces and are open to anyone attending, in contrast to the negotiations which are often closed to the media and sometimes closed to observers.

There is a stark difference between these worlds, with pavilion spaces featuring elaborate and inviting settings, particularly if they are well funded, while negotiations often happen in windowless rooms.

A growing sense exists among those invested in the “traditional” side of the COPs that many delegates have no intention of observing the climate talks themselves, and instead spend their time networking in the pavilions.

Indigenous people visiting COP28 from Brazilian Amazon.

In terms of who attends, at COP28 there were around 25,000 “party” (country) delegates, 27,000 “party overflow” delegates (usually guests, sponsors, or advisors), 900 UNFCCC secretariat members (who run the COPs), 600 “UN overflow”, and 1,350 from “specialised agencies” such as the World Health Organization or World Bank and their overflows. That makes up just under 55,000 or half of the attendees.

The rest are intergovernmental organisations (2,000), UN Global Climate Action award winners (600), host country guests (5,000), temporary passes (500 – many issued to big private companies), NGOs (14,000 – including one of us, as part of a university delegation), and media (4,000). This is according to the UNFCCC, which places the number of attendees closer to 80,000.

The “party overflow” badges are particularly concerning. The number of delegates connected to the oil and gas industries has quadrupled from last year to around 2,400, many of whom were invited as part of country delegations. As another example, meat industry representatives became part of Brazil’s delegation, while dairy associations organised official COP side events. In the official programme, the Energy and Industry, Just Transition, and Indigenous Peoples Day featured more events by industrial giant Siemens than by indigenous people.

Practically speaking, huge numbers cause problems – this year for example there were delayed meetings, long queues, and several negotiation rooms were beyond capacity with observers and even party delegates asked to limit their numbers and leave.

Even with access to an observer badge, there is little one can contribute to negotiations. The negotiating positions are decided long before the COPs begin, and observers are rarely permitted to speak in negotiations. In addition, a lot of the negotiations are either conducted behind closed doors (called “informal-informals” with no access for the UN or observers) or even in the corridors, where negotiators meet informally to cement positions. The negotiations you can (silently) observe are usually a series of prepared statements, rather than a discussion.

So if COPs are too big and bloated, what is the alternative?

Smaller and more online

One alternative is being a virtual delegate, which one of us tried. This year’s COP trialled live streams and recordings of some of the negotiations, side events and press conferences on an official UNFCCC virtual platform for the first time. The option is a long overdue, but welcome addition. It reduces travel emissions and makes it more accessible, for instance for people with caring responsibilities and others who are unable to travel (or perhaps who refuse to fly).

Some technical teething problems are to be expected. Yet when we queried why the virtual platform didn’t livestream many of the sessions, the COP28 support team pointed us to the official COP28 app. Our employer, the University of Bristol, had advised us not to download the app because of security concerns, which again raises serious issues around transparency and accountability in UNFCCC spaces, as well as freedom of speech and assembly in COP host countries.

Not being there in person also has downsides. As a virtual observer, it’s harder to judge the atmosphere in a negotiation room, to stumble upon and observe spontaneous negotiations happening in corridors, or participate in or observe protests. While indigenous voices were rarely heard in the livestreamed negotiations and events, the Indigenous People’s Pavilion offered a chance to hear them – but only if you were in Dubai. The virtual alternative is a good option to observe negotiations, but it means missing out on some of the civil society lifeblood of COP.

Another option is to limit access to COPs – for example, limiting the in-person negotiations only to the most vital participants. Party tickets could be limited, with lobbyists from fossil fuel industries tightly controlled and priority given to climate victims, indigenous communities and underrepresented countries. Side events and pavilions could take place a few months before the COPs, increasing the chances of influencing negotiations, since positions are cemented early. There is no reason these only need to happen in one place once a year, there could be regional meetups in between, allowing for formal contact more often.

These issues of access, transparency and influence have serious implications on negotiation outcomes and climate action. After undergoing various draft iterations that offered options ranging from “no text” to “phasing out” or “down” fossil fuels, this year’s final agreement does not include a commitment to phasing out. This watered-down agreement reflects the inability of indigenous peoples and the most climate vulnerable countries to meaningfully participate in the negotiations – future COPs must trim down to make their voices heard.


This blog is written by Cabot Institute for the Environment members, Drs Alix Dietzel, Senior Lecturer in Climate Justice, University of Bristol and Katharina Richter, Lecturer in Climate Change, Politics and Society, University of Bristol.

This article is republished from The Conversation under a Creative Commons license. Read the original article.

Katharina Richter
Dr Katharina Richter
Dr Alix Dietzel
Dr Alix Dietzel

Are you a journalist looking for climate experts for COP28? We’ve got you covered

COP28 logo

We’ve got lots of media trained climate change experts. If you need an expert for an interview, here is a list of our experts you can approach. All media enquiries should be made via Victoria Tagg, our dedicated Media and PR Manager at the University of Bristol. 

Email victoria.tagg@bristol.ac.uk or call +44 (0)117 428 2489.

Climate change / climate emergency / climate science / climate-induced disasters

Dr Eunice Lo – expert in changes in extreme weather events such as heatwaves and cold spells, and how these changes translate to negative health outcomes including illnesses and deaths. Follow on Twitter/X @EuniceLoClimate.

Professor Daniela Schmidt – expert in the causes and effects of climate change on marine systems. Dani is also a Lead Author on the IPCC reports.

Dr Katerina Michalides – expert in drylands, drought and desertification and helping East African rural communities to adapt to droughts and future climate change. Follow on Twitter/X @_kmichaelides.

Professor Dann Mitchell – expert in how climate change alters the atmospheric circulation, extreme events, and impacts on human health. Dann is also a Met Office Chair. Follow on Twitter/X @ClimateDann.

Professor Dan Lunt – expert on past climate change, with a focus on understanding how and why climate has changed in the past and what we can learn about the future from the past. Dan is also a Lead Author on IPCC AR6. Follow on Twitter/X @ClimateSamwell.

Professor Jonathan Bamber – expert on the impact of melting land ice on sea level rise (SLR) and the response of the ocean to changes in freshwater forcing. Follow on Twitter/X @jlbamber

Professor Paul Bates CBE – expert in the science of flooding, risk and reducing threats to life and economic losses worldwide. Follow on Twitter/X @paul_d_bates

Dr Matt Palmer – expert in sea level and ocean heat content at the Met Office Hadley Centre and University of Bristol. Follow on Twitter/X @mpclimate.

Professor Guy Howard – expertise in building resilience and supporting adaptation in water systems, sanitation, health care facilities, and housing. Expert in wider infrastructure resilience assessment.

Net Zero / Energy / Renewables

Dr Caitlin Robinson – expert on energy poverty and energy justice and also in mapping ambient vulnerabilities in UK cities. Caitlin will be virtually attending COP28. Follow on Twitter/X @CaitHRobin.

Professor Philip Taylor – Expert in net zero, energy systems, energy storage, utilities, electric power distribution. Also Pro-Vice Chancellor at the University of Bristol. Follow on Twitter/X @rolyatlihp.

Dr Colin Nolden – expert in sustainable energy policyregulation and business models and interactions with secondary markets such as carbon markets and other sectors such as mobility. Colin will be in attendance in the Blue Zone at COP28 during week 2.

Professor Charl Faul – expert in novel functional materials for sustainable energy applications e.g. in CO2 capture and conversion and energy storage devices.  Follow on Twitter/X @Charl_FJ_Faul.

Climate finance / Loss and damage

Dr Rachel James – Expert in climate finance, damage, loss and decision making. Also has expertise in African climate systems and contemporary and future climate change. Follow on Twitter/X @_RachelJames.

Dr Katharina Richter – expert in decolonial environmental politics and equitable development in times of climate crises. Also an expert on degrowth and Buen Vivir, two alternatives to growth-based development from the Global North and South. Katarina will be virtually attending COP28. @DrKatRichter.

Climate justice

Dr Alix Dietzel – climate justice and climate policy expert. Focusing on the global and local scale and interested in how just the response to climate change is and how we can ensure a just transition. Alix will be in attendance in the Blue Zone at COP28 during week 1. Follow on Twitter/X @alixdietzel.

Dr Ed Atkins – expert on environmental and energy policy, politics and governance and how they must be equitable and inclusive. Also interested in local politics of climate change policies and energy generation and consumption. Follow on Twitter/X @edatkins_.

Dr Karen Tucker – expert on colonial politics of knowledge that shape encounters with indigenous knowledges, bodies and natures, and the decolonial practices that can reveal and remake them. Karen will be in attending the Blue Zone of COP28 in week 2.

Climate change and health

Dr Dan O’Hare – expert in climate anxiety and educational psychologist. Follow on Twitter/X @edpsydan.

Professor Dann Mitchell – expert in how climate change alters the atmospheric circulation, extreme events, and impacts on human health. Dann is also a Met Office Chair. Follow on Twitter/X @ClimateDann.

Dr Eunice Lo – expert in changes in extreme weather events such as heatwaves and cold spells, and how these changes translate to negative health outcomes including illnesses and deaths. Follow on Twitter/X @EuniceLoClimate.

Professor Guy Howard – expert in influence of climate change on infectious water-related disease, including waterborne disease and vector-borne disease.

Professor Rachael Gooberman-Hill – expert in health research, including long-term health conditions and design of ways to support and improve health. @EBIBristol (this account is only monitored in office hours).

Youth, children, education and skills

Dr Dan O’Hare – expert in climate anxiety in children and educational psychologist. Follow on Twitter/X @edpsydan.

Dr Camilla Morelli – expert in how children and young people imagine the future, asking what are the key challenges they face towards the adulthoods they desire and implementing impact strategies to make these desires attainable. Follow on Twitter/X @DrCamiMorelli.

Dr Helen Thomas-Hughes – expert in engaging, empowering, and inspiring diverse student bodies as collaborative environmental change makers. Also Lead of the Cabot Institute’s MScR in Global Environmental Challenges. Follow on Twitter/X @Researchhelen.

Professor Daniela Schmidt – expert in the causes and effects of climate change on marine systems. Dani is also a Lead Author on the IPCC reports. Also part of the Waves of Change project with Dr Camilla Morelli, looking at the intersection of social, economic and climatic impacts on young people’s lives and futures around the world.

Climate activism / Extinction Rebellion

Dr Oscar Berglund – expert on climate change activism and particularly Extinction Rebellion (XR) and the use of civil disobedience. Follow on Twitter @berglund_oscar.

Land / Nature / Food

Dr Jo House – expert on land and climate interactions, including emissions of carbon dioxide from land use change (e.g. deforestation), climate mitigation potential from the land (e.g. afforestationbioenergy), and implications of science for policy. Previously Government Office for Science’s Head of Climate Advice. Follow on Twitter @Drjohouse.

Professor Steve Simpson – expert marine biology and fish ecology, with particular interests in the behaviour of coral reef fishes, bioacoustics, effects of climate change on marine ecosystems, conservation and management. Follow on Twitter/X @DrSteveSimpson.

Dr Taro Takahashi – expert on farminglivestock production systems as well as programme evaluation and general equilibrium modelling of pasture and livestock-based economies.

Dr Maria Paula Escobar-Tello – expert on tensions and intersections between livestock farming and the environment.

Air pollution / Greenhouse gases

Dr Aoife Grant – expert in greenhouse gases and methane. Set up a monitoring station at Glasgow for COP26 to record emissions.

Professor Matt Rigby – expert on sources and sinks of greenhouse gases and ozone depleting substances. Follow on Twitter @TheOtherMRigby.

Professor Guy Howard – expert in contribution of waste and wastewater systems to methane emissions in low- and middle-income countries

Plastic and the environment

Dr Charlotte Lloyd – expert on the fate of chemicals in the terrestrial environment, including plasticsbioplastics and agricultural wastes. Follow on Twitter @DrCharlLloyd.

Cabot Institute for the Environment at COP28

We will have three media trained academics in attendance at the Blue Zone at COP28. These are: Dr Alix Dietzel (week 1), Dr Colin Nolden (week 2) and Dr Karen Tucker (week 2). We will also have two academics attending virtually: Dr Caitlin Robinson and Dr Katharina Richter.

Read more about COP on our website at https://bristol.ac.uk/cabot/what-we-do/projects/cop/
——————————
This blog was written by Amanda Woodman-Hardy, Communications and Engagement Officer at the Cabot Institute for the Environment. Follow on Twitter @Enviro_Mand and @cabotinstitute.

Watch our Cabot Conversations – 10 conversations between 2 experts on a climate change issue, all whilst an artist listens in the background and interprets the conversation into a beautiful piece of art in real time. Find out more at bristol.ac.uk/cabot/conversations.

Arctic Ocean could be ice-free in summer by 2030s, say scientists – this would have global, damaging and dangerous consequences

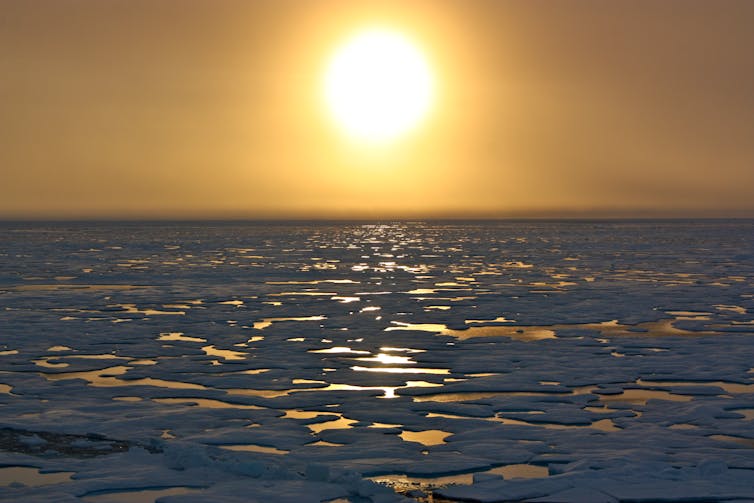
Ice in the Chukchi Sea, north of Alaska and Siberia.
NASA Goddard Space Flight Center

The Arctic Ocean could be ice-free in summer by the 2030s, even if we do a good job of reducing emissions between now and then. That’s the worrying conclusion of a new study in Nature Communications.

Predictions of an ice-free Arctic Ocean have a long and complicated history, and the 2030s is sooner than most scientists had thought possible (though it is later than some had wrongly forecast). What we know for sure is the disappearance of sea ice at the top of the world would not only be an emblematic sign of climate breakdown, but it would have global, damaging and dangerous consequences.

The Arctic has been experiencing climate heating faster than any other part of the planet. As it is at the frontline of climate change, the eyes of many scientists and local indigenous people have been on the sea ice that covers much of the Arctic Ocean in winter. This thin film of frozen seawater expands and contracts with the seasons, reaching a minimum area in September each year.

Animation of Arctic sea ice from space
Arctic sea ice grows until March and then shrinks until September.
NASA

The ice which remains at the end of summer is called multiyear sea ice and is considerably thicker than its seasonal counterpart. It acts as barrier to the transfer of both moisture and heat between the ocean and atmosphere. Over the past 40 years this multiyear sea ice has shrunk from around 7 million sq km to 4 million. That is a loss equivalent to roughly the size of India or 12 UKs. In other words, it’s a big signal, one of the most stark and dramatic signs of fundamental change to the climate system anywhere in the world.

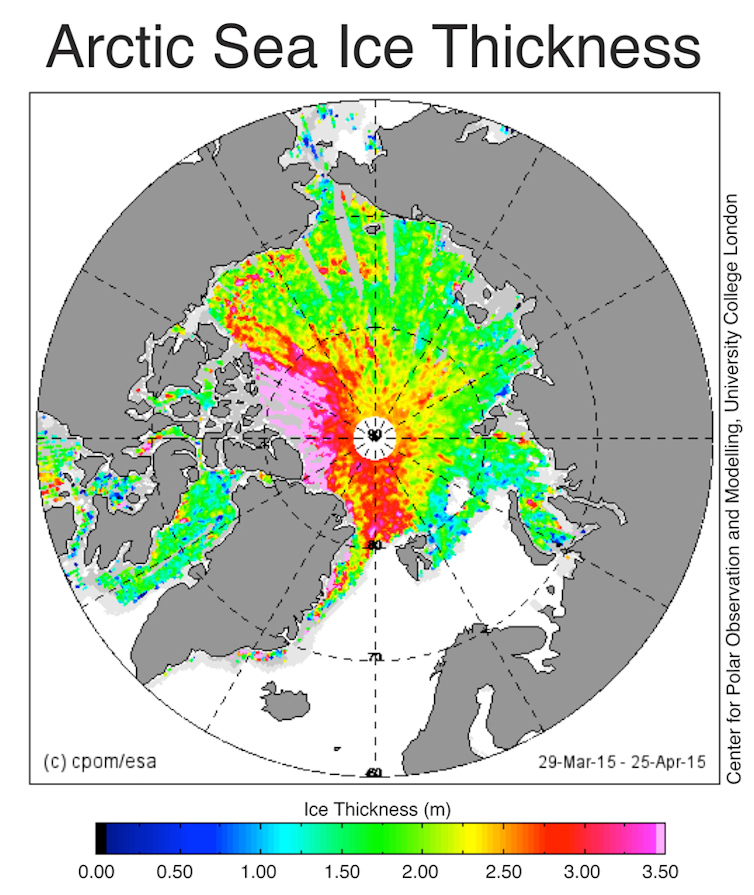
As a consequence, there has been considerable effort invested in determining when the Arctic Ocean might first become ice-free in summer, sometimes called a “blue ocean event” and defined as when the sea ice area drops below 1 million sq kms. This threshold is used mainly because older, thicker ice along parts of Canada and northern Greenland is expected to remain long after the rest of the Arctic Ocean is ice-free. We can’t put an exact date on the last blue ocean event, but one in the near future would likely mean open water at the North Pole for the first time in thousands of years.

Annotated map of Arctic
The thickest ice (highlighted in pink) is likely to remain even if the North Pole is ice-free.
NERC Center for Polar Observation and Modelling, CC BY-SA

One problem with predicting when this might occur is that sea ice is notoriously difficult to model because it is influenced by both atmospheric and oceanic circulation as well as the flow of heat between these two parts of the climate system. That means that the climate models – powerful computer programs used to simulate the environment – need to get all of these components right to be able to accurately predict changes in sea ice extent.

Melting faster than models predicted

Back in the 2000s, an assessment of early generations of climate models found they generally underpredicted the loss of sea ice when compared to satellite data showing what actually happened. The models predicted a loss of about 2.5% per decade, while the observations were closer to 8%.

The next generation of models did better but were still not matching observations which, at that time were suggesting a blue ocean event would happen by mid-century. Indeed, the latest IPCC climate science report, published in 2021, reaches a similar conclusion about the timing of an ice-free Arctic Ocean.

As a consequence of the problems with the climate models, some scientists have attempted to extrapolate the observational record resulting in the controversial and, ultimately, incorrect assertion that this would happen during the mid 2010s. This did not help the credibility of the scientific community and its ability to make reliable projections.

Ice-free by 2030?

The scientists behind the latest study have taken a different approach by, in effect, calibrating the models with the observations and then using this calibrated solution to project sea ice decline. This makes a lot of sense, because it reduces the effect of small biases in the climate models that can in turn bias the sea ice projections. They call these “observationally constrained” projections and find that the Arctic could become ice-free in summer as early as 2030, even if we do a good job of reducing emissions between now and then.

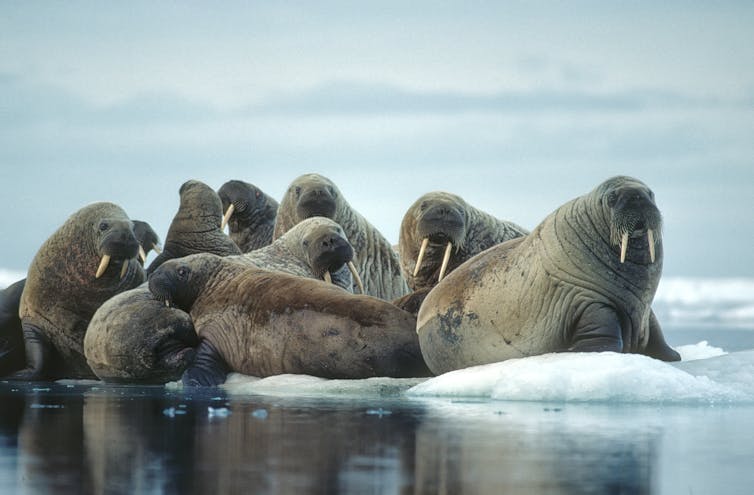
Walruses on ice floe
Walruses depend on sea ice. As it melts, they’re being forced onto land.
outdoorsman / shutterstock

There is still plenty of uncertainty around the exact date – about 20 years or so – because of natural chaotic fluctuations in the climate system. But compared to previous research, the new study still brings forward the most likely timing of a blue ocean event by about a decade.

Why this matters

You might be asking the question: so what? Other than some polar bears not being able to hunt in the same way, why does it matter? Perhaps there are even benefits as the previous US secretary of state, Mike Pompeo, once declared – it means ships from Asia can potentially save around 3,000 miles of journey to European ports in summer at least.

But Arctic sea ice is an important component of the climate system. As it dramatically reduces the amount of sunlight absorbed by the ocean, removing this ice is predicted to further accelerate warming, through a process known as a positive feedback. This, in turn, will make the Greenland ice sheet melt faster, which is already a major contributor to sea level rise.

The loss of sea ice in summer would also mean changes in atmospheric circulation and storm tracks, and fundamental shifts in ocean biological activity. These are just some of the highly undesirable consequences and it is fair to say that the disadvantages will far outweigh the slender benefits.


This blog is written by Cabot Institute for the Environment member Jonathan Bamber, Professor of Physical Geography, University of Bristol. This article is republished from The Conversation under a Creative Commons license. Read the original article.

Jonathan Bamber
Jonathan Bamber

Intense downpours in the UK will increase due to climate change – new study

A flash flood in London in October 2019.
D MacDonald/Shutterstock

Elizabeth Kendon, University of Bristol

In July 2021, Kew in London experienced a month’s rain in just three hours. Across the city, tube lines were suspended and stations closed as London experienced its wettest day in decades and flash floods broke out. Just under two weeks later, it happened again: intense downpours led to widespread disruption, including the flooding of two London hospitals.

Colleagues and I have created a new set of 100-year climate projections to more accurately assess the likelihood of heavy rain downpours like these over the coming years and decades. The short answer is climate change means these extreme downpours will happen more often in the UK – and be even more intense.

To generate these projections, we used the Met Office operational weather forecast model, but run on long climate timescales. This provided very detailed climate projections – for every 2.2km grid box over the UK, for every hour, for 100 years from 1981 to 2080. These are much more detailed than traditional climate projections and needed to be run as a series of 20-year simulations that were then stitched together. Even on the Met Office supercomputer, these still took about six months to run.

We ran 12 such 100-year projections. We are not interested in the weather on a given day but rather how the occurrence of local weather extremes varies year by year. By starting the model runs in the past, it is also possible to verify the output against observations to assess the model’s performance.

At this level of detail – the “k-scale” – it is possible to more accurately assess how the most extreme downpours will change. This is because k-scale simulations better represent the small-scale atmospheric processes, such as convection, that can lead to destructive flash flooding.

The fire service attending to a vehicle stuck in floodwater.
Flash flooding can be destructive.
Ceri Breeze/Shutterstock

More emissions, more rain

Our results are now published in Nature Communications. We found that under a high emissions scenario downpours in the UK exceeding 20mm per hour could be four times as frequent by the year 2080 compared with the 1980s. This level of rainfall can potentially produce serious damage through flash flooding, with thresholds like 20mm/hr used by planners to estimate the risk of flooding when water overwhelms the usual drainage channels. Previous less detailed climate models project a much lower increase of around two and a half times over the same period.

We note that these changes are assuming that greenhouse gas emissions continue to rise at current rates. This is therefore a plausible but upper estimate. If global carbon emissions follow a lower emissions scenario, extreme rain will still increase in the UK – though at a slower rate. However, the changes are not inevitable, and if we emit less carbon in the coming decades, extreme downpours will be less frequent.

The increases are significantly greater in certain regions. For example, extreme rainfall in north-west Scotland could be almost ten times more common, while it’s closer to three times more frequent in the south of the UK. The greater future increases in the number of extreme rainfall events in the higher resolution model compared with more traditional lower resolution climate models shows the importance of having k-scale projections to enable society to adapt to climate change.

As the atmosphere warms, it can hold more moisture, at a rate of 7% more moisture for every degree of warming. On a simple level, this explains why in many regions of the world projections show an increase in precipitation as a consequence of human-induced climate change. This new study has shown that, in the UK, the intensity of downpours could increase by about 5% in the south and up to about 15% in the north for every degree of regional warming.

Group of girls with an umbrella walking through a city.
The projected increase in the intensity of rainfall is significantly greater in certain regions.
NotarYES/Shutterstock

However, it is far from a simple picture of more extreme events, decade by decade, as a steadily increasing trend. Instead, we expect periods of rapid change – with records being broken, some by a considerable margin – and periods when there is a pause, with no new records set.

This is simply a reflection of the complex interplay between natural variability and the underlying climate change signal. An analogy for this is waves coming up a beach on an incoming tide. The tide is the long-term rising trend, but there are periods when there are larger waves, followed by lulls.

Despite the underlying trend, the time between record-breaking events at the local scale can be surprisingly long – even several decades.

Our research marks the first time that such a high-resolution data set has spanned over a century. As well as being a valuable asset for planners and policymakers to prepare for the future, it can also be used by climate attribution scientists to examine current extreme rainfall events to see how much more likely they will have been because of human greenhouse gas emissions. The research highlights the importance of meeting carbon emissions targets and also planning for increasingly prevalent extreme rainfall events, which to varying degrees of intensity, look highly likely in all greenhouse gas emissions scenarios.

The tendency for extreme years to cluster poses challenges for communities trying to adapt to intense downpours and risks infrastructure being unprepared, since climate information based on several decades of past observations may not be representative of the following decades.


This blog is written by Cabot Institute for the Environment member Elizabeth Kendon, Professor of Climate Science, University of Bristol. This article is republished from The Conversation under a Creative Commons license. Read the original article.

Lizzie Kendon
Professor Lizzie Kendon

Towards urban climate resilience: learning from Lusaka


“This is a long shot!”

These were the words used by Richard Jones (Science Fellow, Met Office) in August 2021 when he asked if I would consider leading a NERC proposal for a rapid six-month collaborative international research and scoping project, aligned to the COP26 Adaptation and Resilience theme. The deadline was incredibly tight but the opportunity was too good to pass up – we set to work!

Background to Lusaka and FRACTAL

Zambia’s capital city, Lusaka, is one of Africa’s fastest growing cities, with around 100,000 people in the early 1960s to more than 3 million people today. 70% of residents live in informal settlements and some areas are highly prone to flooding due to the low topography and highly permeable limestone sitting on impermeable bedrock, which gets easily saturated. When coupled with poor drainage and ineffective waste management, heavy rainfall events during the wet season (November to March) can lead to severe localised flooding impacting communities and creating serious health risks, such as cholera outbreaks. Evidence from climate change studies shows that heavy rainfall events are, in general, projected to increase in intensity over the coming decades (IPCC AR6, Libanda and Ngonga 2018). Addressing flood resilience in Lusaka is therefore a priority for communities and city authorities, and it became the focus of our proposal.

Lusaka was a focal city in the Future Resilience for African CiTies and Lands (FRACTAL) project funded jointly by NERC and DFID from 2015 to 2021. Led by the Climate System Analysis Group (CSAG) at the University of Cape Town, FRACTAL helped to improve scientific knowledge about regional climate in southern Africa and advance innovative engagement processes amongst researchers, practitioners, decision-makers and communities, to enhance the resilience of southern African cities in a changing climate. I was lucky enough to contribute to FRACTAL, exploring new approaches to climate data analysis (Daron et al., 2019) and climate risk communication (Jack et al., 2020), as well as taking part in engagements in Maputo, Mozambique – another focal city. At the end of FRACTAL there was a strong desire amongst partners to sustain relationships and continue collaborative research.

I joined the University of Bristol in April 2021 with a joint position through the Met Office Academic Partnership (MOAP). Motivated by the potential to grow my network, work across disciplines, and engage with experts at Bristol in climate impacts and risk research, I was excited about the opportunities ahead. So when Richard alerted me to the NERC call, it felt like an amazing opportunity to continue the work of FRACTAL and bring colleagues at the University of Bristol into the “FRACTAL family” – an affectionate term we use for the research team, which really has become a family from many years of working together.

Advancing understanding of flood risk through participatory processes

Working closely with colleagues at Bristol, University of Zambia, University of Cape Town, Stockholm Environment Institute (SEI – Oxford), Red Cross Climate Centre, and the Met Office, we honed a concept building on an idea from Chris Jack at CSAG to take a “deep dive” into the issues of flooding in Lusaka – an issue only partly explored in FRACTAL. Having already established effective relationships amongst those involved, and with high levels of trust and buy-in from key institutions in Lusaka (e.g., Lusaka City Council, Lusaka Water Security Initiative – LuWSI), it was far easier to work together and co-design the project; indeed the project conceived wouldn’t have been possible if starting from scratch. Our aim was to advance understanding of flood risk and solutions from different perspectives, and co-explore climate resilient development pathways that address the complex issue of flood risk in Lusaka, particularly in George and Kanyama compounds (informal settlements). The proposal centred on the use of participatory processes that enable different communities (researchers, local residents, city decision makers) to share and interrogate different types of knowledge, from scientific model datasets to lived experiences of flooding in vulnerable communities.

The proposal was well received and the FRACTAL-PLUS project started in October 2021, shortly before COP26; PLUS conveys how the project built upon FRACTAL but also stands for “Participatory climate information distillation for urban flood resilience in LUSaka”. The central concept of climate information distillation refers to the process of extracting meaning from multiple sources of information, through careful and open consideration of the assumptions, strengths and limitations in constructing the information.

The “Learning Lab” approach

Following an initial evidence gathering and dialogue phase at the end of 2021, we conducted two collaborative “Learning Labs” held in Lusaka in January and March 2022. Due to Covid-19, the first Learning Lab was held as a hybrid event on 26-27 January 2022. It was facilitated by the University of Zambia team with 20 in-person attendees including city stakeholders, the local project team and Richard Jones who was able to travel at short notice. The remainder of the project team joined via Zoom. Using interactive exercises, games (a great way to promote trust and exchange of ideas), presentations, and discussions on key challenges, the Lab helped unite participants to work together. I was amazed at the way participants threw themselves into the activities with such enthusiasm – in my experience, this kind of thing never happens when first engaging with people from different institutions and backgrounds. Yet because trust and relationships were already established, there was no apparent barrier to the engagement and dialogue. The Lab helped to further articulate the complexities of addressing flood risks in the city, and showed that past efforts – including expensive infrastructure investments – had done little to reduce the risks faced by many residents.

One of the highlights of the Labs, and the project overall, was the involvement of cartoon artist Bethuel Mangena, who developed a number of cartoons to support the process and extract meaning (in effect, distilling) the complicated and sensitive issues being discussed. The cartoon below was used to illustrate the purpose of the Lab, as a meeting place for ideas and conversations drawing on different sources of information (e.g., climate data, city plans and policies) and experiences of people from flood-affected communities. All of the cartoons generated in the project, including the feature image for this blog, are available in a Flickr cartoon gallery – well worth a look!

Image: Cartoon highlighting role of Learning Labs in FRACTAL-PLUS by Bethuel Mangena

Integrating scientific and experiential knowledge of flood risk

In addition to the Labs, desk-based work was completed to support the aims of the project. This included work by colleagues in Geographical Sciences at Bristol, Tom O’Shea and Jeff Neal, to generate high-resolution flood maps for Lusaka based on historic rainfall information and for future climate scenarios. In addition, Mary Zhang, now at the University of Oxford but in the School of Policy Studies at Bristol during the project, collaborated with colleagues at SEI-Oxford and the University of Zambia to design and conduct online and in-person surveys and interviews to elicit the lived experiences of flooding from residents in George and Kanyama, as well as experiences of those managing flood risks in the city authorities. This work resulted in new information and knowledge, such as the relative perceived roles of climate change and flood management approaches in the levels of risk faced, that was further interrogated in the second Learning Lab.

Thanks to a reduction in covid risk, the second lab was able to take place entirely in person. Sadly I was unable to travel to Lusaka for the Lab, but the decision to remove the virtual element and focus on in-person interactions helped further promote active engagement amongst city decision-makers, researchers and other participants, and ultimately better achieve the goals of the Lab. Indeed the project helped us learn the limits of hybrid events. Whilst I remain a big advocate for remote technology, the project showed it can be far more productive to have solely in-person events where everyone is truly present.

The second Lab took place at the end of March 2022. In addition to Lusaka participants and members of the project team, we were also joined by the Mayor of Lusaka, Ms. Chilando Chitangala. As well as demonstrating how trusted and respected our partners in Lusaka are, the attendance of the mayor showed the commitment of the city government to addressing climate risks in Lusaka. We were extremely grateful for her time engaging in the discussions and sharing her perspectives.

During the lab the team focused on interrogating all of the evidence available, including the new understanding gained through the project from surveys, interviews, climate and flood data analysis, towards collaboratively mapping climate resilient development pathways for the city. The richness and openness in the discussions allowed progress to be made, though it remains clear that addressing flood risk in informal settlements in Lusaka is an incredibly challenging endeavour.

Photo: Participants at March 2022 Learning Lab in Lusaka

What did we achieve?

The main outcomes from the project include:

  1. Enabling co-exploration of knowledge and information to guide city officials (including the mayor – see quote below) in developing Lusaka’s new integrated development plan.
  2. Demonstrating that flooding will be an ongoing issue even if current drainage plans are implemented, with projections of more intense rainfall over the 21st century pointing to the need for more holistic, long-term and potentially radical solutions.
  3. A plan to integrate flood modelling outputs into the Lusaka Water Security Initiative (LuWSI) digital flood atlas for Lusaka.
  4. Sustaining relationships between FRACTAL partners and building new links with researchers at Bristol to enable future collaborations, including input to a new proposal in development for a multi-year follow-on to FRACTAL.
  5. A range of outputs, including contributing to a FRACTAL “principles” paper (McClure et al., 2022) supporting future participatory projects.

It has been such a privilege to lead the FRACTAL-PLUS project. I’m extremely grateful to the FRACTAL family for trusting me to lead the project, and for the input from colleagues at Bristol – Jeff Neal, Tom O’Shea, Rachel James, Mary Zhang, and especially Lauren Brown who expertly managed the project and guided me throughout.

I really hope I can visit Lusaka in the future. The city has a special place in my heart, even if I have only been there via Zoom!

“FRACTAL-PLUS has done well to zero in on the issue of urban floods and how climate change pressures are making it worse. The people of Lusaka have continually experienced floods in various parts of the city. While the problem is widespread, the most affected people remain to be those in informal settlements such as George and Kanyama where climate change challenges interact with poor infrastructure, poor quality housing and poorly managed solid waste.” Mayor Ms. Chilando Chitangala, 29 March 2022

————————————————————————————-

This blog is written by Dr Joe Daron, Senior Research Fellow, Faculty of Science, University of Bristol;
Science Manager, International Climate Services, Met Office; and Cabot Institute for the Environment member.
Find out more about Joe’s research at https://research-information.bris.ac.uk/en/persons/joe-daron.