IPCC blog series: Working Group 1 – The Physical Science Basis

This blog is part of a series from the Cabot Institute for the Environment on the Intergovernmental Panel on Climate Change’s recent AR6 report (IPCC, AR6), with this post covering the output of Working Group 1 and the physical scientific basis of climate change. This article also features a chat with Professor Dan Lunt, a Climate Scientist at the University of Bristol who focusses on paleoclimates and climate modelling, and a Lead Author on the IPCC’s AR6 report. For links to the rest of the series, see the bottom of the post.

The IPCC begins their 6th Assessment Report by explaining the physical science basis and publishing the finding of Working Group 1 (WG1) in August 2021. This means that, rather than considering the impact on humans, ecosystems and societies covered by later working groups, this report only looks at the effects on the planet from a physical standpoint. Consider this part of the report to be describing the problem, where later reports describe the impacts and then the possible solutions.

Here are the key points from WG1, detailing the physical science basis:

Human activity has unequivocally caused a change in the global climate.

If you were in any doubt before, let this be the sole key message you take away from this report.

Human activity has caused widespread warming of the land, ocean an atmosphere, affecting weather systems, ecosystems, and the cryosphere (areas covered by ice such as mountain glaciers and the polar regions).

One of the main drivers of this change has been Greenhouse Gases (GHGs), which have been observed to be increasing in atmospheric concentration since as far back as 1750 and the beginning. These gases, such as carbon dioxide (CO2), methane (CH4) and nitrous oxide (N2O), come from human processes that burn fossil fuels – transport, energy production, intense cattle farming for example.

Greenhouse gases in the atmosphere act like blanket, trapping rather than heart from the sun, warming the Earth. We also know from studying past climates that the Earth will get warmer with greater atmospheric CO2 levels.

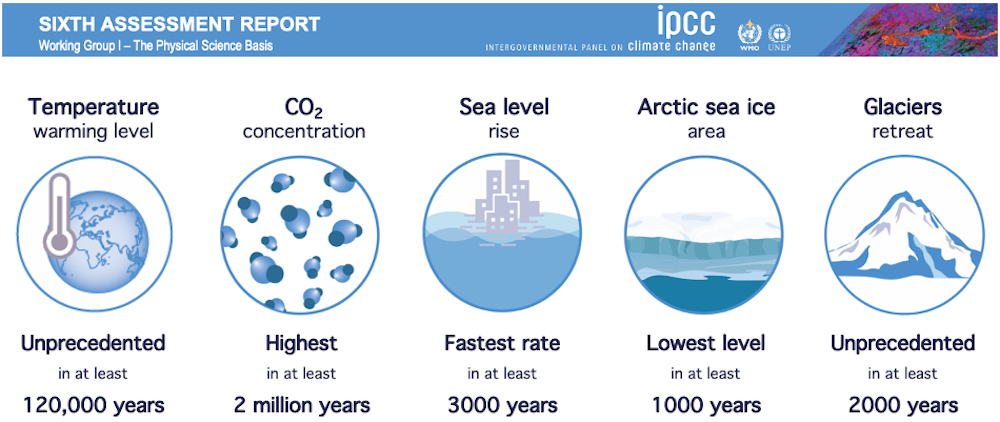
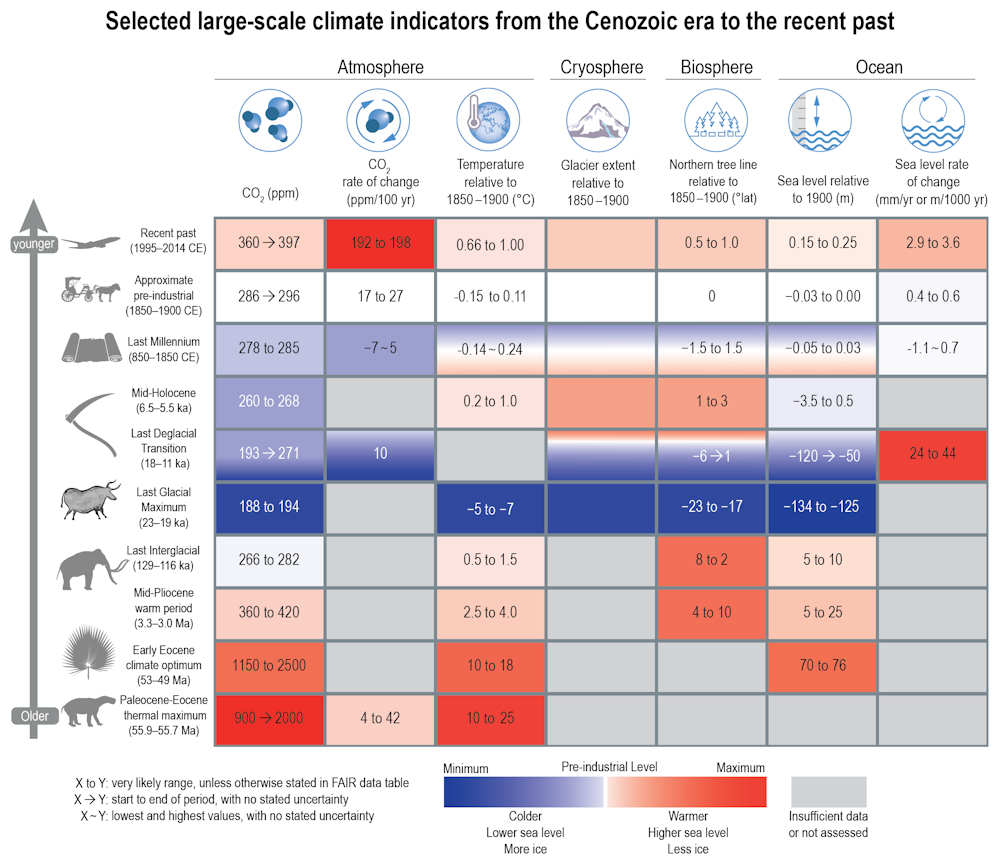
Changes to the climate are happening at an unprecedented rate.

Figure 1: Graph from AR6-WG1 showing the unprecedented levels of warming seen in the last 2000 years.

You may have heard that the Earth’s climate has naturally ebbed between periods of hot and cold. This is completely true, however it can be a misleading statement that completely undersells the issue. Human activity has caused the planet to warm at an unprecedented rate. We are currently undergoing thousands of years of warming in just a few decades (fig.1) – much to fast for adaptation from the world’s ecosystems.

As such, the Earth will take millions of years to recover and reach an equilibrium. I highly encourage you to check out climatearchive.org’s simulations of the next million years using cutting edge modelling data – created by the Cabot Institute for the Environment’s Sebastian Steinig.

Climate change is ALREADY affecting every inhabited region on Earth, with observed increases in extreme weather and climate extremes.

Many people believe that the climate crisis is far off in the future, a problem to prevent before it arrives. However, this is not the case. It’s already happening under our noses. And everywhere. Every inhabited region in the world currently experiences an increased likelihood of an extreme weather event, extreme heat drought, or extreme precipitation. This summer for example, temperatures in the UK have been modelled and subsequently measured to creep above 40°C, unprecedented for a region with a usually temperate climate and setting national records.

Increased warming leads to an increase in effect and creeps towards a tipping point from which recovery is impossible.

You might have heard phrases like “2 degree C future” or “1.5 degree C rise” in the news, but what do these really mean? These numbers refer to the global mean temperature rise using a rolling average of the previous 20 years, relative to the temperature measured between 1850-1900 when climate change started to begin. Currently, the average global temperature anomaly sits above 1 degree C of warming (fig.1).

The Earth system is remarkably robust, but not quite robust enough to maintain an equilibrium with such rapid warming in a short space of time. One place where this is most stark is the cryosphere – parts of the Earth usually covered by ice all year round (glaciers, polar regions for example).

Melting has already begun and will continue to happen for decades even if emissions magically ended tomorrow. This is incredibly troubling, since the cryosphere also happens to be huge carbon store in the form of methane trapped in the ice. This creates what’s known as a feedback loop, where the effects of warming lead to greater warming in themselves.

Through studying paleoclimates, the IPCC reports that climate sensitivity and therefore “tipping point” sits at around 3 degree C, resulting in total climate breakdown.

Significant and immediate action limiting Greenhouse Gas emissions will be a major key in fighting climate change.

The one silver lining the report alludes to is that IPCC scientists are confident that the climate crisis is caused primarily by greenhouse gas concentrations, therefore we know the solution – reducing emissions quickly and effectively will mitigate against the worst warming in a big way. Pursuing a net-zero CO2 strategy and limiting other GHG emissions will be absolutely necessary. Working Group 3’s report on the Mitigation of Climate Change goes into greater detail on how governments can work together to go about this. This will be published on 29 August 2022.

Insight from IPCC WG1 author Professor Dan Lunt

Professor Dan Lunt is a Professor of Climate Science, Cabot Institute member and a key author on the IPCC’s WGI report.

How did you get involved with IPCC AR6?

Dan Lunt

“I was involved with the previous IPCC report, AR5, providing some data and graphs for a section on polar amplification in past and future climates (the disproportionate warming of the polar regions relative to the rest of the Earth system). This time round, a call went out around four or five years ago for authors to work on the upcoming Sixth Assessment Report. I applied for and was chosen to be a Lead Author on Chapter 7 of the AR6 report – a section focussed the Earth’s radiation budget and Climate Sensitivity, as well as on paleoclimates as evidence for the patterns of global warming, such as polar amplification.”

What’s one key point you’d like to get across from the work of Working Group 1?

“For me, what I would interpret as the key message would be climate change is already happening, and it’s happening all over the globe. It’s unprecedented in terms of its magnitude and its speed of change, relative to the past tens of thousands of years. It’s unequivocally caused by human activity.”

“One of the new key points in this assessment report is that there’s a lot more evidence now that there are changes in the frequency of extreme events. We now have enough data to say that this increased frequency is human induced. So that’s more droughts, floods, extreme heat events etc.”

———————————–

We recommend taking a look at the IPCC’s full reports and report summaries for yourself if you seek to further understand the evidence and reasoning behind their headline statements.

As we’ve discussed the scientific basis for climate change, you may be wondering what the real-world impacts. The specific impacts on ecosystems, global health and on human society will be covered in greater detail in our summary of WG2’s report titled “Impacts, Adaption and Vulnerability”, publishing tomorrow (Thursday, 28th of August).


This blog was written by Cabot Communications Assistant Andy Lyford, an MScR Student studying Paleoclimates and Climate modelling on the Cabot Institute Master’s by Research in Global Environmental Challenges at the University of Bristol.

Andy Lyford


Humanity is compressing millions of years of natural change into just a few centuries

The near future may be similar to the mid-Pliocene warm period a few million years ago.
Daniel Eskridge / shutterstock

Many numbers are swirling around the climate negotiations at the UN climate summit in Glasgow, COP26. These include global warming targets of 1.5℃ and 2.0℃, recent warming of 1.1℃, remaining CO₂ budget of 400 billion tonnes, or current atmospheric CO₂ of 415 parts per million.

It’s often hard to grasp the significance of these numbers. But the study of ancient climates can give us an appreciation of their scale compared to what has occurred naturally in the past. Our knowledge of ancient climate change also allows scientists to calibrate their models and therefore improve predictions of what the future may hold.

Recent climate changes in context.
IPCC AR6, chapter 2

Recent work, summarised in the latest report of the Intergovernmental Panel on Climate Change (IPCC), has allowed scientists to refine their understanding and measurement of past climate changes. These changes are recorded in rocky outcrops, sediments from the ocean floor and lakes, in polar ice sheets, and in other shorter-term archives such as tree rings and corals. As scientists discover more of these archives and get better at using them, we have become increasingly able to compare recent and future climate change with what has happened in the past, and to provide important context to the numbers involved in climate negotiations.

For instance one headline finding in the IPCC report was that global temperature (currently 1.1℃ above a pre-industrial baseline) is higher than at any time in at least the past 120,000 or so years. That’s because the last warm period between ice ages peaked about 125,000 years ago – in contrast to today, warmth at that time was driven not by CO₂, but by changes in Earth’s orbit and spin axis. Another finding regards the rate of current warming, which is faster than at any time in the past 2,000 years – and probably much longer.

But it is not only past temperature that can be reconstructed from the geological record. For instance, tiny gas bubbles trapped in Antarctic ice can record atmospheric CO₂ concentrations back to 800,000 years ago. Beyond that, scientists can turn to microscopic fossils preserved in seabed sediments. These properties (such as the types of elements that make up the fossil shells) are related to how much CO₂ was in the ocean when the fossilised organisms were alive, which itself is related to how much was in the atmosphere. As we get better at using these “proxies” for atmospheric CO₂, recent work has shown that the current atmospheric CO₂ concentration of around 415 parts per million (compared to 280 ppm prior to industrialisation in the early 1800s), is greater than at any time in at least the past 2 million years.

chart showing climate changes over history
An IPCC graphic showing climate changes at various points since 56 million years ago. Note most rows show changes over thousands or millions of years, while the top row (recent changes) is just a few decades.
IPCC AR6, chapter 2 (modified by Darrell Kaufman)

Other climate variables can also be compared to past changes. These include the greenhouse gases methane and nitrous oxide (now greater than at any time in at least 800,000 years), late summer Arctic sea ice area (smaller than at any time in at least the past 1,000 years), glacier retreat (unprecedented in at least 2,000 years) sea level (rising faster than at any point in at least 3,000 years), and ocean acidity (unusually acidic compared to the past 2 million years).

In addition, changes predicted by climate models can be compared to the past. For instance an “intermediate” amount of emissions will likely lead to global warming of between 2.3°C and 4.6°C by the year 2300, which is similar to the mid-Pliocene warm period of about 3.2 million years ago. Extremely high emissions would lead to warming of somewhere between 6.6°C and 14.1°C, which just overlaps with the warmest period since the demise of the dinosaurs – the “Paleocene-Eocene Thermal Maximum” kicked off by massive volcanic eruptions about 55 million years ago. As such, humanity is currently on the path to compressing millions of years of temperature change into just a couple of centuries.

Small animals in a forest
Many mammals, like these horse-ancestors ‘Eohippus’, first appeared after a sudden warm period 55 million years ago.
Daniel Eskridge / shutterstock

Distant past can held predict the near future

For the first time in an IPCC report, the latest report uses ancient time periods to refine projections of climate change. In previous IPCC reports, future projections have been produced simply by averaging results from all climate models, and using their spread as a measure of uncertainty. But for this new report, temperature and rainfall and sea level projections relied more heavily on those models that did the best job of simulating known climate changes.

Part of this process was based on each individual model’s “climate sensitivity” – the amount it warms when atmospheric CO₂ is doubled. The “correct” value (and uncertainty range) of sensitivity is known from a number of different lines of evidence, one of which comes from certain times in the ancient past when global temperature changes were driven by natural changes in CO₂, caused for example by volcanic eruptions or change in the amount of carbon removed from the atmosphere as rocks are eroded away. Combining estimates of ancient CO₂ and temperature therefore allows scientists to estimate the “correct” value of climate sensitivity, and so refine their future projections by relying more heavily on those models with more accurate climate sensitivities.

Overall, past climates show us that recent changes across all aspects of the Earth system are unprecedented in at least thousands of years. Unless emissions are reduced rapidly and dramatically, global warming will reach a level that has not been seen for millions of years. Let’s hope those attending COP26 are listening to messages from the past.

——————————

This blog is written by Cabot Institute for the Environment member Dan Lunt, Professor of Climate Science, University of Bristol and Darrell Kaufman, Professor of Earth and Environmental Sciences, Northern Arizona University

This article is republished from The Conversation under a Creative Commons license. Read the original article.

Dan Lunt


Read all blogs in our COP26 blog series:

Atmospheric and oceanic impacts of Antarctic glaciation across the Eocene–Oligocene transition

Composite satellite image of what the Earth may have looked like prior to Antarctic
glaciation during the late Eocene (image by Alan Kennedy).

The Eocene-Oligocene Transition occurred approx. 34 million years ago and was one of the biggest climatic shifts since the end of the Cretaceous (with the extinction of the dinosaurs). The Earth dramatically cooled and the Antarctic ice sheet first formed, but the cause and nature of the cooling remain uncertain. Using a climate model, HadCM3L, we looked at the effect of ice sheet growth and palaeogeographical change (i.e. continental reconfiguration as Australia separated from Antarctica) on the Earth’s steady-state climate. We utilised four simulations: a late Eocene palaeogeography with and without an ice sheet and an early Oligocene palaeogeography with and without an ice sheet.

The formation of the Antarctic ice sheet causes a similar atmospheric response for both palaeogeographies: cooling of the air over Antarctica, intensification of the polar atmospheric cell and increased winds over the Southern Ocean. The sea surface temperature response to the growth of ice is very different, however, between the two palaeogeographies. For the Eocene palaeogeography there is a 6°C warming in the South Pacific sector of the Southern Ocean in response to ice growth, but very little change (or even a slight cooling) for the Oligocene palaeogeography. Why, under the same forcing (the appearance of the ice sheet), do these different palaeogeographies have such different sea surface temperature responses?

The stronger winds over the Southern Ocean force more-saline water from the southern Indian Ocean into the less-saline southern Pacific Ocean. This is particularly important for the Eocene simulations, where the narrow gap between Australia and Antarctica limits flow from the Indian to the Pacific Ocean. As salinity in the southern Pacific Ocean increases the water becomes denser and sinks, releasing heat. This accounts for the increase in sea surface temperature in the Eocene simulations. In the Oligocene simulations, flow is already much greater between the Indian and Pacific Oceans, and so there is no marked increase in density, sinking or sea surface temperature following glaciation. There is only a mild cooling due to the presence of the large, cold ice sheet.

Whether in reality the dominant ocean response to glaciation was warming or cooling may have impacted the growth of the ice sheet at this major transition in the Earth’s history. However, more importantly, this research highlights that sensitivity to subtle changes in palaeogeography can potentially have very large effects on the modelled climatic response to an event such as Antarctic glaciation. This could be very important for understanding palaeoclimate records and interpreting climate model results.

This research, carried out by Alan Kennedy, Dr Alex Farnsworth and Prof Dan Lunt of the Cabot Institute and University of Bristol with others, is featured in a special issue of the Philosophical Transactions of the Royal Society A. The full special issue on the theme of ‘Feedbacks on climate in the Earth System’ and the paper can be accessed here.

Special issue cover (image from Royal Society).

Citation: Kennedy A.T., Farnsworth A., Lunt D.J., Lear C.H., & Markwick P.J. (2015) Atmospheric and oceanic impacts of Antarctic glaciation across the Eocene–Oligocene transition. Phil. Trans. R. Soc. A, 373, 20140419, doi:10.1098/rsta.2014.0419.
—————————-
This blog is written by Alan Kennedy from the School of Geographical Sciences at the University of Bristol.  This blog post was edited from Alan’s blog post at Ezekial Boom.

Alan Kennedy