Humanity is compressing millions of years of natural change into just a few centuries

The near future may be similar to the mid-Pliocene warm period a few million years ago.
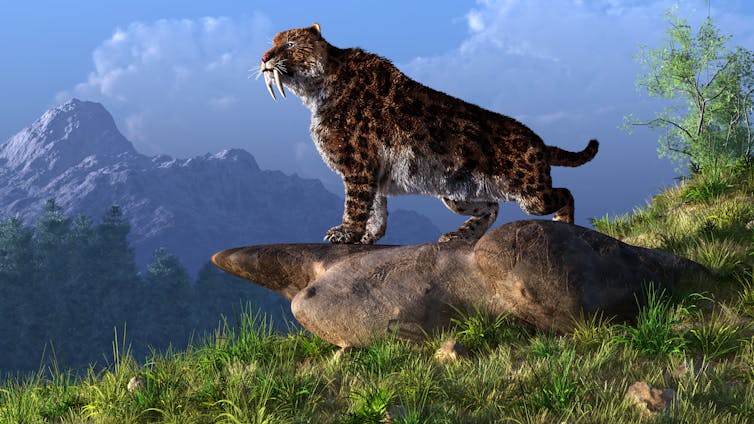
Daniel Eskridge / shutterstock

Many numbers are swirling around the climate negotiations at the UN climate summit in Glasgow, COP26. These include global warming targets of 1.5℃ and 2.0℃, recent warming of 1.1℃, remaining CO₂ budget of 400 billion tonnes, or current atmospheric CO₂ of 415 parts per million.

It’s often hard to grasp the significance of these numbers. But the study of ancient climates can give us an appreciation of their scale compared to what has occurred naturally in the past. Our knowledge of ancient climate change also allows scientists to calibrate their models and therefore improve predictions of what the future may hold.

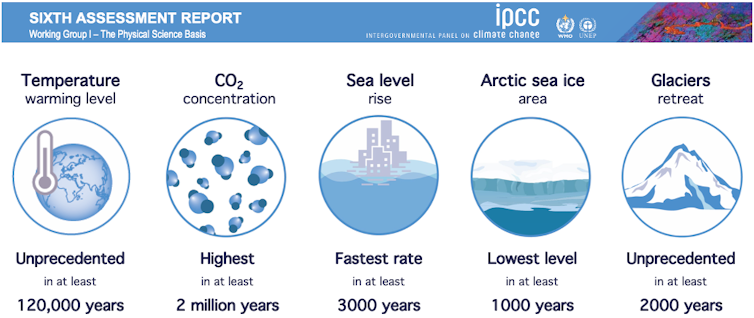
Recent climate changes in context.
IPCC AR6, chapter 2

Recent work, summarised in the latest report of the Intergovernmental Panel on Climate Change (IPCC), has allowed scientists to refine their understanding and measurement of past climate changes. These changes are recorded in rocky outcrops, sediments from the ocean floor and lakes, in polar ice sheets, and in other shorter-term archives such as tree rings and corals. As scientists discover more of these archives and get better at using them, we have become increasingly able to compare recent and future climate change with what has happened in the past, and to provide important context to the numbers involved in climate negotiations.

For instance one headline finding in the IPCC report was that global temperature (currently 1.1℃ above a pre-industrial baseline) is higher than at any time in at least the past 120,000 or so years. That’s because the last warm period between ice ages peaked about 125,000 years ago – in contrast to today, warmth at that time was driven not by CO₂, but by changes in Earth’s orbit and spin axis. Another finding regards the rate of current warming, which is faster than at any time in the past 2,000 years – and probably much longer.

But it is not only past temperature that can be reconstructed from the geological record. For instance, tiny gas bubbles trapped in Antarctic ice can record atmospheric CO₂ concentrations back to 800,000 years ago. Beyond that, scientists can turn to microscopic fossils preserved in seabed sediments. These properties (such as the types of elements that make up the fossil shells) are related to how much CO₂ was in the ocean when the fossilised organisms were alive, which itself is related to how much was in the atmosphere. As we get better at using these “proxies” for atmospheric CO₂, recent work has shown that the current atmospheric CO₂ concentration of around 415 parts per million (compared to 280 ppm prior to industrialisation in the early 1800s), is greater than at any time in at least the past 2 million years.

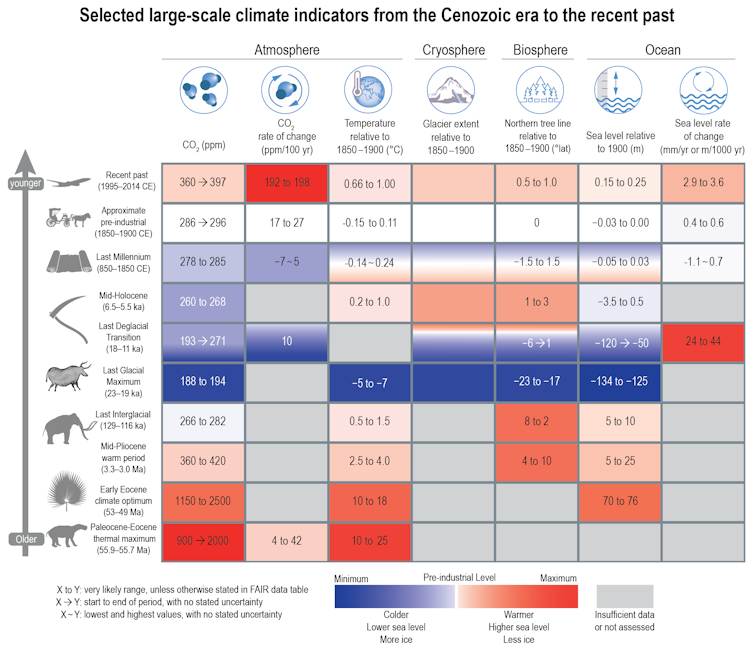
chart showing climate changes over history
An IPCC graphic showing climate changes at various points since 56 million years ago. Note most rows show changes over thousands or millions of years, while the top row (recent changes) is just a few decades.
IPCC AR6, chapter 2 (modified by Darrell Kaufman)

Other climate variables can also be compared to past changes. These include the greenhouse gases methane and nitrous oxide (now greater than at any time in at least 800,000 years), late summer Arctic sea ice area (smaller than at any time in at least the past 1,000 years), glacier retreat (unprecedented in at least 2,000 years) sea level (rising faster than at any point in at least 3,000 years), and ocean acidity (unusually acidic compared to the past 2 million years).

In addition, changes predicted by climate models can be compared to the past. For instance an “intermediate” amount of emissions will likely lead to global warming of between 2.3°C and 4.6°C by the year 2300, which is similar to the mid-Pliocene warm period of about 3.2 million years ago. Extremely high emissions would lead to warming of somewhere between 6.6°C and 14.1°C, which just overlaps with the warmest period since the demise of the dinosaurs – the “Paleocene-Eocene Thermal Maximum” kicked off by massive volcanic eruptions about 55 million years ago. As such, humanity is currently on the path to compressing millions of years of temperature change into just a couple of centuries.

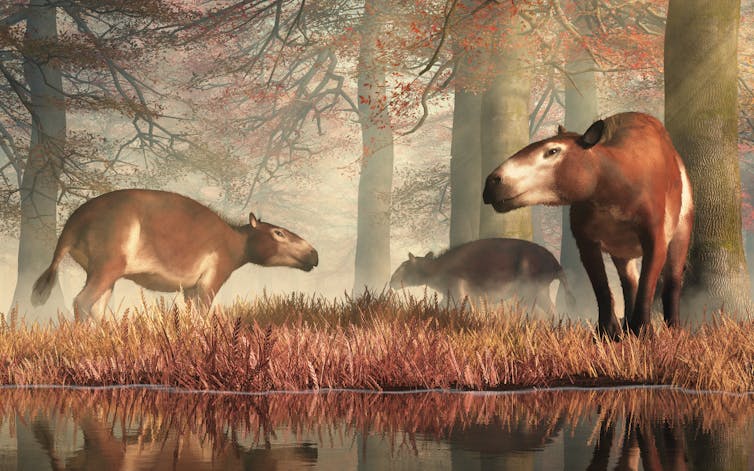
Small animals in a forest
Many mammals, like these horse-ancestors ‘Eohippus’, first appeared after a sudden warm period 55 million years ago.
Daniel Eskridge / shutterstock

Distant past can held predict the near future

For the first time in an IPCC report, the latest report uses ancient time periods to refine projections of climate change. In previous IPCC reports, future projections have been produced simply by averaging results from all climate models, and using their spread as a measure of uncertainty. But for this new report, temperature and rainfall and sea level projections relied more heavily on those models that did the best job of simulating known climate changes.

Part of this process was based on each individual model’s “climate sensitivity” – the amount it warms when atmospheric CO₂ is doubled. The “correct” value (and uncertainty range) of sensitivity is known from a number of different lines of evidence, one of which comes from certain times in the ancient past when global temperature changes were driven by natural changes in CO₂, caused for example by volcanic eruptions or change in the amount of carbon removed from the atmosphere as rocks are eroded away. Combining estimates of ancient CO₂ and temperature therefore allows scientists to estimate the “correct” value of climate sensitivity, and so refine their future projections by relying more heavily on those models with more accurate climate sensitivities.

Overall, past climates show us that recent changes across all aspects of the Earth system are unprecedented in at least thousands of years. Unless emissions are reduced rapidly and dramatically, global warming will reach a level that has not been seen for millions of years. Let’s hope those attending COP26 are listening to messages from the past.

——————————

This blog is written by Cabot Institute for the Environment member Dan Lunt, Professor of Climate Science, University of Bristol and Darrell Kaufman, Professor of Earth and Environmental Sciences, Northern Arizona University

This article is republished from The Conversation under a Creative Commons license. Read the original article.

Dan Lunt


Read all blogs in our COP26 blog series:

Just the tip of the iceberg: Climate research at the Bristol Glaciology Centre

As part of Green Great Britain Week, supported by BEIS, we are posting a series of blogs throughout the week highlighting what work is going on at the University of Bristol’s Cabot Institute for the Environment to help provide up to date climate science, technology and solutions for government and industry.  We will also be highlighting some of the big sustainability actions happening across the University and local community in order to do our part to mitigate the negative effects of global warming. Today our blog will look at ‘Explaining the latest science on climate change’.

Last week the Intergovernmental Panel on Climate Change (IPCC) released its special report on the impact of global warming of 1.5˚C. Professor Tony Payne – Head of the University of Bristol’s School of Geographical Sciences and Bristol Glaciology Centre (BGC) member – is one of the lead authors on the report, which highlights the increased threats of a 2˚C versus 1.5˚C warmer world. The report also lays out the mitigation pathways that must be taken if we are to meet the challenge of keeping global warming to 1.5˚C above pre-industrial levels.

The core of the report is a synthesis of over 6000 scientific papers detailing our current understanding of the climate system, and here at the BGC our research is focused on the role of the cryosphere in that system. The cryosphere, which refers to all the snow, ice and permafrost on the planet, is changing rapidly under global warming, and understanding how it will continue to evolve is critical for predicting our future climate. This is primarily due to the positive feedback loops in which it is involved, whereby a small change in conditions sets off a sequence of processes that reinforce and amplify the initial change. Despite the name, in the context of our current climate these positive feedback loops are almost always bad news and are responsible for some of the “tipping points” that could lead to runaway changes in the climate system.

I hope this post will give you a quick tour of just some of the research being carried out by scientists at the BGC, studying the way in which mountain glaciers, sea ice and the two great ice sheets of Antarctica and Greenland are responding to and influencing our changing climate.

Ice sheets

My own research examines ice flow at the margins of Antarctica. The Antarctic ice sheet is fringed by floating ice shelves, fed by large glaciers and ice streams that flow from the heart of the ice sheet towards the coast (see Figure 1). These ice shelves can provide forces that resist the glaciers that flow into them, reducing their speed and the amount of ice that enters the ocean. Crucially, once ice flows off the land and begins to float it causes the sea level to rise. My work is in modelling the interaction between ice shelves and the rest of the ice sheet to better quantify the role that ice shelves have in restraining ice loss from the continent. This will help to reduce the uncertainty in our predictions of future sea level rise, as the thinning and collapse of Antarctic ice shelves that we have seen in recent decades looks set to continue.

Figure 1: Schematic of the Antarctic ice sheet grounding line. Image credit: Bethan Davies, www.AntarcticGlaciers.org

To model ice flow in Antarctica with any success it is crucial to know the exact location of the point at which the ice sheet begins to float, called the ‘grounding line’. Research on this within the BGC is being done by Dr Geoffrey Dawson and Professor Jonathan Bamber, using data from the European Space Agency’s CryoSat-2 satellite. Their method determines the location of the grounding line by measuring the rise and fall of the floating ice shelves under the influence of ocean tides. Recently published work from this project has improved our knowledge of the grounding line location near the Echelmeyer ice stream in West Antarctica and this method is currently being rolled out across the rest of the ice sheet [1].

In the Northern Hemisphere, the Black and Bloom project led by Professor Martyn Tranter is studying ice algae on the second largest ice mass on Earth, the Greenland Ice Sheet (GrIS). The large, dark regions that appear on the GrIS in the summer are, in part, down to blooms of algae growing in the presence of meltwater on the ice sheet (see Figure 2). This bloom is darker than the surrounding ice surface and so reduces the albedo (a measure, between 0 and 1, of a surface’s reflectivity). A reduced ice sheet albedo means more of the sun’s energy is absorbed and the surface becomes warmer, which produces more meltwater, and more algae, leading to more energy absorption in a classic example of a positive feedback loop. The aim of the project, a partnership between biologists and glaciologists within the BGC, is to take measurements of algal growth and to incorporate their effect on albedo into climate models. A recent paper from the group, led by Dr Chris Williamson, revealed the abundance and species of microbial life that are growing on the GrIS [2], and this summer the team returned to the field to extend their work to more northerly regions of the ice sheet.

Figure 2: Bags of surface ice collected on the Greenland Ice Sheet showing the change in albedo with (from left to right) low, medium and high amounts of algae present.

Sea ice

Moving from land-based ice and into the ocean, Arctic sea ice is also being studied within the BGC. Regions of the Arctic have warmed at over 3 times the global average during the last century and there has consequently been a dramatic decline in the amount of sea ice that survives the summer melt season. The minimum, summer Arctic sea ice extent is currently declining at 13.2% per decade. Predicting the future of Arctic sea ice is critical for understanding global climate change due to the presence of another positive feedback loop: reduced summer sea ice replaces the white, high albedo ice surface with the darker, low albedo, ocean surface. This means that more solar energy is absorbed, raising surface temperatures and increasing ice melt, leading to more exposed ocean and further warming.

Dr Jack Landy has used remote sensing data from satellites, including CryoSat-2 and ICESat, to measure the roughness of Arctic sea ice and to model the impact that changing roughness has on albedo (see Figure 3). The roughness of the sea ice controls the size of the meltwater ponds that can form on the surface. With less sea ice lasting through multiple summer melt seasons, the trend is for Arctic sea ice to become smoother, allowing larger and larger ponds to form which, again, have a lower albedo than the ice surface they sit on, creating yet another positive feedback loop [3].

Figure 3: Panels a and b are predictions for summer (June to August) Arctic sea ice albedo based upon ice roughness observations made in March of 2005 and 2007 respectively. Panels c and d show the actual, observed summer albedo in those years. Image credit: Dr Jack Landy [3].

Mountain glaciers

A third element of the cryosphere studied at the BGC are glaciers in high mountain regions such as the Andes and the Himalayas. Led by Professor Jemma Wadham, the new Director of the Cabot Institute, this work focuses on the biology and chemistry of the meltwater produced from these glaciers. This summer a team of postgraduate researchers from the BGC – Rory Burford, Sarah Tingey and Guillaume Lamarche-Gagnon – travelled to the Himalayas in partnership with Jawaharlal Nehru University, New Delhi, to collect meltwater samples from the streams emanating from the Chhota Shigri glacier. These streams eventually flow into the Indus river, a vital water source for agriculture and industry in Pakistan. It is therefore crucial to understand how the quality of this water source might change in a warmer climate. Mercury, for example, is precipitated out of the atmosphere by snowfall and can collect and become concentrated within these high mountain glaciers. In the shorter term, if these glaciers continue to melt more rapidly, larger amounts of mercury will be released into the environment and will impact the quality of water that supports millions of people. On longer time scales, the retreat and reduction in volume of the Himalayan glaciers will reduce the amount of water supplied to communities downstream, with huge implications for water security in the region.

Figure 4: Photo from Himalayan fieldwork. Image credit: Guillaume Lamarche-Gagnon

Outlook

This is just the tip of the BGC research iceberg, with field data from this summer currently being pored over and new questions being developed. This work will hopefully inform the upcoming IPCC special report on the oceans and cryosphere (due in 2019), which is set to be another significant chance to assess and share our understanding of the ice on our planet and what it means for the challenges we have set for ourselves in tackling climate change.

References

[1] Dawson, G. J., & Bamber, J. L. (2017). Antarctic grounding line mapping from CryoSat‐2 radar altimetry. Geophysical Research Letters, 44, 11,886–11,893. https://doi.org/10.1002/2017GL075589

[2] Williamson, C. J., Anesio, A. M., Cook, J., Tedstone, A., Poniecka, E., Holland, A., Fagan, D., Tranter, M., & Yallop, M. L. (2018). ‘Ice algal bloom development on the surface of the Greenland Ice Sheet’. FEMS Microbiology Ecology, 94,3. https://doi.org/10.1093/femsec/fiy025

[3] Landy, J. C., J. K. Ehn, and D. G. Barber (2015). Albedo feedback enhanced by smoother Arctic sea ice. Geophysical Research Letters, 42, 10,714–10,720. https://doi.org/10.1002/2015GL066712

——————————–
This blog was written by Cabot Institute member Tom Mitcham. He is a PhD student in the School of Geographical Sciences at the University of Bristol and is studying the ice dynamics of Antarctic ice shelves and their tributary glaciers.

Tom Mitcham

Read other blogs in this Green Great Britain Week series:
1. Just the tip of the iceberg: Climate research at the Bristol Glaciology Centre
2. Monitoring greenhouse gas emissions: Now more important than ever?
3. Digital future of renewable energy
4. The new carbon economy – transforming waste into a resource
5. Systems thinking: 5 ways to be a more sustainable university
6. Local students + local communities = action on the local environment

Back to the Future ‘Hothouse’

Our current global warming target and the trajectory it places us on, towards a future ‘Hothouse Earth’, has been the subject of much recent discussion, stimulated by a paper by Will Steffen and colleagues.  In many respects, the key contribution of this paper and similar work is to extend the temporal framing of our climate discussions, beyond 2100 for several centuries or more.  Analogously, it is useful to extend our perspective backwards to similar time periods, to reflect on the last time Earth experienced such a Hothouse state and what it means.

The Steffen et al paper allows for a variety of framings, all related to the range of natural physical, biological and chemical feedbacks that will amplify or mitigate the human intervention in climate.  [Note: the authors frame their paper around the concept of a limited number of steady state scenarios/temperatures for the Earth.  They then argue that aiming for 2C, potentially an unstable state, could trigger feedbacks tipping the world towards the 4C warmer Hothouse.  I find that to be somewhat simplistic given the diversity of climate states that have existed, if even transiently, over the past 15 million years, but that is a discussion for another day.] From my perspective, the most useful framing – and one that remains true to the spirit of the paper is this: We have set a global warming limit of 2C by 2100, with an associated carbon budget. What feedback processes will that carbon budget and warming actually unleash over the coming century,  how much additional warming will they add, and when?

That is a challenging set of questions that comes with a host of caveats, most related to the profound uncertainty in the interlinked biogeochemical processes that underpin climate feedbacks. For example, as global warming thaws the permafrost, will it release methane (with a high global warming potential than carbon dioxide)? Will the thawed organic matter oxidise to carbon dioxide or will it be washed and buried in the ocean? And will the increased growth of plants under warmer conditions lead instead to the sequestration of carbon dioxide? The authors refer to previous studies that suggest a permafrost feedback yielding an additional 0.1C warming by the end of the century; but there is great uncertainty in both the magnitude of that impact and its timing.

And timing is the great question at the heart of this perspective piece.  I welcome it, because too often our perspective is fixed on the arbitrary date of 2100, knowing full well that the Earth will continue to warm and ice continue to melt long after that date.  In this sense, Steffen et al is not a contradiction to what has been reported from the IPCC but an expansion on it.

Classically, we discuss these issues in terms of fast and slow feedbacks, but in fact there is a continuum between near instantaneous feedbacks and those that act over hundreds, thousands or even millions of years.  A warmer atmosphere will almost immediately hold more water vapour, providing a rapid positive feedback on warming – and one that is included in all of those IPCC projections.  More slowly, soil carbon, including permafrost, will begin to oxidise, with microbial activity stimulated and accelerated under warmer conditions – a feedback that is only just now being included in Earth system models.  And longer term, all manner of processes will come into play – and eventually, they will include the negative feedbacks that have helped regulate Earth’s climate for the past 4 billion years.

There is enough uncertainty in these processes to express caution in some of the press’s more exuberant reporting of this topic.  But lessons from the past certainly underscore the concerns articulated by Steffen et al.  We think that the last time Earth had 410 ppm CO2, a level similar to what you are breathing right now, was the Pliocene about 3 million years ago.  This was a world that was 1 to 2C warmer than today (i.e. 2 to 3C warmer than the pre-industrial Earth) and with sea levels about 10 m higher.  This suggests that we are already locked into a world that far exceeds the ambitions and targets of the Paris Agreement.  This is not certain as we live on a different planet and one where the great ice sheets of Greenland and Antarctica might not only be victims of climate change but climate stabilisers through ice-sheet hysteresis. And even if a Pliocene future is fixed, it might take centuries for that warming and sea level change to be realised.

But that analogue does suggest caution, as advocated by the Hothouse Earth authors.

It also prompts us to ask what the Earth was like the last time its atmosphere held about 500 ppm CO2, similar to the level needed to achieve the Paris Agreement to limit end-of-century warming below 2C.  A useful analogue for those greenhouse gas levels is the Middle Miocene Climate Optimum, which occurred from 17 to 14.7 million years ago.

Figure showing changes in ocean temperature (based on oxygen isotopic compositions of benthic foraminifera) and pCO2 over the past 60 million years (from Palaeo-CO2).  Solid symbols are from the d11B isotope proxy and muted symbols are from the alkenone-based algal carbon isotope fractional proxy. Note the spike in pCO2 associated with the MMCO at about 15 million years ago.

As one would expect for a world with markedly higher carbon dioxide levels, the Miocene was hotter than the climate of today.  And consistent with many of Steffen et al.’s arguments, it was about 4C hotter rather than a mere 2C, likely due to the range of carbon cycle and ice-albedo feedbacks they describe.  But such warmth was not uniform – globally warmer temperatures of 4C manifest as far hotter temperatures in some parts of the world and only slightly warmer temperatures elsewhere. Pollen and microbial molecular fossils from the North Sea, for example, indicate that Northern Europe experienced sub-tropical climates.

But what were the impacts of this warmth?  What is a 4C warmer world like?  To understand that, we also need to understand the other ways in which the Miocene world differed from ours, not just due to carbon dioxide concentrations but also the ongoing movement of the continents and the continuing evolution of life.  In both respects, the Miocene was broadly similar to today.  The continents were in similar positions, and the geography of the Miocene is one we would recognise. But there were subtle differences, including the ongoing uplift of the Himalayas and the yet-to-be-closed gateway between North and South America, and these subtle differences could have had major impacts on Asian climate and the North Atlantic circulation, respectively.

Similarly, the major animal groups had evolved by this point, and mammals had firmly established their dominance in a world separated by 50 million years from the dinosaurs.  Remnant groups from earlier times (hell pigs!) still terrorised the landscape, but many of the groups were the same or closely related to those we would recognise today.  And although hominins would not appear until the end of the Miocene, the apes had become well established, represented by as many as a 100 species. In the oceans, the differences were perhaps more apparent, the seas thriving with the greatest diversity of cetaceans in the history of our planet and associated with them the gigantic macro-predators such as Charcharadon megalodon (The MegTM).

Smithsonian mural showing Miocene Fauna and landscape.

But it is the plants that exhibit the most pronounced differences between modern and Miocene life. Grasses had only recent proliferated across the planet at the time of the MMCO, and the C4 plants had yet to expand to their current dominance. And in this regard, the long-term evolution of Earth’s climate likely played a crucial role.  There are about 8100 species of C4 plants (although this comprises only 3% of the plant species known to us) and most of these are grasses with other notable species being maize and sugar cane. They are distinguished from the dominant C3 plants, which comprise almost all other species, by virtue of their carbon dioxide assimilation biochemistry (the Hatch-Slack mechanism) and their leaf cellular physiology (the Kranz leaf anatomy).  It is a collective package that is exceptionally well adapted to low carbon dioxide conditions, and their global expansion about 7 million years ago was almost certainly related to the long-term decline in carbon dioxide from the high levels of the Middle Miocene. Although C4 plants only represent a small proportion of modern plant species, the Miocene world, bereft of them, would have looked far different than today – lacking nearly half of our modern grass species and by extension clear analogues to the vast African savannahs.

Aside from these, the most profound differences between the Miocene world and that of today would have been the direct impacts of higher global temperatures.  There is strong evidence that the Greenland ice sheet was far reduced in size compared to that of today, and its extent and even whether or not it was a persistent ice sheet or an ephemeral one remains the subject of debate. Similarly, West Antarctica was likely devoid of permanent ice, and the East Antarctic Ice Sheet was probably smaller – perhaps far smaller – than it is today.  And collectively, these smaller ice sheets were associated with a sea level that was about 40 m higher than that of today.

The hot Miocene world would have been different in other ways, including the hydrological cycle.  Although less studied than for other ancient intervals, it is almost certain that elevated warmth – and markedly smaller equator-to-pole temperature differences – would have impacted the global distribution of water.  More water was evidently exported to the high latitudes, resulting in a warmer and vegetated Antarctica where the ice had retreated. It was also likely associated with far more extreme rainfall events, with the hot air able to hold greater quantities of water.  More work is needed, but it is tempting to imagine the impact of these hot temperatures and extreme rainfall events.  They would have eroded the soil and flushed nutrients to the sea, perhaps bringing about the spread of anoxic dead zones, similar to the Oceanic Anoxic Events of the Mesozoic or the dead zones of modern oceans caused by agricultural run-off. Indeed, the Miocene is characterised by the deposition of some very organic-rich rocks, including the North Pacific Monterey Formation, speaking to the occurrence of reduced oxygen levels in parts of these ancient oceans.

****************************************************

It is unclear if our ambitions to limit global warming to 2C by the end of this century really have put us on a trajectory for 4C. It is unclear if we are destined to return to the Miocene.

But if so, the Miocene world is one both similar to but markedly distinct from our own – a world of hotter temperatures, extremes of climate, fewer grasslands, Antarctic vegetation, Arctic forests and far higher sea levels. Crucially, it is not the world for which our current society, its roads, cities, power plants, dams, borders, farmlands and treaties, has been designed.

Moreover, the MMCO Earth is a world that slowly evolved from an even warmer one over millions of years*; and that then evolved over further millions of years to the one in which we now inhabit. It is not a world that formed in a hundred or even a thousand years.  And that leaves us three final lessons from the past.  First, we do not know how the life of this planet, from coral reefs to the great savannahs, will respond to such geologically rapid change.  Second, we do not know how we will respond to such rapid change; if we must adapt, we must learn how to do so creatively, flexibly and equitably.  And third, it is probably not too late to prevent such a future from materialising, but even if it is, we still must act to slow down that rate of change to which we must adapt.

And we still must act to ensure that our future world is only 4C hotter and analogous to the Miocene; if we fail to act, the world will be even hotter, and we will have to extend our geological search 10s of millions of years further into the past, back to the Eocene, to find an even hotter and extreme analogue for our future Hothouse World.

*The final jump into the MMCO appears to have been somewhat more sudden, but still spanned around two-hundred thousand years.  A fast event geologically but not on the timescales of human history.

——————————-
This blog is written by Cabot Institute member Professor Rich Pancost, Head of Earth Sciences at the University of Bristol. This blog has been reposted with kind permission from Rich’s original blog.

Rich Pancost