
Quality Stock Arts/Shutterstock
Emissions of a super-strong greenhouse gas could be substantially reduced if factories would properly implement existing “destruction technology” in certain industrial production processes. If operated properly, emissions of this greenhouse gas could be cut by at least 85% – that’s equivalent to 17% of carbon dioxide emissions from global aviation.
Our research, published today in the journal Nature, scrutinises emissions of one of the most potent hydrofluorocarbon (HFC) greenhouse gases, called trifluoromethane (HFC-23). One gram of HFC-23 in the atmosphere contributes as much to the greenhouse effect as 12kg of carbon dioxide.
This unwanted byproduct comes from the production of certain gases used as refrigerants and the manufacture of fluoropolymers (a class of plastic chemicals) such as polytetrafluoroethylene (PTFE), a key ingredient in most non-stick cookware.

J.Thasit/Shutterstock
More than 150 countries have pledged to significantly reduce their HFC-23 emissions as part of the 2016 Kigali Amendment to an international treaty called the Montreal Protocol on substances that deplete the ozone layer. The breakdown of HFCs in the atmosphere does not directly link to ozone depletion, but HFCs were introduced to replace ozone-depleting substances such as chloroflourocarbons (CFCs), so they have been included in this regulation.
HFCs are also strong greenhouse gases. While the Kigali Amendment aims to reduce emissions of widely used HFCs, an exceptional arrangement is made for HFC-23. Because HFC-23 is largely emitted from production processes and not from end-use applications, its destruction as a by-product is required “to the extent practicable” as of 2020 – that means as much as possible, but it’s a vague limit.
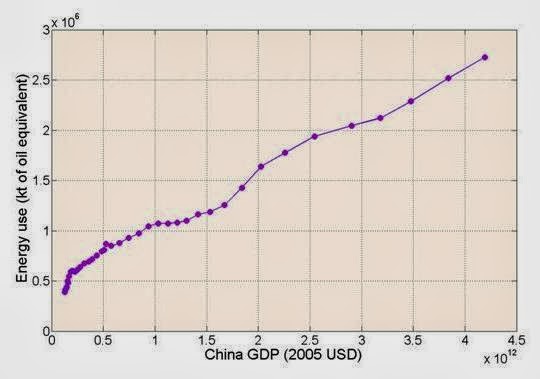
Even before 2020, many countries, including the biggest manufacturers of PTFE such as China, reported they had installed destruction technologies at PTFE factories and are successfully destroying HFC-23. In 2020, the reported global annual emissions of HFC-23 were only around 2,000 metric tonnes – but actual global emissions, derived from atmospheric measurements, amounted to around 16,000 metric tonnes.
To unravel this discrepancy between real and reported emissions, we analysed HFC-23 emissions from a major European PTFE factory in the Netherlands, which already operates destruction technologies – these include the incineration of harmful byproducts.
The aim of our experiment was to define what “practicable” actually means, and to identify how much HFC-23 can be easily destroyed by existing technology at a factory-wide scale, considering that emissions come from both the chimneys and leaks from other parts of the plant.
With the factory’s collaboration and the consent of the Dutch environment authorities, we released a controlled amount of a tracer gas directly next to the factory: this is a non-toxic, degradable gas that does not occur in the atmosphere. We then measured the concentrations of HFC-23, other byproducts of flouropolymer manufacture, and the released tracer at an observing site run by the Europe-wide greenhouse gas research centre, the Integrated Carbon Observation System, near the Dutch village of Cabauw.
This 213m-tall tower is located around 25km away from the factory. We knew exactly how much tracer we had released and how much of it arrived at the measuring point, so we could calculate the emissions of HFC-23 and other gases.

ICOS RI/Tom Oudijk, Sander Karsen, Dennis Manda, CC BY-NC-ND
Results showed that even though our estimated emissions were higher than those reported by the factory, the technology at this particular factory was working properly and successfully destroying HFC-23.
Upscaling to global emissions
However, as the industrial manufacture of fluoropolymers is currently the major known source of HFC-23 to the atmosphere, we suspect that destruction technologies are not as effectively operated as reported by manufacturers.
Our findings indicate that if all factories globally were controlling emissions in the same way as the Dutch site, HFC-23 emissions could be cut by at least around 85%, representing emissions equivalent to 170 million metric tonnes of carbon dioxide per year. This reduction equates to almost one-fifth (17%) of carbon dioxide emissions generated by all aviation traffic.
Real and reported emissions of HFC-23
An independent auditing framework for fluoropolymer production would ensure that HFC-23 is destroyed properly at factories around the world. Targeted monitoring of greenhouse gas emissions resulting from the production of fluorochemicals would further the understanding of emission sources and ensure that countries are fully compliant under different international climate and environment agreements.
Our results show that destruction technologies can effectively be implemented – in this case, at factories producing fluoropolymers such as PTFE, to significantly reduce the emissions of a highly potent greenhouse gas.
This blog is written by Dr Dominique Rust, Research Associate, School of Chemistry, University of Bristol; Dr Kieran Stanley, Senior Research Fellow, School of Chemistry, University of Bristol, and Stephen Henne, Senior Scientist, Group Atmospheric Modelling and Remote Sensing, Swiss Federal Institute of Technology Zurich. This article is republished from The Conversation under a Creative Commons license. Read the original article.


.jpg)


.jpg?uselang=en-gb)