East Africa must prepare for more extreme rainfall during the short rainy season – new study

Rainy season in Kenya

East Africa has recently had an unprecedented series of failed rains. But some rainy seasons are bringing the opposite: huge amounts of rainfall.

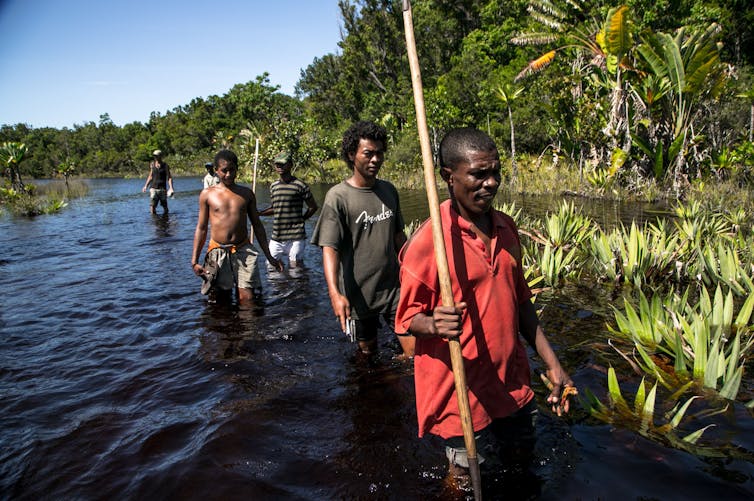
In the last few months of 2023, the rainy season known as the “short rains” was much wetter than normal. It brought severe flooding to Kenya, Somalia and Tanzania. In Somalia, more than 2 million people were affected, with over 100 killed and 750,000 displaced from their homes. Tens of thousands of people in northern Kenya lost livestock, farmland and homes.

The very wet short rainy seasons are linked to a climate event known as a positive Indian Ocean Dipole (known as the “IOD”). And climate model projections show an increasing trend of extreme Indian Ocean dipoles.

In a new research paper, we set out to investigate what effect more frequent extreme Indian Ocean Dipole events would have on rainfall in east Africa. We did this using a large number of climate simulations and models.

Our results show that they increase the likelihood of very wet days – therefore making very wet seasons.

This could lead to extreme weather events, even more extreme than the floods of 1997, which led to 10 million people requiring emergency assistance, or those of 2019, when hundreds of thousands were displaced.

We recommend that decision-makers plan for this kind of extreme rainfall, and the resulting devastating floods.

How the Indian Ocean Dipole works

Indian Ocean Dipole events tend to occur in the second half of the year, and can last for months. They have two phases: positive and negative.

Positive events occur when the temperature of the sea surface in the western Indian Ocean is warmer than normal and the temperature in the eastern Indian Ocean is cooler than normal. Put simply, this temperature difference happens when winds move warmer water away from the ocean surface in the eastern region, allowing cooler water to rise.

In the warmer western Indian Ocean, more heated air will rise, along with water vapour. This forms clouds, bringing rain. Meanwhile, the eastern part of the Indian Ocean will be cooler and drier. This is why flooding in east Africa can happen at the same time as bushfires in Australia.

The opposite is true for negative dipole events: drier in the western Indian Ocean and wetter in the east.

Under climate change we’re expecting to see more frequent and more extreme positive dipole events – bigger differences between east and west. This is shown by climate model projections. They are believed to be driven by different paces of warming across the tropical Indian Ocean – with western and northern regions projected to warm faster than eastern parts.

Often heavy rain seasons in east Africa are attributed to El Niño, but recent research has shown that the direct impact of El Niño on east African rainfall is actually relatively modest. El Niño’s principal influence lies in its capacity to bring about positive dipole events. This occurs since El Niño events tend to cool the water in the western Pacific Ocean – around Indonesia – which also helps to cool down the water in the eastern Indian Ocean. These cooler temperatures then help kick-start a positive Indian Ocean Dipole.

Examining unprecedented events

Extreme positive Indian Ocean Dipole events are rare in the recent climate record. So to examine their potential impacts on rainfall extremes, we used a large set of climate simulations. The data allowed us to diagnose the sensitivity of rainfall to larger Indian Ocean Dipole events in a statistically robust way.

Our results show that as positive dipole events become more extreme, more wet days during the short rains season can be expected. This effect was found to be largest for the frequency of extremely wet days. Additionally, we found that as the dipole strength increases, the influence on the most extreme days becomes even larger. This means that dipole events which are even slightly “record-breaking” could lead to unprecedented levels of seasonal rainfall.

Ultimately, if positive Indian Ocean Dipole seasons increase in frequency, as predicted, regular seasons of flooding impacts will become a new normal.

One aspect not included in our analysis is the influence of a warmer atmosphere on rainfall extremes. A warmer atmosphere holds more moisture, allowing for the development of more intense rain storms. This effect could combine with the influence of extreme positive dipoles to bring unprecedented levels of rainfall to the Horn of Africa.

2023 was a year of record-breaking temperatures driven both by El Niño and global warming. We might expect that this warmer air could have intensified rain storms during the season. Indeed, evidence from a recent assessment suggests that climate change-driven warming is highly likely responsible for increased rainfall totals.

Responding to an unprecedented future

Policymakers need to plan for this.

In the long term it is crucial to ensure that any new infrastructure is robust to withstand more frequent and heavier rains, and that government, development and humanitarian actors have the capacity to respond to the challenges.

Better use of technology, such as innovations in disseminating satellite rainfall monitoring via mobile phones, can communicate immediate risk. New frontiers in AI-based weather prediction could improve the ability to anticipate localised rain storms, including initiatives focusing on eastern Africa specifically.

Linking rainfall information with hydrological models designed for dryland environments is also essential. These will help to translate weather forecasts into impact forecasts, such as identifying risks of flash flooding down normally dry channels or bank overflow of key rivers in drylands.

These technological improvements are crucial. But better use of the forecast information we already have can also make a big difference. For instance, initiatives like “forecast-based financing”, pioneered by the Red Cross Red Crescent movement, link forecast triggers to pre-approved financing and predefined action plans, helping communities protect themselves before hazards have even started.

For these endeavours to succeed, there must be dialogue between the science and practitioner communities. The scientific community can work with practitioners to integrate key insights into decisions, while practitioners can help to ensure research efforts target critical needs. With this, we can effectively build resilience to natural hazards and resist the increasing risks of our changing climate.The Conversation

———————————

This blog is written by David MacLeod, Lecturer in Climate Risk, Cardiff University; Erik W. Kolstad, Research professor, Uni Research; Cabot Institute for the Environment member Katerina Michaelides, Professor of Dryland Hydrology, School of Geographical Sciences, University of Bristol, and Michael Singer, Professor of Hydrology and Geomorphology, Cardiff University. This article is republished from The Conversation under a Creative Commons license. Read the original article.

Intense downpours in the UK will increase due to climate change – new study

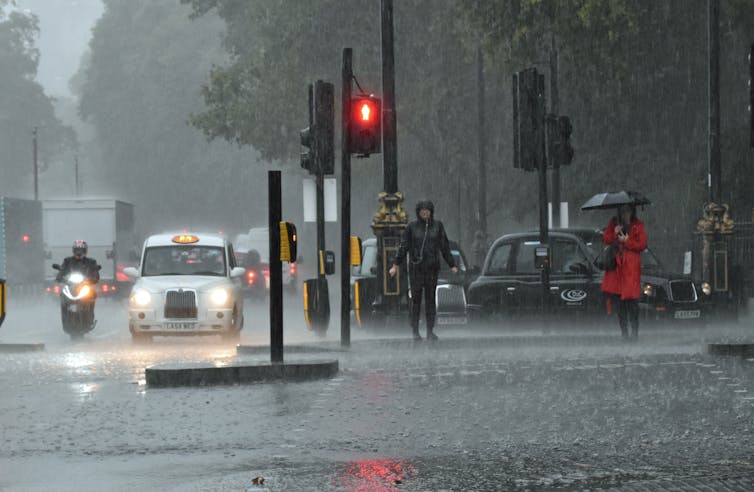
A flash flood in London in October 2019.
D MacDonald/Shutterstock

Elizabeth Kendon, University of Bristol

In July 2021, Kew in London experienced a month’s rain in just three hours. Across the city, tube lines were suspended and stations closed as London experienced its wettest day in decades and flash floods broke out. Just under two weeks later, it happened again: intense downpours led to widespread disruption, including the flooding of two London hospitals.

Colleagues and I have created a new set of 100-year climate projections to more accurately assess the likelihood of heavy rain downpours like these over the coming years and decades. The short answer is climate change means these extreme downpours will happen more often in the UK – and be even more intense.

To generate these projections, we used the Met Office operational weather forecast model, but run on long climate timescales. This provided very detailed climate projections – for every 2.2km grid box over the UK, for every hour, for 100 years from 1981 to 2080. These are much more detailed than traditional climate projections and needed to be run as a series of 20-year simulations that were then stitched together. Even on the Met Office supercomputer, these still took about six months to run.

We ran 12 such 100-year projections. We are not interested in the weather on a given day but rather how the occurrence of local weather extremes varies year by year. By starting the model runs in the past, it is also possible to verify the output against observations to assess the model’s performance.

At this level of detail – the “k-scale” – it is possible to more accurately assess how the most extreme downpours will change. This is because k-scale simulations better represent the small-scale atmospheric processes, such as convection, that can lead to destructive flash flooding.

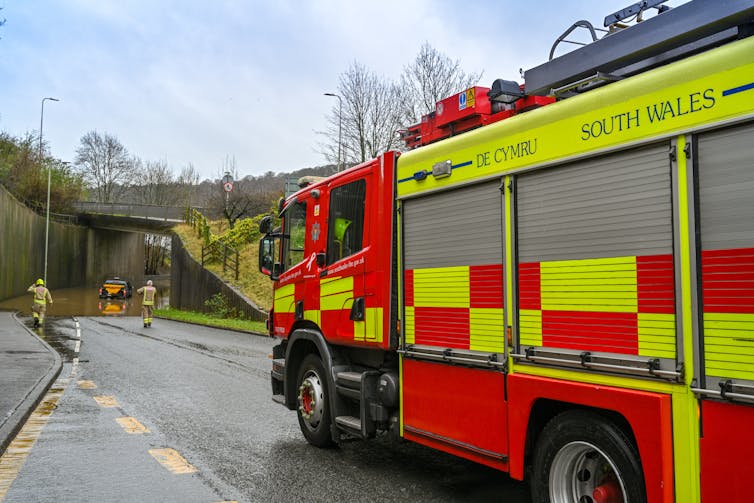
The fire service attending to a vehicle stuck in floodwater.
Flash flooding can be destructive.
Ceri Breeze/Shutterstock

More emissions, more rain

Our results are now published in Nature Communications. We found that under a high emissions scenario downpours in the UK exceeding 20mm per hour could be four times as frequent by the year 2080 compared with the 1980s. This level of rainfall can potentially produce serious damage through flash flooding, with thresholds like 20mm/hr used by planners to estimate the risk of flooding when water overwhelms the usual drainage channels. Previous less detailed climate models project a much lower increase of around two and a half times over the same period.

We note that these changes are assuming that greenhouse gas emissions continue to rise at current rates. This is therefore a plausible but upper estimate. If global carbon emissions follow a lower emissions scenario, extreme rain will still increase in the UK – though at a slower rate. However, the changes are not inevitable, and if we emit less carbon in the coming decades, extreme downpours will be less frequent.

The increases are significantly greater in certain regions. For example, extreme rainfall in north-west Scotland could be almost ten times more common, while it’s closer to three times more frequent in the south of the UK. The greater future increases in the number of extreme rainfall events in the higher resolution model compared with more traditional lower resolution climate models shows the importance of having k-scale projections to enable society to adapt to climate change.

As the atmosphere warms, it can hold more moisture, at a rate of 7% more moisture for every degree of warming. On a simple level, this explains why in many regions of the world projections show an increase in precipitation as a consequence of human-induced climate change. This new study has shown that, in the UK, the intensity of downpours could increase by about 5% in the south and up to about 15% in the north for every degree of regional warming.

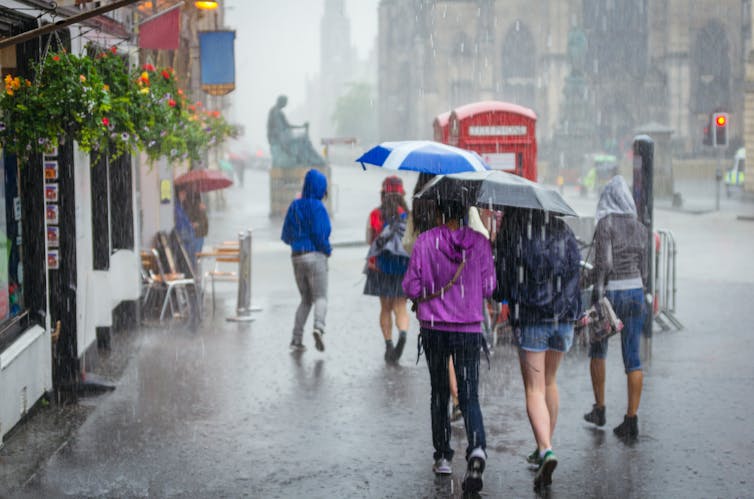
Group of girls with an umbrella walking through a city.
The projected increase in the intensity of rainfall is significantly greater in certain regions.
NotarYES/Shutterstock

However, it is far from a simple picture of more extreme events, decade by decade, as a steadily increasing trend. Instead, we expect periods of rapid change – with records being broken, some by a considerable margin – and periods when there is a pause, with no new records set.

This is simply a reflection of the complex interplay between natural variability and the underlying climate change signal. An analogy for this is waves coming up a beach on an incoming tide. The tide is the long-term rising trend, but there are periods when there are larger waves, followed by lulls.

Despite the underlying trend, the time between record-breaking events at the local scale can be surprisingly long – even several decades.

Our research marks the first time that such a high-resolution data set has spanned over a century. As well as being a valuable asset for planners and policymakers to prepare for the future, it can also be used by climate attribution scientists to examine current extreme rainfall events to see how much more likely they will have been because of human greenhouse gas emissions. The research highlights the importance of meeting carbon emissions targets and also planning for increasingly prevalent extreme rainfall events, which to varying degrees of intensity, look highly likely in all greenhouse gas emissions scenarios.

The tendency for extreme years to cluster poses challenges for communities trying to adapt to intense downpours and risks infrastructure being unprepared, since climate information based on several decades of past observations may not be representative of the following decades.


This blog is written by Cabot Institute for the Environment member Elizabeth Kendon, Professor of Climate Science, University of Bristol. This article is republished from The Conversation under a Creative Commons license. Read the original article.
Lizzie Kendon
Professor Lizzie Kendon

Climate change is threatening Madagascar’s famous forests – our study shows how serious it is

Urgent action is needed to protect Madagascar’s forests.
Rijasolo/AFP via Getty Images

Global climate change doesn’t only cause the melting of polar ice caps, rising sea levels and extreme weather events. It also has a direct effect on many tropical habitats and the animals and plants that inhabit them. As fossil fuel emissions continue to drive climate change, large areas of land are forecast to become much hotter and drier by the end of this century.

Many ecosystems, including tropical forests, wetlands, swamps and mangroves, will be unable to cope with these extreme climatic conditions. It is highly likely that the extent and condition of these ecosystems will decline. They will become more like deserts and savanna.

The island nation of Madagascar is of particular concern when it comes to climate change. Of Madagascar’s animal species, 85% cannot be found elsewhere on Earth. Of its plant species, 82% are unique to the island. Although a global biodiversity hotspot, Madagascar has experienced the highest rates of deforestation anywhere in the world. Over 80% of its original forest cover has already been cleared by humans.

This has resulted in large population declines in many species. For example, many species of lemurs (Madagascar’s flagship group of animals) have undergone rapid population decline, and over 95% of lemur species are now classified as threatened on the International Union for Conservation of Nature (IUCN) Red List.

Drier conditions brought about by climate change have already resulted in widespread bush fires throughout Madagascar. Drought and famine are increasingly severe for the people living in the far south and south-western regions of the island.

Madagascar’s future will likely depend profoundly on how swiftly and comprehensively humans deal with the current climate crisis.

What we found

Our study investigated how future climate change is likely to affect four of Madagascar’s key forest habitat types. These four forest types are the dry deciduous forests of the west, humid evergreen forests of the east, spiny bush forests of the arid south, and transitional forests of the north-west corner of the island.

Using computer-based modelling, we simulated how each forest type would respond to climate change from the current period up to the year 2080. The model used the known distribution of each forest type, and current and future climatic data.

We did this under two different conditions: a mitigation scenario, assuming human reliance on greenhouse gas reduces according to climate commitments already made; and an unmitigated scenario, assuming greenhouse gas emissions continue to increase at their current rate.

Our results suggest that unmitigated climate change will result in declines of Madagascar’s forests. The area of land covered by humid forest, the most extensive of the four forest types, is predicted to decrease by about 5.66%. Dry forest and spiny bush are also predicted to decline in response to unmitigated climate change. Transitional forest may actually increase by as much as 5.24%, but this gain will almost certainly come at the expense of other forest types.

We expected our model to show that mitigating climate change would result in net forest gain. Surprisingly, our results suggest entirely the opposite. Forest occurrence will decrease by up to 5.84%, even with efforts to mitigate climate change. This is because global temperatures are forecast to increase under both mitigated and unmitigated scenarios.

These predicted declines are in addition to the huge losses of forest already caused by ongoing deforestation throughout the island.

It looks as if the damage has already been done.

Climate change, a major threat

The results of our research highlight that climate change is indeed a major threat to Madagascar’s forests and likely other ecosystems worldwide. These findings are deeply concerning for the survival of Madagascar’s animals and plants, many of which depend entirely on forest habitat.

Not only will climate change decrease the size of existing forests, changes in temperature and rainfall will also affect the amount of fruit that trees produce.

A Lemur on tree in the forest.
Madagascar lemurs and other animal and plant species may become extinct if the forests disappear.
Rijasolo/AFP

Many of Madagascar’s animals, such as its lemurs, rely heavily on fruit for food. Changes in fruit availability will have serious impact on the health, reproductive success and population growth of these animals. Some animals may be able to adapt to changes in climate and habitat, but others are very sensitive to such changes. They are unlikely to survive in a hot, arid environment.

This will also have serious knock-on effects for human populations that depend on forests and animals for eco-tourism income. Approximately 75% of Madagascar’s population depends on the forest and subsistence farming for survival, and the tourism sector contributes over US$600 million towards the island’s economy annually.

To ensure that Madagascar’s forests survive, immediate action is needed to end deforestation, protect the remaining patches of forest, replant and restore forests, and mitigate global carbon emissions. Otherwise these remarkable forests will eventually disappear, along with all the animals and plants that depend on them.The Conversation

——————————

This blog is written by Daniel Hending, Postdoctoral Research Assistant Animal Vibration Lab, University of Oxford and Cabot Institute for the Environment member Marc Holderied, Professor in Sensory Biology, University of BristolThis article is republished from The Conversation under a Creative Commons license. Read the original article.
Marc Holderied


Tackling urban landslides in an uncertain future

One of the challenges of the 21st century is how to reconcile global urban growth with the prevention and mitigation of environmental disasters, such as those caused by landslides. Every year 300 million people are exposed to landslides worldwide, with over 4,000 fatalities, 250,000 of people affected, and billions of US dollars of economic damage. However, impacts might be worse in the future for two main reasons. First, severe precipitations might become more frequent under climate change, causing more rainfall-triggered landslides. Second, growing urban population will lead more people to live in areas exposed to landslides globally, and in particular in developing countries where low-income dwellers are starting to overcrowd landslide-prone areas such as steep slopes. With more hurricanes to come and more people at risk, understanding where and when landslides might occur is becoming increasingly crucial.

Current predictions are too uncertain to support decisions

One method to predict landslides in the future is to look at landslides in the past. The analysis of historical records allows the identification of those hillslopes that have failed in the past. Currently stable hillslopes where similar conditions exist (for example, similar slope gradients) are ‘tagged’ with high landslide probability. These areas might be then excluded for construction development or might be the first to be alerted when a severe precipitation is expected.

This approach to landslide prediction is, however, often insufficient. Landslides and rainfall records as well as data on hillslope properties are often affected by large errors or unavailable in sufficient detail. In addition, what happened in the past might not be representative of what may happen in the future, making historical records less useful for long-term projections. Climate and socio-economic models can be used to build scenarios of how rainfall patters and cities might look like in the future. Unfortunately, these scenarios can vary significantly because they depend on highly uncertain factors such as future carbon emissions. As a result, landslide estimates can also be very different and sometimes even contradictory – some predicting an increase and others a decrease in landslides occurrence – undermining their practical use for risk management.

From ‘predict then act’ to ‘act now with low regrets’

Instead of trying to predict how climate and urban expansion will evolve in the future, I used a different approach centred on decision making. I ask the question: how much climate and/or urban expansion needs to change before landslide hazard significantly increases?

The scientific method behind my analysis (Bozzolan et al. 2020, NHESS) first generates thousands of synthetic but realistic hillslopes representations of the study area. Then, it imposes hypothetical scenarios of increasing rainfall severities and urban expansion, also considering different construction features that could affect slope stability (for example, the presence or not of adequate slope drainage such as roof gutters on houses).

Finally, it uses a computer model to assess the stability of these virtual hillslopes, generating a new synthetic library of landslide records. By exploring the library is now possible to identify those combinations of rainfall and urban development conditions (e.g., with or without roof gutters) for which hillslopes are most likely to fail. ‘Low-regret’ mitigation actions will be those that perform well across scenarios and therefore should be prioritised even if future rainfall and urban predictions remain unknown.

A practical tool for decision makers

This new method which explores many ‘what if’ scenarios is a useful tool for decision makers in landslide risk management and reduction. For example, figure 1 shows how a map of landslide probability in Saint Lucia (Eastern Caribbean) might look like if the severity of a destructive rainstorm such as the 2010 Hurricane Tomas were to increase under climate change or if unregulated housing expanded on slopes susceptible to failure. The analysis also shows that when both scenarios are included landslide probability disproportionally increases, revealing that ‘the whole is greater than the sum of its parts’. This information could be used to assess the risk and damages associated with each scenario and to identify low-regret nation-wide risk reduction and risk transfer strategies.

Figure 1: Maps of landslide probability in Saint Lucia under different ‘what if’ scenarios. The percentage (+%) indicates the increase of areas with high landslide probability.

The same method can also be applied to quantify the cost-benefit ratio of different landslide mitigation options, such as improving urban drainage or tree planting at the community/household scale. In Freetown (Sierra Leone), for example, I collaborated with the engineering firm Arup to identify those landslide hazard mitigation actions that would lead to the largest reduction in landslide probability for certain locations or types of slopes, and should thus be prioritised. The information generated through this analysis not only provides evidence to governments and investors for informing urban planning, but it might also encourage landslide probability from low to high micro-insurance in disaster prevention, where insurers offer lower premiums to reward risk-reducing behaviours.

—————————–

This blog is written by Cabot Institute for the Environment member, Dr Elisa Bozzolan from the School of Civil Engineering at the University of Bristol.

World Water Day: Climate change and flash floods in Small Island Developing States

Pluvial flash flooding (otherwise known as flash flooding caused by rain) is a major hazard globally, but a particularly acute problem for Small Island Developing States (SIDS). Many SIDS experience extreme rainfall events associated with tropical cyclones (often referred to as hurricanes) which trigger excess surface water runoff and lead to pluvial flash flooding.

Following record-breaking hurricanes in the Caribbean such as Hurricane Maria in 2017 and Hurricane Dorian in 2019, the severe risk facing SIDS has been reaffirmed and labelled by many as a sign of the ‘new normal’ due to rising global temperatures under climate change. Nonetheless, in the Disaster Risk Reduction community there is a limited understanding of both current tropical-cyclone induced flood hazard and how this might change under different climate change scenarios, which inhibits attempts to build adaptive capacity and resilience to these events.

As part of the first year of my PhD research, I am applying rainfall data that has been produced by Emily Vosper and Dr Dann Mitchell in the University of Bristol BRIDGE group using a tropical cyclone rainfall model. This model uses climate model data to simulate a large number of tropical cyclone events in the Caribbean, which are used to understand how the statistics of tropical cyclone-induced rainfall might change under the 1.5C and 2C Paris Agreement scenarios. This rainfall data will be input into the hydrodynamic model LISFLOOD-FP to simulate pluvial flash flooding associated with hurricanes in Puerto Rico.

Investigating changes in flood hazard associated with different rainfall scenarios will help us to understand how flash flooding, associated with hurricanes, emerges under current conditions and how this might change under future climate change in Puerto Rico. Paired with data identifying exposure and vulnerability, my research hopes to provide some insight into how flood risk related to hurricanes could be estimated, and how resilience could be improved under future climate change.

————————————-
This blog is written by Cabot Institute member Leanne Archer, School of Geographical Sciences,  University of Bristol.
Leanne Archer

Climate-driven extreme weather is threatening old bridges with collapse

The recent collapse of a bridge in Grinton, North Yorkshire, raises lots of questions about how prepared we are for these sorts of risks. The bridge, which was due to be on the route of the cycling world championships in September, collapsed after a month’s worth of rain fell in just four hours, causing flash flooding.

Grinton is the latest in a series of such collapses. In 2015, first Storm Eva and then Storm Frank caused flooding which collapsed the 18th century Tadcaster bridge, also in North Yorkshire, and badly damaged the medieval-era Eamont bridge in nearby Cumbria. Floods in 2009 collapsed or severely damaged 29 bridges in Cumbria alone.

With climate change making this sort of intense rainfall more common in future, people are right to wonder whether we’ll see many more such bridge collapses. And if so – which bridges are most at risk?

In 2014 the Tour de France passed over the now-destroyed bridge near Grinton. Tim Goode/PA

We know that bridges can collapse for various reasons. Some are simply old and already crumbling. Others fall down because of defective materials or environmental processes such as flooding, corrosion or earthquakes. Bridges have even collapsed after ships crash into them.

Europe’s first major roads and bridges were built by the Romans. This infrastructure developed hugely during the industrial revolution, then much of it was rebuilt and transformed after World War II. But since then, various factors have increased the pressure on bridges and other critical structures.
For instance, when many bridges were first built, traffic mostly consisted of pedestrians, animals and carts – an insignificant load for heavy-weight bridges. Yet over the decades private cars and trucks have got bigger, heavier and faster, while the sheer number of vehicles has massively increased.

Different bridges run different risks

Engineers in many countries think that numerous bridges could have reached the end of their expected life spans (between 50-100 years). However, we do not know which bridges are most at risk. This is because there is no national database or method for identifying structures at risk. Since different types of bridges are sensitive to different failure mechanisms, having awareness of the bridge stock is the first step for an effective risk management of the assets.


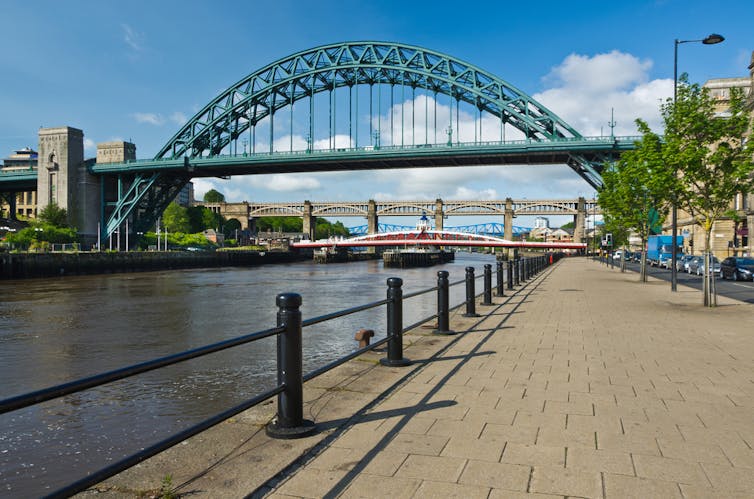
Newcastle’s various bridges all have different risks. Shaun Dodds / shutterstock

In Newcastle, for example, seven bridges over the river Tyne connect the city to the town of Gateshead. These bridges vary in function (pedestrian, road and railway), material (from steel to concrete) and age (17 to 150 years old). The risk and type of failure for each bridge is therefore very different.

Intense rain will become more common

Flooding is recognised as a major threat in the UK’s National Risk Register of Civil Emergencies. And though the Met Office’s latest set of climate projections shows an increase in average rainfall in winter and a decrease in average rainfall in summer, rainfall is naturally very variable. Flooding is caused by particularly heavy rain so it is important to look at how the extremes are changing, not just the averages.

Warmer air can hold more moisture and so it is likely that we will see increases in heavy rainfall, like the rain that caused the flash floods at Grinton. High resolution climate models and observational studies also show an intensification of extreme rainfall. This all means that bridge collapse from flooding is more likely in the future.

To reduce future disasters, we need an overview of our infrastructure, including assessments of change of use, ageing and climate change. A national bridge database would enable scientists and engineers to identify and compare risks to bridges across the country, on the basis of threats from climate change.


This blog is written by Cabot Institute member Dr Maria Pregnolato, Lecturer in Civil Engineering, University of Bristol and Elizabeth Lewis, Lecturer in Computational Hydrology, Newcastle University.  This article is republished from The Conversation under a Creative Commons license. Read the original article.

Why do flood defences fail?

More than 40,000 people were forced to leave their homes after Storm Desmond caused devastating floods and wreaked havoc in north-west England. Initial indications were that the storm may have caused the heaviest local daily rainfall on record in the UK. As much as £45m has been spent on flood defences in the region in the previous ten years and yet the rainfall still proved overwhelming. So what should we actually expect from flood defence measures in this kind of situation? And why do they sometimes fail?

We know that floods can and will happen. Yet we live and work and put our crucial societal infrastructure in places that could get flooded. Instead of keeping our entire society away from rivers and their floodplains, we accept flood risks because living in lowlands has benefits for society that outweigh the costs of flood damage. But knowing how much risk to take is a tricky business. And even when there is an overall benefit for society, the consequences for individuals can be devastating.

We also need to calculate risks when we build flood defences. We usually protect ourselves from some flood damage by building structures like flood walls and river or tidal barriers to keep rising waters away from populated areas, and storage reservoirs and canals to capture excess water and channel it away. But these structures are only designed to keep out waters from typical-sized floods. Bigger defences that could protect us from the largest possible floods, which may only happen once every 100 years, would be much more expensive to build and so we choose to accept this risk as less than the costs.

Balancing the costs and benefits

In the UK, the Environment Agency works with local communities to assess the trade off between the costs of flood protection measures, and the benefits of avoiding flood damage. We can estimate the lifetime benefits of different proposed flood protection structures in the face of typical-sized floods, as well as the results of doing nothing. On the other side of the ledger, we can also estimate the structures’ construction and maintenance costs.

In some cases, flood protection measures can be designed so that if they fail, they do the least damage possible, or at least avoid catastrophic damage. For example, a flood protection wall can be built so that if flood waters run over it they run into a park rather than residential streets or commercial premises. And secondary flood walls outside the main wall can redirect some of the overflow back towards the river channel.


Thames Barrier: big costs but bigger benefits.
Ross Angus/Flickr, CC BY-SA

The Environment Agency puts the highest priority on the projects with the largest benefits for the smallest costs. Deciding where that threshold should be set is a very important social decision, because it provides protection to some but not all parts of our communities. Communities and businesses need to be well-informed about the reasons for those thresholds, and their likely consequences.

We also protect ourselves from flood damage in other ways. Zoning rules prevent valuable assets such as houses and businesses being built where there is an exceptionally high flood risk. Through land management, we can choose to increase the amount of wooded land, which can reduce the impact of smaller floods. And flood forecasting alerts emergency services and helps communities rapidly move people and their portable valuables out of the way.

Always some risk

It’s important to realise that since flood protection measures never eliminate all the risks, there are always extra costs on some in society from exceptional events such as Storm Desmond, which produce very large floods that overwhelm protection measures. The costs of damage from these exceptional floods are difficult to estimate. Since these large floods have been rare in the past, our records of them are very limited, and we are not sure how often they will occur in the future or how much damage will they cause. We also know that the climate is changing, as are the risks of severe floods, and we are still quite uncertain about how this will affect extreme rainfall.


At the same time we know that it’s very hard to judge the risk from catastrophic events. For example, we are more likely to be afraid of catastrophic events such as nuclear radiation accidents or terrorist attacks, but do not worry so much about much larger total losses from smaller events that occur more often, such as floods.

Although the process of balancing costs against benefits seems clear and rational, choosing the best flood protection structure is not straightforward. Social attitudes to risk are complicated, and it’s difficult not to be emotionally involved if your home or livelihood are at risk.
The Conversation

————————————–
This blog is written by Cabot Institute member Dr Ross Woods, a Senior Lecturer in Water and Environmental Engineering, University of Bristol.  This article was originally published on The Conversation. Read the original article.
Ross Woods