Arctic Ocean could be ice-free in summer by 2030s, say scientists – this would have global, damaging and dangerous consequences

Ice in the Chukchi Sea, north of Alaska and Siberia.
NASA Goddard Space Flight Center

The Arctic Ocean could be ice-free in summer by the 2030s, even if we do a good job of reducing emissions between now and then. That’s the worrying conclusion of a new study in Nature Communications.

Predictions of an ice-free Arctic Ocean have a long and complicated history, and the 2030s is sooner than most scientists had thought possible (though it is later than some had wrongly forecast). What we know for sure is the disappearance of sea ice at the top of the world would not only be an emblematic sign of climate breakdown, but it would have global, damaging and dangerous consequences.

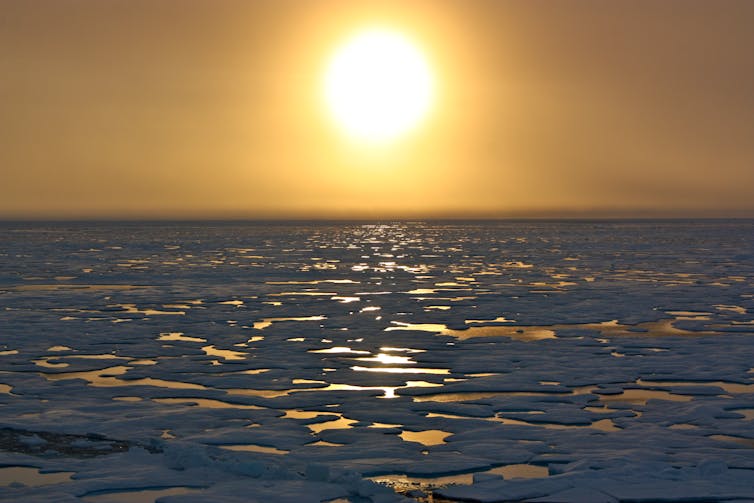
The Arctic has been experiencing climate heating faster than any other part of the planet. As it is at the frontline of climate change, the eyes of many scientists and local indigenous people have been on the sea ice that covers much of the Arctic Ocean in winter. This thin film of frozen seawater expands and contracts with the seasons, reaching a minimum area in September each year.

Animation of Arctic sea ice from space
Arctic sea ice grows until March and then shrinks until September.
NASA

The ice which remains at the end of summer is called multiyear sea ice and is considerably thicker than its seasonal counterpart. It acts as barrier to the transfer of both moisture and heat between the ocean and atmosphere. Over the past 40 years this multiyear sea ice has shrunk from around 7 million sq km to 4 million. That is a loss equivalent to roughly the size of India or 12 UKs. In other words, it’s a big signal, one of the most stark and dramatic signs of fundamental change to the climate system anywhere in the world.

As a consequence, there has been considerable effort invested in determining when the Arctic Ocean might first become ice-free in summer, sometimes called a “blue ocean event” and defined as when the sea ice area drops below 1 million sq kms. This threshold is used mainly because older, thicker ice along parts of Canada and northern Greenland is expected to remain long after the rest of the Arctic Ocean is ice-free. We can’t put an exact date on the last blue ocean event, but one in the near future would likely mean open water at the North Pole for the first time in thousands of years.

Annotated map of Arctic
The thickest ice (highlighted in pink) is likely to remain even if the North Pole is ice-free.
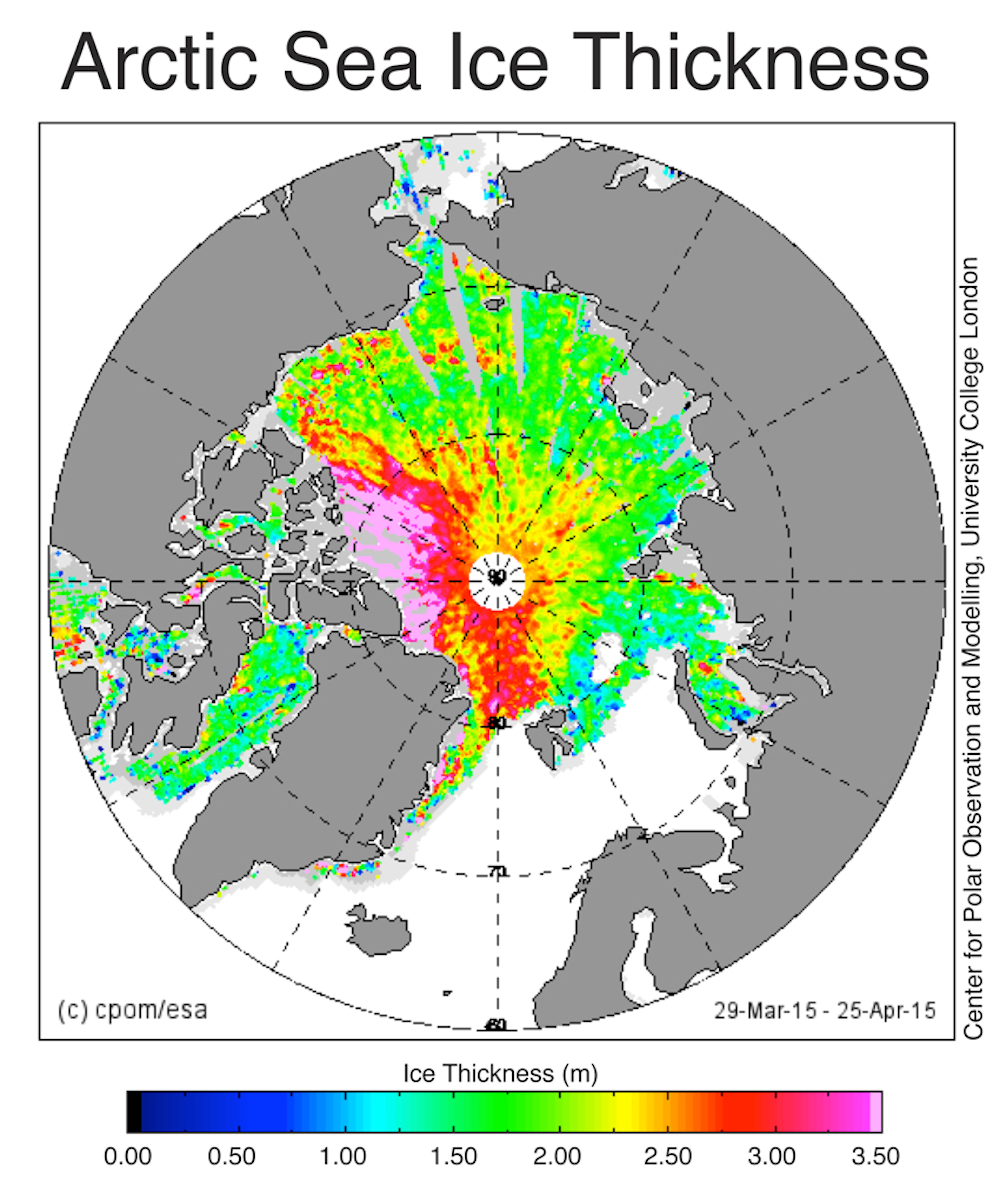
NERC Center for Polar Observation and Modelling, CC BY-SA

One problem with predicting when this might occur is that sea ice is notoriously difficult to model because it is influenced by both atmospheric and oceanic circulation as well as the flow of heat between these two parts of the climate system. That means that the climate models – powerful computer programs used to simulate the environment – need to get all of these components right to be able to accurately predict changes in sea ice extent.

Melting faster than models predicted

Back in the 2000s, an assessment of early generations of climate models found they generally underpredicted the loss of sea ice when compared to satellite data showing what actually happened. The models predicted a loss of about 2.5% per decade, while the observations were closer to 8%.

The next generation of models did better but were still not matching observations which, at that time were suggesting a blue ocean event would happen by mid-century. Indeed, the latest IPCC climate science report, published in 2021, reaches a similar conclusion about the timing of an ice-free Arctic Ocean.

As a consequence of the problems with the climate models, some scientists have attempted to extrapolate the observational record resulting in the controversial and, ultimately, incorrect assertion that this would happen during the mid 2010s. This did not help the credibility of the scientific community and its ability to make reliable projections.

Ice-free by 2030?

The scientists behind the latest study have taken a different approach by, in effect, calibrating the models with the observations and then using this calibrated solution to project sea ice decline. This makes a lot of sense, because it reduces the effect of small biases in the climate models that can in turn bias the sea ice projections. They call these “observationally constrained” projections and find that the Arctic could become ice-free in summer as early as 2030, even if we do a good job of reducing emissions between now and then.

Walruses on ice floe
Walruses depend on sea ice. As it melts, they’re being forced onto land.
outdoorsman / shutterstock

There is still plenty of uncertainty around the exact date – about 20 years or so – because of natural chaotic fluctuations in the climate system. But compared to previous research, the new study still brings forward the most likely timing of a blue ocean event by about a decade.

Why this matters

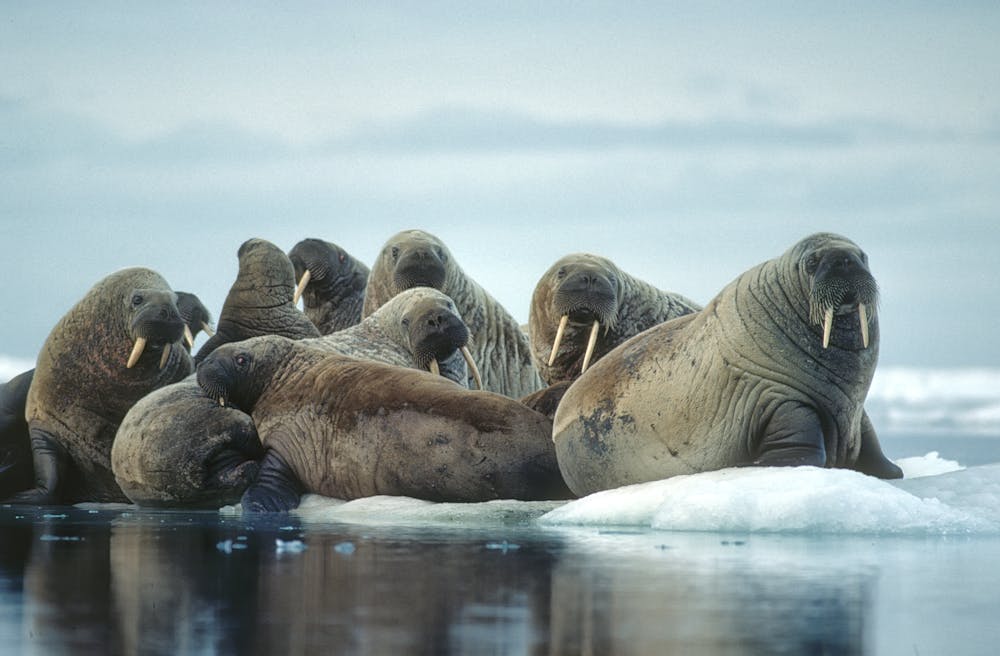
You might be asking the question: so what? Other than some polar bears not being able to hunt in the same way, why does it matter? Perhaps there are even benefits as the previous US secretary of state, Mike Pompeo, once declared – it means ships from Asia can potentially save around 3,000 miles of journey to European ports in summer at least.

But Arctic sea ice is an important component of the climate system. As it dramatically reduces the amount of sunlight absorbed by the ocean, removing this ice is predicted to further accelerate warming, through a process known as a positive feedback. This, in turn, will make the Greenland ice sheet melt faster, which is already a major contributor to sea level rise.

The loss of sea ice in summer would also mean changes in atmospheric circulation and storm tracks, and fundamental shifts in ocean biological activity. These are just some of the highly undesirable consequences and it is fair to say that the disadvantages will far outweigh the slender benefits.


This blog is written by Cabot Institute for the Environment member Jonathan Bamber, Professor of Physical Geography, University of Bristol. This article is republished from The Conversation under a Creative Commons license. Read the original article.

Jonathan Bamber
Jonathan Bamber

Good Mooring!

Since the late 1990s, scientists at the Norwegian Polar Institute (NPI) have conducted annual cruises across the Fram Strait: the widest, deepest and most important exit point for sea ice in the Arctic. One of the main aims of the Fram Strait cruise (FS2015) is to recover, service and redeploy a sprinkling of oceanographic moorings- current profiling instruments and buoys tethered to hundreds of meters of cable, anchored to the seafloor. These have been continuously measuring the velocities of water masses within the East Greenland Current at preset depths. With continuous data over decadal timescales, the NPI are hoping to understand how the nature of the Arctic freshwater budget changes in an increasingly warming climate, how this will impact biological processes, and how it will affect other water masses on a broader scale as they interact in new ways.

1 of 6 oceanographic moorings being recovered for
servicing on FS2015.  Image credit: Laura de Steur /
Norwegian Polar Institute

I was lucky enough to lend a helping hand this September; my second cruise with the NPI after having had a blast working on the Norwegian Young Sea ICE 2015 (N-ICE2015) cruise for a month back in April 2015. After flying into Longyearbyen, Svalbard, and seeing the Research Vessel Lance waiting in the harbour for a second time, it felt very odd not seeing the ship surrounded by 1.3m thick pack-ice, which is how I’d left it after N-ICE2015. It wasn’t until I dropped my bag off in my cosy cabin and heard the familiar roar of the engines warming up (and having my room located right at the back of the ship I really mean roar…) that it felt like I was returning to my home away from home.

The mooring aspect of the cruise this time introduced a different dimension of risks that had to be accommodated: namely by the presence of sea ice above many of the moorings that needed to be recovered. This gave us an occupational risk that obviously only presents itself at the poles! On the N-ICE2015 cruise the engine didn’t have a huge part to play as we were passively drifting with the Arctic pack ice. This time round, whilst navigating the ice floes across Fram Strait towards Eastern Greenland, the Lance was actively smashing through and breaking up the ice above mooring sites to ensure that the mooring returned to the surface without being blocked on its ascent. As ice coverage can alter rapidly, it’s up to chance whether or not these moorings will be readily accessible. In the best case, there will be little to no coverage, so one only has to send a command to the mooring via radio signaling and the cable is released and brought to the surface- buoys and instruments attached. In a moderate case, ice will be extensive enough that the ship will have to meander round, breaking up the ice floes as best it can. For this reason underlying current speed and ascent rate of the mooring has to be considered carefully. It’s always a tense minute or two waiting for the buoys and expensive instrumentation to reach the surface, knowing it may never arrive if it gets stuck on an unfortunately located ice floe! In the worst case, the floes will be so thick and expansive that the mooring recovery process may have to be abandoned all together. For this reason, daily satellite images of ice extent were a very valuable necessity.

As well as observing the physical properties of the Atlantic and Polar Waters spilling southward into the Atlantic, extensive tracer sampling took place at and around the mooring locations by way of collecting water at standard depths. While it is common practice for oceanographers to measure parameters like salinity soon after the water is collected (the on-board salinometer quickly became a very close friend of mine, with 528 samples needing to be analysed during the cruise!) other tracers such as coloured dissolved organic matter (CDOM), nutrients, and 18Oxygen isotope will be analysed ashore. These tracers can tell us something about the source of this water, and by looking at its isotopic composition whether it comes from melted sea ice or from other meteoric sources- that is, water derived from precipitation and runoff. Precipitated water at high latitudes is strongly depleted in 18O, while sea ice meltwater is slightly enriched in it. By looking at the mass of ice loss in the Arctic and how much of it is flowing through the Fram Strait year after year, we’re able to gauge how much is entering the Atlantic or staying in the Arctic basin [1].

The thickness of the ice flowing through Fram Strait has decreased by about 1/3 since 1990 [2]. Part of this melting is related to inflowing, relatively warm Atlantic waters travelling northwards via the West Spitsbergen Current. However, the amount of melt-water that is exported through Fram Strait hasn’t changed very significantly in the past decade. Evidence suggests that the melt water is being stored in the Beaufort gyre- a clockwise-rotating mass of water in the Arctic [3]. While the flux of melt-water into the Arctic Basin has increased in the past couple of decades, tracer analyses tell us the main mechanisms by which fresh water is supplied is by runoff from North American and Eurasian rivers, and by relatively fresh Pacific inflow through the Bering Strait, between Russia and Alaska [1].

The large-scale circulation around the Arctic Ocean.
Figure: Paul Dodd / Norwegian Polar Institute.

It is possible that with inter-annual changes in Arctic wind forcing this growing reservoir of cold, fresh water could be directed southwards across Fram Strait, where it could disrupt the thermohaline circulation of the Atlantic.

Routine sea ice stations were also carried out on suitable ice floes, giving us the chance to stretch our legs and take some ice cores for further tracer sampling. Once analysed, these will allow us to see how the chemical compositions compare with that of the underlying waters. Working 6-hours on, 6-hours off could get pretty exhausting, so it was nice to unwind with the occasional sled race across the floe or by sharpening our ‘selfie skills’ to let the world of social media know how our research was going. All in the name of science…
The FS2015 team and I (centre), exploring an ice floe.
———————————————
This blog is by Adam Cooper, Earth Sciences graduate at the University of Bristol.

Floes, leads and CTD’s: The state of the ice at 83°

The air at 82° 23’ North is crisp and still, and the afternoon sun blazes down on the ice floe we hope to call home for the next three months. The gentle hum of the Research Vessel (R/V) Lance’s engine some 300 metres away, and the regular click of the winch deploying our oceanographic profilers below the ice sheet, breaks the all-consuming silence in this seemingly barren wilderness. A walkie-talkie crackles into life from my pocket; a message from the ship! Norwegian isn’t my strong point, but one word in particular causes my ears to prick up in concern: ‘Isbjørn’, or, ‘Polar Bear’. For those aboard the Lance, this is a prime opportunity to grab a camera and be the envy of all their friends back home. For those of us ambling about on the ice, away from the cosy confines of our floating laboratory, pulses quicken as we try to withdraw our equipment without compromising the all-important data…

Constructing hole for on-ice CTD (Image
credit: Torbjørn Taskjelle, UiB)

The Norwegian Young Sea Ice Cruise (N-ICE2015) is a truly international effort, with researchers from over a dozen institutions coming together to gather data from the Arctic ice cap, as well as the surrounding atmospheric and oceanic currents. Initiated by the Norwegian Polar Institute, the R/V Lance plans to drift with the sea ice for six months, from January to June 2015. After a brief hiatus in Svalbard to change crew in March, I was able to join the ship as it steamed back into the ice, where it would get ‘refrozen’ for the remainder of the expedition.

It was never going to be plain sailing from Longyearbyen to our target latitude of 83° North. Battling against the wind, snow and pack ice in increasingly treacherous conditions had left those seeking warmer climes to put the ship’s impressive DVD collection to good use! That being said, efforts to measure this dynamic polar wilderness were already being undertaken from the offset.

Atmospheric scientists have been releasing weather balloons twice per day to profile the troposphere and stratosphere. Biologists collected water samples as we skimmed over the continental shelf off Svalbard, in order to divulge information on the bloom of primary producers found in shallower waters at this time of year. I managed to get better acquainted with my new friend for the month: the Conductivity-Temperature-Depth instrument, or CTD, which is deployed through the water to measure parameters such as salinity and temperature. With this information we can look at the width and depth of contrasting water masses, allowing us to track their progress at specific points.

As a member of the physical oceanography work package, I’m interested in how warm, salty Atlantic water, formed in the tropics off the eastern United States, travels north into the Arctic basin, and how its heat is distributed in the colder Arctic waters. By measuring the turbulence and temperature flux of this relatively shallow ‘tongue’ of Atlantic water (approximately 200m deep), I hope to glean information regarding how this may affect the melting of overlying sea ice.

Currently, the oceanographic models we have for the Arctic concern multi-year ice: that is, perennial ice that is built upon year after year. Now that this is being replaced by seasonal, or first-year ice, which is chemically and physically distinct to the longer-lived variety, the existing models are due for renewal. This cruise is particularly exciting, as data throughout the winter months are rare. Seeing how water masses affect, and respond to, a new first-year ice regime over this 6 month timescale is of paramount importance for the synthesis of more up-to-date heat exchange models.

Polar
bear inspecting our (thoroughly displaced!) survey line.
(Image credit: Markus
Kayser, AWI)

Working directly on the sea ice comes with its challenges. The Lance has been drifting in a predominantly southwestern direction towards Fram Strait, between Greenland and Svalbard where the majority of wind and ocean currents leave the Arctic. Accompanied by increasing temperatures, ice floe disintegration is a very real occupational hazard. It is a relief to gaze out the window every morning and see our little world still intact, though occasional cracks (or ‘leads’) through the ice threaten to tear our playground apart in a matter of minutes. Hundreds of metres of power cable have had to be hauled back onto the boat on more than one occasion, over where cracks spread, revealing the inky blue abyss of the ocean below.

Then we have the bears. Curious onlookers for the most part, we’ve managed to avoid any potential run-ins unscathed, thanks to our compulsory bear-guard system (pray that this continues!). Not all our equipment has been so lucky, with chewed cables and scuffed buoys occasionally appearing overnight. Though, with a chance to see these bumbling giants in their rapidly diminishing habitat, I’d still have jumped at the chance to work on the Lance even if it was as the dishwasher!

—————————————
This blog is written by Adam Cooper, recent Earth Sciences graduate at the University of Bristol.
Adam Cooper (right)

More information

A N-ICE trip to the North Pole: Understanding the link between sea ice and climate

Imagine. It’s the bitter Arctic winter, it’s dark, cold enough to kill, and your ship is stuck in sea-ice.  There’s nothing you can do against the heave of the ice, except let your ship drift along. Out of your control. This seems like a difficult prospect today, but then imagine it happening over a century ago.

This is exactly what did happen when Norwegian explorer, Fridtjof Nansen, intentionally trapped his ship, Fram, in Arctic sea-ice in 1893 in an attempt to reach the North Pole. For about three years, Fram drifted with the ice until finally reaching the North Atlantic. Whilst a main motivation for their extraordinary journey was to find the Pole, they also made a number of scientific observations that had a profound influence on the (at the time) young discipline of oceanography.

Scientists led by the Norwegian Polar Institute (NPI) are now – pretty much on the 120th anniversary of the original expedition – repeating the journey, this time purely in the name of science.  I’m a member of the international team, meaning that the University of Bristol gets to play its part.

View from near the Norwegian Polar Institute, Tromsø, at about
2.30pm in the afternoon! Tromsø is on a small island,
surrounded by beautiful mountains, but has very long, dark winters.

The group I’m working with are investigating the role of newly formed sea-ice and freshwater on the flow of heat and nutrients through Arctic oceans, which plays a key role in regulating climate both locally and on a global scale.  The sea-ice in the Arctic is diminishing at an alarming rate, with between 9.4 and 13.6% decline per decade in the perennial sea-ice from 1979 to 2012 according to the last Intergovernmental Panel on Climate Change report [1]. If we are to understand how the sea-ice might change in the future, and what impact this might have on other systems, we have to be able to understand the physics of the system today.

My role is to help to chemically analyse the seawater, in order to trace the freshwater input to the oceans.  The amount of freshwater will determine the density of the water, and so will control the degree of stratification or sinking, which will be important for the transport of heat.

In November, I went to visit the Norwegian Polar Institute in Tromsø in the very north of Norway for a pre-cruise workshop.  I got to meet a number of the Norwegian Young Sea-Ice (N-ICE2015) team, and visit Norway – a place I’d never been before as Antarctica is my usual stomping ground! We had two days of learning about the scientific interests of all the group members, and finding our way around some of the high-tech instrumentation that we will have at our disposal. I also got a tour of the ship that N-ICE2015 will use: the R/V Lance. By the end, everyone was keen to set off – although everyone will now have to wait until January…

This blog is written by Cabot Institute member Kate Hendry, Earth Sciences, University of Bristol.

Further information

You can find out more about N-ICE2015 at the project website.

[1] Climate Change 2013: The Physical Science Basis. Working Group 1 Contribution to the Fifth Assessment Report of the Intergovernmental Panel on Climate Change, 2013.