Towards urban climate resilience: learning from Lusaka


“This is a long shot!”

These were the words used by Richard Jones (Science Fellow, Met Office) in August 2021 when he asked if I would consider leading a NERC proposal for a rapid six-month collaborative international research and scoping project, aligned to the COP26 Adaptation and Resilience theme. The deadline was incredibly tight but the opportunity was too good to pass up – we set to work!

Background to Lusaka and FRACTAL

Zambia’s capital city, Lusaka, is one of Africa’s fastest growing cities, with around 100,000 people in the early 1960s to more than 3 million people today. 70% of residents live in informal settlements and some areas are highly prone to flooding due to the low topography and highly permeable limestone sitting on impermeable bedrock, which gets easily saturated. When coupled with poor drainage and ineffective waste management, heavy rainfall events during the wet season (November to March) can lead to severe localised flooding impacting communities and creating serious health risks, such as cholera outbreaks. Evidence from climate change studies shows that heavy rainfall events are, in general, projected to increase in intensity over the coming decades (IPCC AR6, Libanda and Ngonga 2018). Addressing flood resilience in Lusaka is therefore a priority for communities and city authorities, and it became the focus of our proposal.

Lusaka was a focal city in the Future Resilience for African CiTies and Lands (FRACTAL) project funded jointly by NERC and DFID from 2015 to 2021. Led by the Climate System Analysis Group (CSAG) at the University of Cape Town, FRACTAL helped to improve scientific knowledge about regional climate in southern Africa and advance innovative engagement processes amongst researchers, practitioners, decision-makers and communities, to enhance the resilience of southern African cities in a changing climate. I was lucky enough to contribute to FRACTAL, exploring new approaches to climate data analysis (Daron et al., 2019) and climate risk communication (Jack et al., 2020), as well as taking part in engagements in Maputo, Mozambique – another focal city. At the end of FRACTAL there was a strong desire amongst partners to sustain relationships and continue collaborative research.

I joined the University of Bristol in April 2021 with a joint position through the Met Office Academic Partnership (MOAP). Motivated by the potential to grow my network, work across disciplines, and engage with experts at Bristol in climate impacts and risk research, I was excited about the opportunities ahead. So when Richard alerted me to the NERC call, it felt like an amazing opportunity to continue the work of FRACTAL and bring colleagues at the University of Bristol into the “FRACTAL family” – an affectionate term we use for the research team, which really has become a family from many years of working together.

Advancing understanding of flood risk through participatory processes

Working closely with colleagues at Bristol, University of Zambia, University of Cape Town, Stockholm Environment Institute (SEI – Oxford), Red Cross Climate Centre, and the Met Office, we honed a concept building on an idea from Chris Jack at CSAG to take a “deep dive” into the issues of flooding in Lusaka – an issue only partly explored in FRACTAL. Having already established effective relationships amongst those involved, and with high levels of trust and buy-in from key institutions in Lusaka (e.g., Lusaka City Council, Lusaka Water Security Initiative – LuWSI), it was far easier to work together and co-design the project; indeed the project conceived wouldn’t have been possible if starting from scratch. Our aim was to advance understanding of flood risk and solutions from different perspectives, and co-explore climate resilient development pathways that address the complex issue of flood risk in Lusaka, particularly in George and Kanyama compounds (informal settlements). The proposal centred on the use of participatory processes that enable different communities (researchers, local residents, city decision makers) to share and interrogate different types of knowledge, from scientific model datasets to lived experiences of flooding in vulnerable communities.

The proposal was well received and the FRACTAL-PLUS project started in October 2021, shortly before COP26; PLUS conveys how the project built upon FRACTAL but also stands for “Participatory climate information distillation for urban flood resilience in LUSaka”. The central concept of climate information distillation refers to the process of extracting meaning from multiple sources of information, through careful and open consideration of the assumptions, strengths and limitations in constructing the information.

The “Learning Lab” approach

Following an initial evidence gathering and dialogue phase at the end of 2021, we conducted two collaborative “Learning Labs” held in Lusaka in January and March 2022. Due to Covid-19, the first Learning Lab was held as a hybrid event on 26-27 January 2022. It was facilitated by the University of Zambia team with 20 in-person attendees including city stakeholders, the local project team and Richard Jones who was able to travel at short notice. The remainder of the project team joined via Zoom. Using interactive exercises, games (a great way to promote trust and exchange of ideas), presentations, and discussions on key challenges, the Lab helped unite participants to work together. I was amazed at the way participants threw themselves into the activities with such enthusiasm – in my experience, this kind of thing never happens when first engaging with people from different institutions and backgrounds. Yet because trust and relationships were already established, there was no apparent barrier to the engagement and dialogue. The Lab helped to further articulate the complexities of addressing flood risks in the city, and showed that past efforts – including expensive infrastructure investments – had done little to reduce the risks faced by many residents.

One of the highlights of the Labs, and the project overall, was the involvement of cartoon artist Bethuel Mangena, who developed a number of cartoons to support the process and extract meaning (in effect, distilling) the complicated and sensitive issues being discussed. The cartoon below was used to illustrate the purpose of the Lab, as a meeting place for ideas and conversations drawing on different sources of information (e.g., climate data, city plans and policies) and experiences of people from flood-affected communities. All of the cartoons generated in the project, including the feature image for this blog, are available in a Flickr cartoon gallery – well worth a look!

Image: Cartoon highlighting role of Learning Labs in FRACTAL-PLUS by Bethuel Mangena

Integrating scientific and experiential knowledge of flood risk

In addition to the Labs, desk-based work was completed to support the aims of the project. This included work by colleagues in Geographical Sciences at Bristol, Tom O’Shea and Jeff Neal, to generate high-resolution flood maps for Lusaka based on historic rainfall information and for future climate scenarios. In addition, Mary Zhang, now at the University of Oxford but in the School of Policy Studies at Bristol during the project, collaborated with colleagues at SEI-Oxford and the University of Zambia to design and conduct online and in-person surveys and interviews to elicit the lived experiences of flooding from residents in George and Kanyama, as well as experiences of those managing flood risks in the city authorities. This work resulted in new information and knowledge, such as the relative perceived roles of climate change and flood management approaches in the levels of risk faced, that was further interrogated in the second Learning Lab.

Thanks to a reduction in covid risk, the second lab was able to take place entirely in person. Sadly I was unable to travel to Lusaka for the Lab, but the decision to remove the virtual element and focus on in-person interactions helped further promote active engagement amongst city decision-makers, researchers and other participants, and ultimately better achieve the goals of the Lab. Indeed the project helped us learn the limits of hybrid events. Whilst I remain a big advocate for remote technology, the project showed it can be far more productive to have solely in-person events where everyone is truly present.

The second Lab took place at the end of March 2022. In addition to Lusaka participants and members of the project team, we were also joined by the Mayor of Lusaka, Ms. Chilando Chitangala. As well as demonstrating how trusted and respected our partners in Lusaka are, the attendance of the mayor showed the commitment of the city government to addressing climate risks in Lusaka. We were extremely grateful for her time engaging in the discussions and sharing her perspectives.

During the lab the team focused on interrogating all of the evidence available, including the new understanding gained through the project from surveys, interviews, climate and flood data analysis, towards collaboratively mapping climate resilient development pathways for the city. The richness and openness in the discussions allowed progress to be made, though it remains clear that addressing flood risk in informal settlements in Lusaka is an incredibly challenging endeavour.

Photo: Participants at March 2022 Learning Lab in Lusaka

What did we achieve?

The main outcomes from the project include:

  1. Enabling co-exploration of knowledge and information to guide city officials (including the mayor – see quote below) in developing Lusaka’s new integrated development plan.
  2. Demonstrating that flooding will be an ongoing issue even if current drainage plans are implemented, with projections of more intense rainfall over the 21st century pointing to the need for more holistic, long-term and potentially radical solutions.
  3. A plan to integrate flood modelling outputs into the Lusaka Water Security Initiative (LuWSI) digital flood atlas for Lusaka.
  4. Sustaining relationships between FRACTAL partners and building new links with researchers at Bristol to enable future collaborations, including input to a new proposal in development for a multi-year follow-on to FRACTAL.
  5. A range of outputs, including contributing to a FRACTAL “principles” paper (McClure et al., 2022) supporting future participatory projects.

It has been such a privilege to lead the FRACTAL-PLUS project. I’m extremely grateful to the FRACTAL family for trusting me to lead the project, and for the input from colleagues at Bristol – Jeff Neal, Tom O’Shea, Rachel James, Mary Zhang, and especially Lauren Brown who expertly managed the project and guided me throughout.

I really hope I can visit Lusaka in the future. The city has a special place in my heart, even if I have only been there via Zoom!

“FRACTAL-PLUS has done well to zero in on the issue of urban floods and how climate change pressures are making it worse. The people of Lusaka have continually experienced floods in various parts of the city. While the problem is widespread, the most affected people remain to be those in informal settlements such as George and Kanyama where climate change challenges interact with poor infrastructure, poor quality housing and poorly managed solid waste.” Mayor Ms. Chilando Chitangala, 29 March 2022

————————————————————————————-

This blog is written by Dr Joe Daron, Senior Research Fellow, Faculty of Science, University of Bristol;
Science Manager, International Climate Services, Met Office; and Cabot Institute for the Environment member.
Find out more about Joe’s research at https://research-information.bris.ac.uk/en/persons/joe-daron.


Hydrological modelling and pizza making: why doesn’t mine look like the one in the picture?

Is this a question that you have asked yourself after following a recipe, for instance, to make pizza?

You have used the same ingredients and followed all the steps and still the result doesn’t look like the one in the picture…

Don’t worry: you are not alone! This is a common issue, and not only in cooking, but also in hydrological sciences, and in particular in hydrological modelling.

Most hydrological modelling studies are difficult to reproduce, even if one has access to the code and the data (Hutton et al., 2016). But why is this?

In this blog post, we will try to answer this question by using an analogy with pizza making.

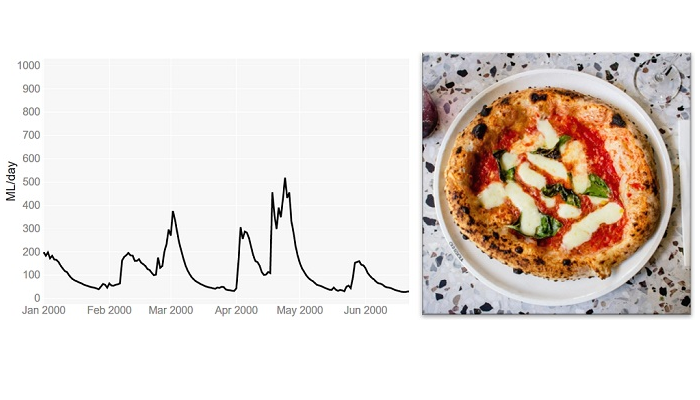
Let’s imagine that we have a recipe together with all the ingredients to make pizza. Our aim is to make a pizza that looks like the one in the picture of the recipe.

This is a bit like someone wanting to reproduce the results reported in a scientific paper about a hydrological “rainfall-runoff” model. There, one would need to download the historical data (rainfall, temperature and river flows) and the model code used by the authors of the study.

However, in the same way as the recipe and the ingredients are just the start of the pizza making process, having the input data and the model code is only the start of the modelling process.

To get the pizza shown in the picture of the recipe, we first need to work the ingredients, i.e. knead the dough, proof and bake. And to get the simulated river flows shown in the study, we need to ‘work’ the data and the model code, i.e. do the model calibration, evaluation and final simulation.

Using the pizza making analogy, these are the correspondences between pizza making and hydrological modelling:

Pizza making                         Hydrological modelling

kitchen and cooking tools computer and software

ingredients                         historical data and computer code for model simulation

recipe                                 modelling process as described in a scientific paper or in a computer                                                         script / workflow

Step 1: Putting the ingredients together

Dough kneading

So, let’s start making the pizza. According to the recipe, we need to mix well the ingredients to get a dough and then we need to knead it. Kneading basically consists of pushing and stretching the dough many times and it can be done either manually or automatically (using a stand mixer).

The purpose of kneading is to develop the gluten proteins that create the structure and strength in the dough, and that allow for the trapping of gases and the rising of the dough.The recipe recommends using a stand mixer for the kneading, however if we don’t have one, we can do it manually.

The recipe says to knead until the dough is elastic and looks silky and soft. We then knead the dough until it looks like the one in the photo shown in the recipe.

Model calibration

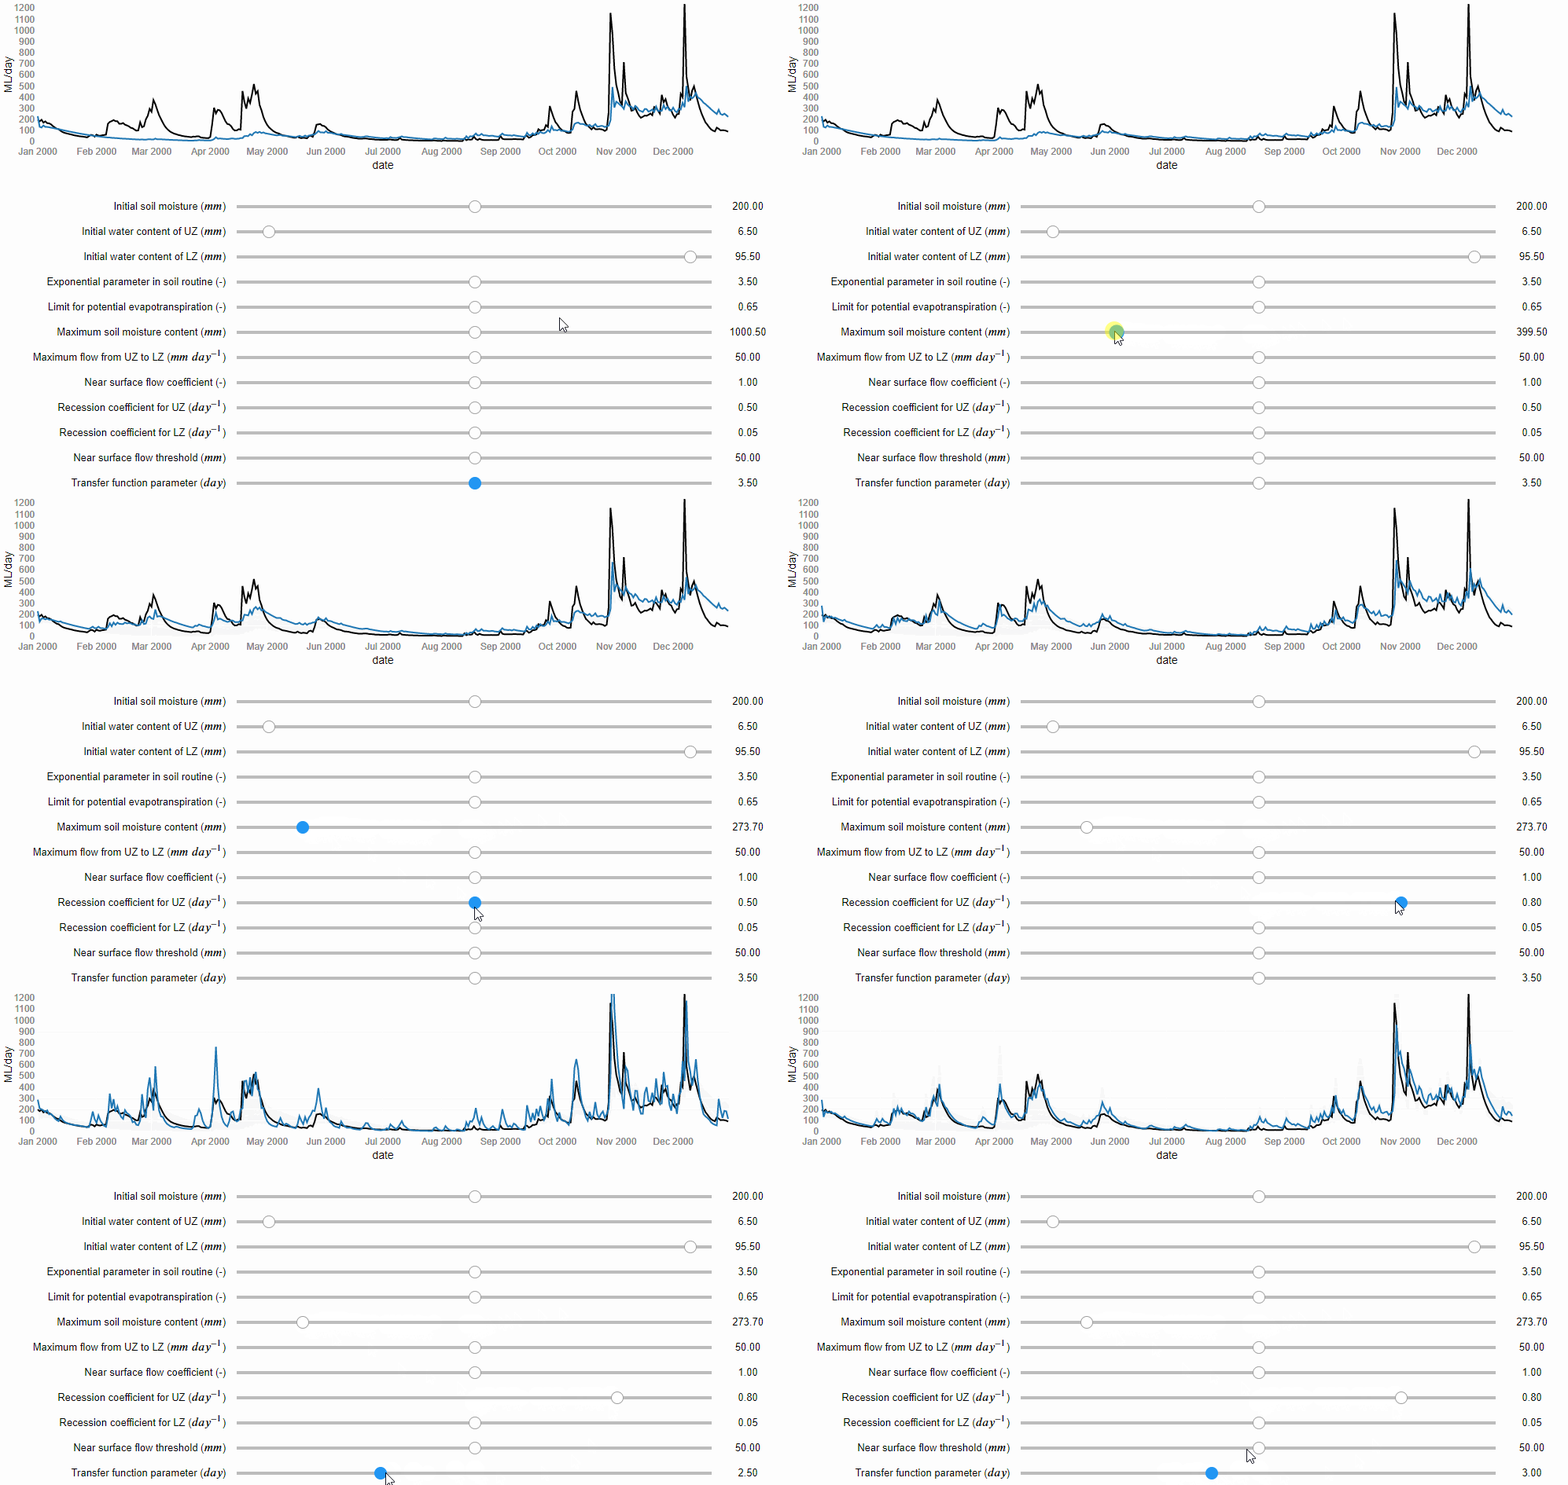
Now, let’s start the modelling process. If the paper does not report the values of the model parameters, we can determine them through model calibration. Model calibration is a mathematical process that aims to tailor a general hydrological model to a particular basin. It involves running the model many times under different combinations of the parameter values, until one is found that matches well the flow records available for that basin. Similarly to kneading, model calibration can be manual, i.e. the modeller changes manually the values of the model parameters trying to find a combination that captures the patterns in the observed flows (Figure 1), or it can be automatic, i.e. a computer algorithm is used to search for the best combination of parameter values more quickly and comprehensively.

Figure 1 Manual model calibration. The river flows predicted by the model are represented by the blue line and the observed river flows by the black line (source: iRONS toolbox)

According to the study, the authors used an algorithm implemented in an open source software for the calibration. We can download and use the same software. However, if any error occurs and we cannot install it, we could decide to calibrate the model manually. According to the study, the Nash-Sutcliffe efficiency (NSE) function was used as numerical criteria to evaluate the calibration obtaining a value of 0.82 out of 1. We then do the manual calibration until we obtain NSE = 0.82.

(source: iRONS toolbox)

Step 2: Checking our work

Dough proofing

In pizza making, this step is called proofing or fermentation. In this stage, we place the dough somewhere warm, for example close to a heater, and let it rise. According to the recipe, the proofing will end after 3 hours or when the dough has doubled its volume.

The volume is important because it gives us an idea of how strong the dough is and how active the yeast is, and hence if the dough is ready for baking. We let our dough rise for 3 hours and we check. We find out that actually it has almost tripled in size… “even better!” we think.

Model evaluation

In hydrological modelling, this stage consists of running the model using the parameter values obtained by the calibration but now under a different set of temperature and rainfall records. If the differences between estimated and observed flows are still low, then our calibrated model is able to predict river flows under meteorological conditions different from the one to which it was calibrated. This makes us more confident that it will work well also under future meteorological conditions. According to the study, the evaluation gave a NSE = 0.78. We then run our calibrated model fed by the evaluation data and we get a NSE = 0.80… “even better!” we think.

Step 3: Delivering the product!

Pizza baking

Finally, we are ready to shape the dough, add the toppings and bake our pizza. According to the recipe, we should shape the dough into a round and thin pie. This takes some time as our dough keeps breaking when stretched, but we finally manage to make it into a kind of rounded shape. We then add the toppings and bake our pizza.

Ten minutes later we take the pizza out of the oven and… it looks completely different from the one in the picture of the recipe! … but at least it looks like a pizza…

(Source: flickr.com)

River flow simulation

And finally, after calibrating and evaluating our model, we are ready to use it to simulate recreate the same river flow predictions as shown in the results of the paper. In that study, they forced the model with seasonal forecasts of rainfall and temperature that are available from the website of the European Centre for Medium-range Weather Forecasts (ECMWF).

Downloading the forecasts takes some time because we need to write two scripts, one to download the data and one to pre-process them to be suitable for our basin (so called “bias correction”). After a few hours we are ready to run the simulation and… it looks completely different from the hydrograph shown in the study! … but at least it looks like a hydrograph…

Why we never get the exact same result?

Here are some possible explanations for our inability to exactly reproduce pizzas or modelling results:

  • We may have not kneaded the dough enough or kneaded it too much; or we may have thought that the dough was ready when it wasn’t. Similarly, in modelling, we may have stopped the calibration process too early or too late (so called “over-fitting” of the data).
  • The recipe does not provide sufficient information on how to test the dough; for example, it does not say how wet or elastic the dough should be after kneading. Similarly, in modelling, a paper may not provide sufficient information about model testing as, for instance, the model performance for different variables and different metrics.
  • We don’t have the same cooking tools as those used by the recipe’s authors; for example, we don’t have the same brand of the stand mixer or the oven. Similarly, in modelling we may use a different hardware or operating system, which means calculations may differ due to different machine precision or slightly different versions of the same software tools/dependencies.
  • Small changes in the pizza making process, such as ingredients quantities, temperature and humidity, can lead to significant changes in the final result, particularly because some processes, such as kneading, are very sensitive to small changes in conditions. Similarly, small changes in the modelling process, such as in the model setup or pre-processing of the data, can lead to rather different results.

In conclusion…

Setting up a hydrological model involves the use of different software packages, which often exist in different versions, and requires many adjustments and choices to tailor the model to a specific place. So how do we achieve reproducibility in practice? Sharing code and data is essential, but often is not enough. Sufficient information should also be provided to understand what the model code does, and whether it does it correctly when used by others. This may sound like a big task, but the good news is that we have increasingly powerful tools to efficiently develop rich and interactive documentation. And some of these tools, such as R Markdown or Jupyter Notebooks, and the online platforms that support them such as Binder, enable us not only to share data and code but also the full computational environment in which results are produced – so that others have access not only to our recipes but can directly cook in our kitchen.

—————————

This blog has been reposted with kind permission from the authors, Cabot Institute for the Environment members Dr Andres Peñuela, Dr Valentina Noacco and Dr Francesca Pianosi. View the original post on the EGU blog site.

Andres Peñuela is a Research Associate in the Water and Environmental Engineering research group at the University of Bristol. His main research interest is the development and application of models and tools to improve our understanding on the hydrological and human-impacted processes affecting water resources and water systems and to support sustainable management and knowledge transfer


Valentina Noacco is a Senior Research Associate in the Water and Environmental Engineering research group at the University of Bristol. Her main research interest is the development of tools and workflows to transfer sensitivity analysis methods and knowledge to industrial practitioners. This knowledge transfer aims at improving the consideration of uncertainty in mathematical models used in industry


Francesca Pianosi is a Senior Lecturer in Water and Environmental Engineering at the University of Bristol. Her expertise is in the application of mathematical modelling to hydrology and water systems. Her current research mainly focuses on two areas: modelling and multi-objective optimisation of water resource systems, and uncertainty and sensitivity analysis of mathematical models.