Hydrological modelling and pizza making: why doesn’t mine look like the one in the picture?

Is this a question that you have asked yourself after following a recipe, for instance, to make pizza?

You have used the same ingredients and followed all the steps and still the result doesn’t look like the one in the picture…

Don’t worry: you are not alone! This is a common issue, and not only in cooking, but also in hydrological sciences, and in particular in hydrological modelling.

Most hydrological modelling studies are difficult to reproduce, even if one has access to the code and the data (Hutton et al., 2016). But why is this?

In this blog post, we will try to answer this question by using an analogy with pizza making.

Let’s imagine that we have a recipe together with all the ingredients to make pizza. Our aim is to make a pizza that looks like the one in the picture of the recipe.

This is a bit like someone wanting to reproduce the results reported in a scientific paper about a hydrological “rainfall-runoff” model. There, one would need to download the historical data (rainfall, temperature and river flows) and the model code used by the authors of the study.

However, in the same way as the recipe and the ingredients are just the start of the pizza making process, having the input data and the model code is only the start of the modelling process.

To get the pizza shown in the picture of the recipe, we first need to work the ingredients, i.e. knead the dough, proof and bake. And to get the simulated river flows shown in the study, we need to ‘work’ the data and the model code, i.e. do the model calibration, evaluation and final simulation.

Using the pizza making analogy, these are the correspondences between pizza making and hydrological modelling:

Pizza making                         Hydrological modelling

kitchen and cooking tools computer and software

ingredients                         historical data and computer code for model simulation

recipe                                 modelling process as described in a scientific paper or in a computer                                                         script / workflow

Step 1: Putting the ingredients together

Dough kneading

So, let’s start making the pizza. According to the recipe, we need to mix well the ingredients to get a dough and then we need to knead it. Kneading basically consists of pushing and stretching the dough many times and it can be done either manually or automatically (using a stand mixer).

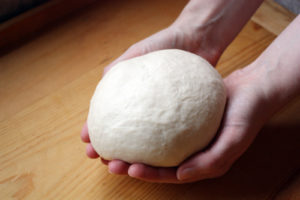
The purpose of kneading is to develop the gluten proteins that create the structure and strength in the dough, and that allow for the trapping of gases and the rising of the dough.The recipe recommends using a stand mixer for the kneading, however if we don’t have one, we can do it manually.

The recipe says to knead until the dough is elastic and looks silky and soft. We then knead the dough until it looks like the one in the photo shown in the recipe.

Model calibration

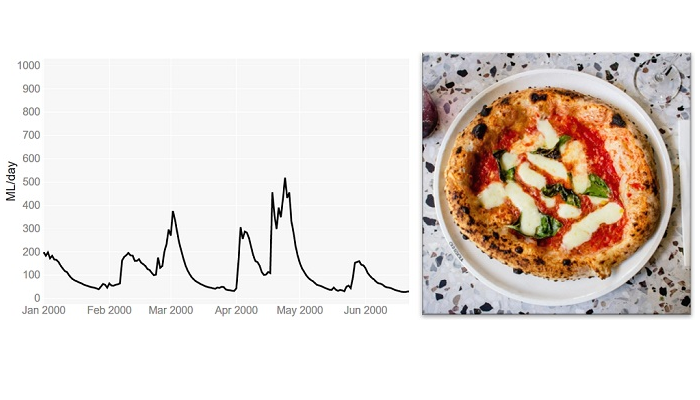
Now, let’s start the modelling process. If the paper does not report the values of the model parameters, we can determine them through model calibration. Model calibration is a mathematical process that aims to tailor a general hydrological model to a particular basin. It involves running the model many times under different combinations of the parameter values, until one is found that matches well the flow records available for that basin. Similarly to kneading, model calibration can be manual, i.e. the modeller changes manually the values of the model parameters trying to find a combination that captures the patterns in the observed flows (Figure 1), or it can be automatic, i.e. a computer algorithm is used to search for the best combination of parameter values more quickly and comprehensively.

Figure 1 Manual model calibration. The river flows predicted by the model are represented by the blue line and the observed river flows by the black line (source: iRONS toolbox)

According to the study, the authors used an algorithm implemented in an open source software for the calibration. We can download and use the same software. However, if any error occurs and we cannot install it, we could decide to calibrate the model manually. According to the study, the Nash-Sutcliffe efficiency (NSE) function was used as numerical criteria to evaluate the calibration obtaining a value of 0.82 out of 1. We then do the manual calibration until we obtain NSE = 0.82.

(source: iRONS toolbox)

Step 2: Checking our work

Dough proofing

In pizza making, this step is called proofing or fermentation. In this stage, we place the dough somewhere warm, for example close to a heater, and let it rise. According to the recipe, the proofing will end after 3 hours or when the dough has doubled its volume.

The volume is important because it gives us an idea of how strong the dough is and how active the yeast is, and hence if the dough is ready for baking. We let our dough rise for 3 hours and we check. We find out that actually it has almost tripled in size… “even better!” we think.

Model evaluation

In hydrological modelling, this stage consists of running the model using the parameter values obtained by the calibration but now under a different set of temperature and rainfall records. If the differences between estimated and observed flows are still low, then our calibrated model is able to predict river flows under meteorological conditions different from the one to which it was calibrated. This makes us more confident that it will work well also under future meteorological conditions. According to the study, the evaluation gave a NSE = 0.78. We then run our calibrated model fed by the evaluation data and we get a NSE = 0.80… “even better!” we think.

Step 3: Delivering the product!

Pizza baking

Finally, we are ready to shape the dough, add the toppings and bake our pizza. According to the recipe, we should shape the dough into a round and thin pie. This takes some time as our dough keeps breaking when stretched, but we finally manage to make it into a kind of rounded shape. We then add the toppings and bake our pizza.

Ten minutes later we take the pizza out of the oven and… it looks completely different from the one in the picture of the recipe! … but at least it looks like a pizza…

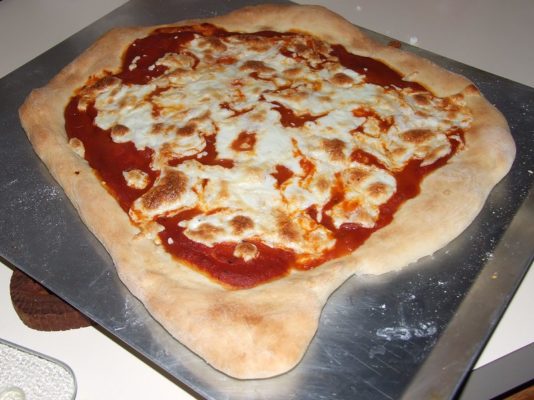
(Source: flickr.com)

River flow simulation

And finally, after calibrating and evaluating our model, we are ready to use it to simulate recreate the same river flow predictions as shown in the results of the paper. In that study, they forced the model with seasonal forecasts of rainfall and temperature that are available from the website of the European Centre for Medium-range Weather Forecasts (ECMWF).

Downloading the forecasts takes some time because we need to write two scripts, one to download the data and one to pre-process them to be suitable for our basin (so called “bias correction”). After a few hours we are ready to run the simulation and… it looks completely different from the hydrograph shown in the study! … but at least it looks like a hydrograph…

Why we never get the exact same result?

Here are some possible explanations for our inability to exactly reproduce pizzas or modelling results:

  • We may have not kneaded the dough enough or kneaded it too much; or we may have thought that the dough was ready when it wasn’t. Similarly, in modelling, we may have stopped the calibration process too early or too late (so called “over-fitting” of the data).
  • The recipe does not provide sufficient information on how to test the dough; for example, it does not say how wet or elastic the dough should be after kneading. Similarly, in modelling, a paper may not provide sufficient information about model testing as, for instance, the model performance for different variables and different metrics.
  • We don’t have the same cooking tools as those used by the recipe’s authors; for example, we don’t have the same brand of the stand mixer or the oven. Similarly, in modelling we may use a different hardware or operating system, which means calculations may differ due to different machine precision or slightly different versions of the same software tools/dependencies.
  • Small changes in the pizza making process, such as ingredients quantities, temperature and humidity, can lead to significant changes in the final result, particularly because some processes, such as kneading, are very sensitive to small changes in conditions. Similarly, small changes in the modelling process, such as in the model setup or pre-processing of the data, can lead to rather different results.

In conclusion…

Setting up a hydrological model involves the use of different software packages, which often exist in different versions, and requires many adjustments and choices to tailor the model to a specific place. So how do we achieve reproducibility in practice? Sharing code and data is essential, but often is not enough. Sufficient information should also be provided to understand what the model code does, and whether it does it correctly when used by others. This may sound like a big task, but the good news is that we have increasingly powerful tools to efficiently develop rich and interactive documentation. And some of these tools, such as R Markdown or Jupyter Notebooks, and the online platforms that support them such as Binder, enable us not only to share data and code but also the full computational environment in which results are produced – so that others have access not only to our recipes but can directly cook in our kitchen.

—————————

This blog has been reposted with kind permission from the authors, Cabot Institute for the Environment members Dr Andres Peñuela, Dr Valentina Noacco and Dr Francesca Pianosi. View the original post on the EGU blog site.

Andres Peñuela is a Research Associate in the Water and Environmental Engineering research group at the University of Bristol. His main research interest is the development and application of models and tools to improve our understanding on the hydrological and human-impacted processes affecting water resources and water systems and to support sustainable management and knowledge transfer


Valentina Noacco is a Senior Research Associate in the Water and Environmental Engineering research group at the University of Bristol. Her main research interest is the development of tools and workflows to transfer sensitivity analysis methods and knowledge to industrial practitioners. This knowledge transfer aims at improving the consideration of uncertainty in mathematical models used in industry


Francesca Pianosi is a Senior Lecturer in Water and Environmental Engineering at the University of Bristol. Her expertise is in the application of mathematical modelling to hydrology and water systems. Her current research mainly focuses on two areas: modelling and multi-objective optimisation of water resource systems, and uncertainty and sensitivity analysis of mathematical models.


Cooking with electricity in Nepal

PhD student Will Clements tells us how switching from cooking with biomass to cooking with electricity is saving time and saving lives in Nepal.

Sustainable Development Goal 7 calls for affordable reliable access to modern energy. However, around 3 billion people still use biomass for cooking. Smoky kitchens – indoor air pollution due to biomass cooking emissions – account for the premature deaths of around 4 million people every year. The burden of firewood collection almost always falls on women and girls, who must often travel long distances exposed to the risk of physical and sexual violence. The gravity of the problem is clear.

Wood stove in a household in Simli, a remote rural community in western Nepal. Credit: KAPEG/PEEDA

Electric cooking is a safe, clean alternative which reduces greenhouse gas emissions and frees up time so that women and girls can work, study and spend more time doing what they want.

In Nepal, many off-grid rural communities are powered by micro-hydropower (MHP) mini-grids, which are capable of providing electricity to hundreds or thousands of households, but often operate close to full capacity at peak times and are subject to brownouts and blackouts.

A project to investigate electric cooking in Nepali mini-grids was implemented in the summer of 2018 by a collaboration between Kathmandu Alternative Power and Energy Group (KAPEG), People Energy and Environment Development Association (PEEDA) and the University of Bristol in a rural village called Simli in Western Nepal. Data on what, when and how ten families cooked was recorded for a month, at first with their wood-burning stoves, and then with electric hobs after they had received training on how to use them.

A typical MHP plant in the remote village of Ektappa, Ilam in Nepal. Credit: Sam Williamson

When cooked with firewood, a typical meal of dal and rice required an average of 12 kWh of energy for five people, which is around the energy consumption of a typical kettle if used continuously for six hours! On the other hand, when cooked on the induction hobs this figure was just 0.5 kWh, around a third of the energy consumed when you have a hot shower for 10 minutes.

However, even at this high efficiency, there was insufficient spare power in the mini-grid for all the participants to cook at the same time, so they experienced power cuts which led to undercooked food and hungry families.

Many participants reverted to their wood stoves when the electricity supply failed them, and this with only ten of 450 households in the village trying to cook with electricity. The project highlighted the key challenge – how can hundreds of families cook with electricity on mini-grids with limited power?

In April 2019, the £39.8 million DFID funded Modern Energy Cooking Services (MECS) programme launched. The MECS Challenge Fund supported the Nepal and Bristol collaboration to investigate off-grid MHP cooking in Nepal further.

A study participant using a pressure cooker on an induction hob. Credit: KAPEG/PEEDA

A study participant using a pressure cooker on an induction hob. Credit: KAPEG/PEEDA
The project expands on the previous project by refining data collection methods to obtain high quality data on both Nepali cooking practices and MHP behaviour, understanding and assessing the potential and effect of electric cooking on Nepali MHP mini-grids, and using the collected data to investigate how batteries could be used to enable the cooking load to be averaged throughout the day so that many more families can cook with electricity on limited power grids.

MHP differs greatly from solar PV and wind power in that it produces constant power throughout the day and night, providing an unexplored prospect for electric cooking. Furthermore, this 24/7 nature of MHP means that there is a lot of unused energy generated during the night and off-peak periods which could be used for cooking, if it could be stored. Therefore, battery-powered cooking is at the forefront of this project.

Testing induction hobs in the MHP powerhouse. Credit: KAPEG/PEEDA

Collected data will be used to facilitate a design methodology for a battery electric cooking system for future projects, evaluating size, location and distribution of storage, as well as required changes to the mini-grid infrastructure.

Furthermore, a battery cooking laboratory is being set up in the PEEDA office in Kathmandu to investigate the technical challenges of cooking Nepali meals from batteries.

The baseline phase – where participants’ usual cooking is recorded for two weeks – is already complete and preparations for the transition phase are underway where electric stoves are given to participants and they are trained on how to cook with them.

We will be heading to Kathmandu to help with the preparations, and the team will shortly begin the next phase in Tari, Solukhumbu, Eastern Nepal.

The project will continue the journey towards enabling widespread adoption of electric cooking in Nepali MHP mini-grids, the wider Nepali national grid and grids of all sizes across the world.

————————————-
This blog is written by Will Clements and has been republished from the Faculty of Engineering blog. View the original blog. Will studied Engineering Design at Bristol University and, after volunteering with Balloon Ventures as part of the International Citizen Service, returned for a PhD with the Electrical Energy Management Research Group supervised by Caboteer Dr Sam Williamson. Will is working to enable widespread adoption of electric cooking in developing communities, focusing on mini-grids in Nepal.

The opinions expressed in this blog are those of the author and do not necessarily reflect the official policy or position of UKAid.

Will Clements


Micro Hydro manufacturing in Nepal: A visit to Nepal Yantra Shala Energy

Topaz Maitland with a micro hydro turbine

For nine months I am working at an NGO called People, Energy and Environment Development Association (PEEDA), in Kathmandu, Nepal. PEEDA is an NGO dedicated to improving the livelihoods of communities, particularly the poor, by collective utilization of renewable energy resources, while ensuring due care for the environment.

My primary project is the design of a micro hydro Turgo Turbine, a small turbine which is not commonly used in Nepal. The project aims to investigate this turbine, and its potential for us in Nepal.

Nepal Yantrashala Energy (NYSE) is one of the partners on this project. NYSE is a manufacturing company specialising in micro hydro systems and I went to visit their workshop to learn about how they operate.

Micro Hydro and NYSE

At NYSE, they manufacture Pelton, Crossflow and Propeller turbines. If a client comes to them with the required head (height over which the water will drop) and flow rate, NYSE can manufacture an appropriate turbine. Every turbine is unique to the site it will be installed into.

Rough cast of a  Pelton runner cup, alongside finished cups


A Pelton turbine runner


Crossflow runners are made using strips of pipe as blades and machined runner plates to hold the blades
A Crossflow turbine runner

The aim of this project is to develop a design for a Turgo turbine (an example turgo turbine system pictured below), so that NYSE might be able to manufacture one for any given head and flow. This means that engineers such as myself need to understand how our new optimised design will operate over a range of flows and heads.

Micro Hydro in Nepal

Nepal is second only to Brazil in term of hydropower potential (1). Despite this, crippling underdevelopment and a mixture of geographical, political and economical factors leave the country lacking the resources to exploit and develop this potential (1).

Dr. Suman Pradhan, Project Coordinator at NYSE, told us that the first ever Crossflow Turbine was installed in Nepal in 1961. His father was actually one of those involved in the project. Ironically, today Nepal has to import or buy the designs for such Crossflow turbines from abroad.

Universities in Nepal do have turbine testing facilities, but funding for PhDs and other hydropower research is still heavily dependent upon foreign investment. A key area of opportunity for Nepal is the development of such research facilities. With so much hydropower potential, good work could be done to improve the performance of hydropower to suit demand and manufacturers within Nepal.

Dr. Suman hopes that this new Turgo Turbine design, alongside other designs he is trying to obtain, may widen the hydropower options available and manufacturable in Nepal.

References

1) Sovacool, B. K., Dhakal, S., Gippner, O. & Bambawale, M. J., 2013. Peeling the Energy Pickle: Expert Perceptions on Overcoming Nepal’s Energy Crisis. South Asia: Journal of South Asian Studies.

———————
This blog was written by Topaz Maitland, a University of Bristol Engineering Design Student on 3rd year industry placement.

Challenges of generating solar power in the Atacama Desert

My name is Jack Atkinson-Willes and I am a recent graduate from the University of Bristol’s Engineering Design course. In 2016 I was given the unique opportunity to work in Chile with the renewable energy consultancy 350renewables on a Solar PV research project. In this blog I am going to discuss how this came about and share some of the experiences I have had since arriving!

First of all, how did this come about? Due to the uniquely flexible nature of the Engineering Design course I was able to develop my understanding of the renewable energy industry, a sector I had always had a keen interest in, by selecting modules that related to this topic and furthering this through industry work experience. In 2013, the university helped me secure a 12 month placement with Atkins Energy based near Filton, and while this largely centred around the nuclear industry it was an excellent introduction into how an engineering consultancy works and what goes into development of a utility-scale energy project.

In 2015 I built on this experience with a 3 month placement as a research assistant in Swansea University’s Marine Energy Research Group (MERG). I spent this time working on the EU-funded MARIBE project, which aimed to bring down the costs of emerging offshore industries (such as tidal and wave power) by combining them with established industries (such as shipping). This built on the experience I had gained through research projects I had done as part of my course at Bristol, and allowed me to familiarise myself further with renewable energy technology.

Keen to use my first years after graduation to learn other languages and travel, but also start building a career in renewables, I realised that the best way to combine the two was to start looking at countries overseas that had the greatest renewable energy potential. Given that I had just started taking an open unit in Spanish, Latin America was, naturally, the first place I looked; and I quickly found that I needn’t look much further! Latin American was the fastest growing region in the world for renewable energy in 2015, and this was during a year when global investment in renewables soared to record levels, adding an extra 147GW of capacity. (That’s more than double the UK demand!)

So, eager to find out more about the opportunities to work there, I discussed my interest with Dr. Paul Harper. He very kindly put me in touch with Patricia Darez, general manager of 350renewables, a renewable energy consultancy based in Santiago. As luck would have it, they were looking to expand their new business and take someone on for an upcoming research project. Given my previous experience in both an engineering consultancy and research projects I was fortunate enough to be offered a chance to join them out in Chile. Of course I jumped at the opportunity!


1 – Santiago, Chile (the smog in this photo being at an unusually low level)

Fast-forward by 8 months and I am tentatively stepping off the plane into a new country and a new life, eager to get started with my new job. Santiago was certainly a big change to Bristol, being about 10 times the size, but to wake up every day with the Andes mountains looming over the skyline was simply incredible. The greatest personal challenge by far has been learning Spanish, largely because the Chilean version of Spanish is the approximate equivalent to a thick Glaswegian accent in English. So for my (at best) GSCE level Spanish it was quite a while before I felt I could converse with any of the locals (and even now I spend almost all my time nodding and smiling politely whilst my mind tries to rapidly think of a response that would allow the conversation to continue without the other person realising I haven’t a clue what they’re saying!) But it has taught me to be patient with my progress, and little by little I can see myself improving.

Fortunately for me though, I was able to work in English, and before long I was getting to grips with the research project that I had travelled all this way for! But before I go into the details of the project, first a little background on why Chile has been such a success story for Solar.

2 – There’s a lot of empty space in the Atacama

The Atacama desert ranges from the pacific ocean to the high plains of the Andes, reaching heights of more than 6000m in places. It is the driest location on the planet (outside of the poles) where in some places there hasn’t been a single drop of rain since records began. This combined with the high altitude results in an unparalleled solar resource that often exceeds 2800 kWh/m2 (Below are two maps comparing South America to the UK, and one can see that even the places of highest solar insolation in the UK wouldn’t even appear on the scale for South America!)

3 – Two maps comparing the solar resource of Latin America to the UK. If you think about the number of solar parks in the UK that exist, and are profitable, just imagine the potential in Latin America!

The majority of the Atacama lies within Chile’s northern regions, and because of this there has been a huge rush over the past 3 years to install utility-scale Solar PV projects there. Additionally, Chile has seen an unprecedented period of economic growth and political stability since the 1990’s, in part due to the very same Atacama regions which are mineral-rich. The mines used to extract this wealth are energy-hungry, and as Chile has a lack of natural fossil fuel resources, making use of the plentiful solar resource beating down on the desert planes surrounding these remote sites made perfect economic sense. This is added to the need for energy in the rapidly-growing cities further south, in particular the capital Santiago, where almost a third of the Chilean population live. From 2010 to 2015, the total installed capacity of PV worldwide went from 40GW to 227GW, a rapid increase largely due to decreasing PV module manufacture costs. As the cost of installation dropped, investors began to search for locations with the greatest resources, and so Chile became a natural place to invest for energy developers.

However, as large scale projects began generating power, new challenges began to emerge. New plants were underperforming and thus not taking full advantage of the powerful solar resource. This underperformance could be down to a whole range of factors; faulty installation, PV panels experiencing a drop in performance due to the extremely high UV radiation (known as degradation). But the main culprits are likely to be two factors; curtailment and soiling.

Firstly, curtailment. Chile is a deceptively large country, which from top to bottom is more than 4000km long (roughly the distance from London to Baghdad). Because of this, instead on having one large national grid, it is split into four smaller ones. The central grid (in blue, which is connected to the power-hungry capital of Santiago) offered a better price of energy than the northern grid (in green) supplying the more sparsely populated Atacama regions. This lead to a large number of plants being installed as far into the Atacama desert as possible, and therefore as far north as possible, whilst still being connected to the more profitable central grid.

4
– A map of the central (blue) and northern (green) grids in Northern Chile.
Major PV plants are shown with red dots

This lead to a situation where the low number of cables and connections that existed connecting these areas with the cities further south suddenly became overloaded with huge quantities of power. When these cables reach capacity, the grid operators (CDEC-SIC – http://www.cdecsic.cl/), with no-where to store this energy, simply have no other option but to limit (or curtail) the clean, emission-free energy coming out of these PV plants. This is bad news for the plant operators as it limits their income, and bad news for the environment as fossil fuels still need to be burned further south to make up for the energy lost.

The solution to this is to simply build more cables, a task easier said than done in a country of this size and in an area so hostile. This takes a long time, and so until the start of 2018 when a new connection between the northern and central grids will be made, operators have little choice but to busy themselves by improving plant performance as much as possible in preparation for a time when generation is once again unlimited.

This leads me onto soiling. Soiling is a phenomenon that occurs when wind kicks up sand and dust from the surrounding environment and this lands on the PV panels. This may seem relatively harmless but in Saudi Arabia is has been found to be responsible for as much as a 30% loss in plant performance. Chile, however, is still a very new market and so the effects of soiling here are not as well understood. What we do know for sure is that it affects some sites much more than others – the image below being taken by the 350renewables team at an existing Chilean site.

5 – The extent of soiling in the Atacama. One can appreaciate the need for an occasional clean!

These panels can be cleaned, but this becomes somewhat more complicated when you consider that some of these plants have more than 200,000 panels on one site. Cleaning then becomes a balance between the cost of cleaning, the means of cleaning (water being a scarce commodity in the desert) and the added energy that will be gained by removing the effects of soiling.

This is what the research project that I am taking part in hopes to establish. Sponsored by CORFO, a government corporation that promotes economic growth in Chile, and working with the University of Santiago, 350renewables hopes to establish how soiling effects vary across the Atacama and which cleaning schedules are best suited to maximising generation. There are 10 utility scale projects currently taking part, providing generation data and cleaning schedules. My role within this project has thus far been to inspect, clean and process all the incoming data and transfer this to our in-house tools for analysis. In the future (as my spanish improves) this will move onto liaising with the individual maintenance teams at each site to ensure that cleaning schedules are adhered to.

My most notable challenge thus far was presenting some of our initial findings at the Solar Asset Management Latin America (SAM LATAM – http://www.samlatam.com/#solar-asset-management-latam) conference in September. Considering I had only been in the country for just over a month, it was a lot to learn in not very much time! My presentation discussed the underperformance of Chilean PV plants and the potential causes for this, examining some of the publicly available generation data over the past few years. It was certainly terrifying, but getting the opportunity to share a stage with a plethora of CEOs, managers and directors from the Chilean solar energy industry was a fantastic opportunity.

6 – I felt like an impostor amongst all the Directors and Managers

A few weeks prior to this we had also gone to the Intersolar South America conference (https://www.intersolar.net.br/en/home.html) in São Paulo, Brasil, where Patricia was speaking. This was another fantastic opportunity to meet other people from the industry (although somewhat limited by my non-existent Portuguese abilities) and I was lucky enough to have some time to explore the city for a few days thereafter.

7 – São Paulo, Brazil

In addition to São Paulo, I have been able to find the time to travel elsewhere in Chile during my time here, including down to Puerto Varas in the south with its peaceful lakes nestled at the feet of imposing active volcanoes (including the Calbuco volcano, which erupted in spectacular fashion in early 2015: https://www.youtube.com/watch?v=faacTZ5zeP0). Being further south the countryside is much more green, and with a significant German influence from several waves of immigration in the 1800s.

8 – Me in front of the incredible Osorno Volcano near Puerto Varas
9 – Puerto Varas

By far my favourite though was the astounding Atacama desert. As beautiful as it is vast. The high altitude making for astounding blue skies contrast against the red rocks of the surrounding volcanic plains. It is also one of the best stargazing spots on the planet, and the location of the famous A.L.M.A. observatory, which hopes to provide insight on star birth during the early universe and detailed images of local star and planet formations (http://www.almaobservatory.org/).


10
– Me in the Atacama. The second photo being what can only be described as a
dust tornado. To call the Atacama inhospitable would be taking it lightly
11 -Valle de la luna, an incredible formation of jagged peaks jutting out of the desert plains. Certainly a highlight.

In the new year the soiling project really gets underway, and by the end of 2017 we hope to have some findings that will provide some insights into the phenomenon that is soiling. Personally, it has been a great adventure so far, the language skills I have developed and the experience of living in another culture, as opposed to merely passing through as a tourist, has been very rewarding. I still have a long way to go, and hope to post an update to this blog in the future, but for now a Happy New Year from Chile!

Why we need a new science of safety

It is often said that our approach to health and safety has gone mad. But the truth is that it needs to go scientific. Managing risk is ultimately linked to questions of engineering and economics. Can something be made safer? How much will that safety cost? Is it worth that cost?

Decisions under uncertainty can be explained using utility, a concept introduced by Swiss mathematician Daniel Bernoulli 300 years ago, to measure the amount of reward received by an individual. But the element of risk will still be there. And where there is risk, there is risk aversion.
Risk aversion itself is a complex phenomenon, as illustrated by psychologist John W. Atkinson’s 1950s experiment, in which five-year-old children played a game of throwing wooden hoops around pegs, with rewards based on successful throws and the varying distances the children chose to stand from the pegs.

The risk-confident stood a challenging but realistic distance away, but the risk averse children fell into two camps. Either they stood so close to the peg that success was almost guaranteed or, more perplexingly, positioned themselves so far away that failure was almost certain. Thus some risk averse children were choosing to increase, not decrease, their chance of failure.

So clearly high aversion to risk can induce some strange effects. These might be unsafe in the real world, as testified by author Robert Kelsey, who said that during his time as a City trader, “bad fear” in the financial world led to either “paralysis… or nonsensical leaps”. Utility theory predicts a similar effect, akin to panic, in a large organisation if the decision maker’s aversion to risk gets too high. At some point it is not possible to distinguish the benefits of implementing a protection system from those of doing nothing at all.

So when it comes to human lives, how much money should we spend on making them safe? Some people prefer not to think about the question, but those responsible for industrial safety or health services do not have that luxury. They have to ask themselves the question: what benefit is conferred when a safety measure “saves” a person’s life?

The answer is that the saved person is simply left to pursue their life as normal, so the actual benefit is the restoration of that person’s future existence. Since we cannot know how long any particular person is going to live, we do the next best thing and use measured historical averages, as published annually by the Office of National Statistics. The gain in life expectancy that the safety measure brings about can be weighed against the cost of that safety measure using the Judgement value, which mediates the balance using risk-aversion.

The Judgement (J) value is the ratio of the actual expenditure to the maximum reasonable expenditure. A J-value of two suggests that twice as much is being spent as is reasonably justified, while a J-value of 0.5 implies that safety spend could be doubled and still be acceptable. It is a ratio that throws some past safety decisions into sharp relief.

For example, a few years ago energy firm BNFL authorised a nuclear clean-up plant with a J-value of over 100, while at roughly the same time the medical quango NICE was asked to review the economic case for three breast cancer drugs found to have J-values of less than 0.05.

Risky business. shutterstock

The Government of the time seemed happy to sanction spending on a plant that might just prevent a cancer, but wanted to think long and hard about helping many women actually suffering from the disease. A new and objective science of safety is clearly needed to provide the level playing field that has so far proved elusive.

Putting a price on life

Current safety methods are based on the “value of a prevented fatality” or VPF. It is the maximum amount of money considered reasonable to pay for a safety measure that will reduce by one the expected number of preventable premature deaths in a large population. In 2010, that value was calculated at £1.65m.

This figure simplistically applies equally to a 20-year-old and a 90-year-old, and is in widespread use in the road, rail, nuclear and chemical industries. Some (myself included) argue that the method used to reach this figure is fundamentally flawed.

In the modern industrial world, however, we are all exposed to dangers at work and at home, on the move and at rest. We need to feel safe, and this comes at a cost. The problems and confusions associated with current methods reinforce the urgent need to develop a new science of safety. Not to do so would be too much of a risk.

———————————————————
The ConversationThis blog is written by Cabot Institute member Philip Thomas, Professor of Risk Management, University of Bristol.  This article was originally published on The Conversation. Read the original article.

Philip Thomas

Why we need to tackle the growing mountain of ‘digital waste’

Image credit Guinnog, Wikimedia Commons.

We are very aware of waste in our lives today, from the culture of recycling to the email signatures that urge us not to print them off. But as more and more aspects of life become reliant on digital technology, have we stopped to consider the new potential avenues of waste that are being generated? It’s not just about the energy and resources used by our devices – the services we run over the cloud can generate “digital waste” of their own.

Current approaches to reducing energy use focus on improving the hardware: better datacentre energy management, improved electronics that provide more processing power for less energy, and compression techniques that mean images, videos and other files use less bandwidth as they are transmitted across networks. Our research, rather than focusing on making individual system components more efficient, seeks to understand the impact of any particular digital service – one delivered via a website or through the internet – and re-designing the software involved to make better, more efficient use of the technology that supports it.

We also examine what aspects of a digital service actually provide value to the end user, as establishing where resources and effort are wasted – digital waste – reveals what can be cut out. For example, MP3 audio compression works by removing frequencies that are inaudible or less audible to the human ear – shrinking the size of the file for minimal loss of audible quality.

This is no small task. Estimates have put the technology sector’s global carbon footprint at roughly 2% of worldwide emissions – almost as much as that generated by aviation. But there is a big difference: IT is a more pervasive, and in some ways more democratic, technology. Perhaps 6% or so of the world’s population will fly in a given year, while around 40% have access to the internet at home. More than a billion people have Facebook accounts. Digital technology and the online services it provides are used by far more of us, and far more often.

It’s true that the IT industry has made significant efficiency gains over the years, far beyond those achieved by most other sectors: for the same amount of energy, computers can carry out about 100 times as much work as ten years ago. But devices are cheaper, more powerful and more convenient than ever and they’re used by more of us, more of the time, for more services that are richer in content such as video streaming. And this means that overall energy consumption has risen, not fallen.

Some companies design their products and services with the environment in mind, whether that’s soap powder or a smartphone. This design for environment approach often incorporates a life-cycle assessment, which adds up the overall impact of a product – from resource extraction, to manufacture, use and final disposal – to get a complete picture of its environmental footprint. However, this approach is rare among businesses providing online digital services, although some make significant efforts to reduce the direct impact of their operations – Google’s datacentres harness renewable energy, for example.

It may seem like data costs nothing, but it how software is coded affects the energy electronics consumes. 3dkombinat/shutterstock.com

We were asked to understand the full life-cycle cost of a digital operation by Guardian News and Media, who wanted to include this in their annual sustainability report. We examined the impact of the computers in the datacentres, the networking equipment and transmission network, the mobile phone system, and the manufacture and running costs of the smartphones, laptops and other devices through which users receive the services the company provides.

In each case, we had to determine, through a combination of monitoring and calculation, what share of overall activity in each component should be allocated to the firm. As a result of this, Guardian News and Media became the first organisation to report the end-to-end carbon footprint of its digital services in its sustainability report.

But what design approaches can be used to reduce the impact of the digital services we use? It will vary. For a web search service such as Google, for example, most of the energy will be used in the datacentre, with only a small amount transmitted through the network. So the approach to design should focus on making the application’s software algorithms running in the datacentre as efficient as possible, while designing the user interaction so that it is simple and quick and avoids wasting time (and therefore energy) on smartphones or laptops.

On the other hand, a video streaming service such as BBC iPlayer or YouTube requires less work in the datacentre but uses the network and end-user’s device far more intensively. The environmental design approach here should involve a different strategy: make it easier for users to preview videos so they can avoid downloading content they don’t want; seek to avoid digital waste that stems from sending resource-intensive video when the user is only interested in the audio, and experiment with “nudge” approaches that provide lower resolution audio/video as the default.

With the explosive growth of digital services and the infrastructure needed to support them it’s essential that we take their environmental impact seriously and strive to reduce it wherever possible. This means designing the software foundations of the digital services we use with the environment in mind.
—————————-
This blog is written by University of Bristol Cabot Institute member Chris Preist, Reader in Sustainability and Computer Systems.

Chris Preist

This article was originally published on The Conversation. Read the original article.

Resilience and urban design

In this article, inspired by the movement of open spaces in cities across the world and resilience theory [1], Shima Beigi argues that city and human resilience are tightly interlinked and it is possible to positively influence both through utilising the transformative power of open spaces in novel ways.

Human resilience makes cities more resilient

Future cities provide a fertile ground to integrate and synthesise different properties of space and help us realise our abilities to become more resilient. Rapid urbanisation brings with it a need to develop cohesive and resilient communities, so it is crucial to discuss how we can better design our cities. In the future, urban design must harness the transformative function of open spaces to help people explore new sociocultural possibilities and increase our resilience: resilient people help form the responsible citizenry that is necessary for the emergence of more resilient urban systems.

Cities are complex adaptive systems

Cities are complex adaptive systems which consist of many interacting parts with different degrees of flexibility, and open urban spaces hold the potential for embedding flexible platforms into future urban design; they invoke the possibility of adopting a different set of values and behaviours related to our cities, such as flexible structures designed to change how we imagine the collective social space or intersubjective space.

Transportation grids are for functional movement and coordination in cities, but open spaces can be seen as avenues for personal growth and development, social activities, learning, collective play and gaming (figure 1). They help us adjust and align our perception of reality in real-time and for free. All we need is our willingness to let go of the old and allow the new to guide us toward evolution, transcendence and resilience.

Figure 1: Boulevard Anspach, Belgium, Brussels. Images credit Shima Beigi

Open spaces also encourage another important process: the emergence of a fluid sense of one’s self as an integral part of a city’s design. Urban design can help citizens feel invited to explore and unearth parts of the internal landscape.

Mindfulness engineering and the practice of resiliencing

Drawing on my research on resilience of people, places, critical infrastructure systems and socio-ecological systems, I have collected 152 different ways of defining resilience and here I propose an urban friendly view of resilience:

“resilience is about mastering change and is a continuous process of becoming and expanding one’s radius of comfort zone until the whole world becomes mapped into one’s awareness”.

In this view, our continuous exposure to new conditions helps us align with a new tempo of change. Resilience is naturally embedded in all of us and we need to find those key principles and pathways through which we can practise our natural potential for resilience and adaptability to change on a daily basis. This is what I call ‘mindfulness engineering‘ and the practice of ‘resiliencing‘. There is no secret to resilience; Ann S. Masten even calls it an ‘ordinary magic‘.

Building resilient and sustainable cities

Future cities provide us with the opportunity to increase our resilience. There is no fixed human essence and we are always in the state of dynamic unfolding. So the paradox for the future is this: the only thing fixed about the future is a constant state of change. As existential philosopher Søren Kierkegaard said, “the only thing repeated is the impossibility of repetition.” It is only through this shift of perspective to becoming in tune with one’s adaptation and resilience style that we can change our mental models and become better at handling change.

Footnote

[1] The movement of resilience as the capacity to withstand setbacks and continue to grow started in early 70s. Today, the concept of resilience has transformed to a platform for global conversation on the future of human development across the world.

——————————
This blog is by Cabot Institute member Dr Shima Beigi from the University of Bristol’s Faculty of Engineering.  Shima’s research looks at the Resilience and Sustainability of Complex Systems.

This blog has been republished with kind permission from the Government Office for Science’s Future of Cities blog.

Bringing science and art together – part 2

The Somerset Levels and Moors are a low lying region prone to frequent flooding due to a range of environmental and human factors. The history of drainage and flooding in the Levels is rich and unique, yet its present condition is unstable and its future uncertain. Winter 2013-14 for example saw extensive floods in the Levels that attracted significant media attention and triggered debate on how such events can be mitigated in the future. The Land of the Summer People Science & Art project brings together engineering PhD students with local artists to increase public awareness and understanding of the Somerset floods. Scientific understanding and traditional engineering tools are combined with the artists’ creativity to prompt discussions about the area’s relationship with floods in a medium designed to be accessible and enjoyable.

Having worked on the early stages of this project researching the history and hydrology of flooding and drainage in the Somerset Levels I thought I was well prepared for the art stages to follow. I was decidedly wrong! The first workshop involved making a standard engineering-style poster containing information in the area our group had chosen to focus on; in my case the future of flooding in the region. This was a pretty standard summary of climate change impacts, land use change and a critique on the present policy which will shape the region over the next 5-20 years.

The next workshop saw us transform this information into a more ‘arty’ format. We chose a newspaper style article from 5 years in the future. In civil engineering (my undergraduate background) there’s a strong perception that the public don’t know anything about engineering and that they demand only bottom-up management towards their own interests; and this was definitely present in my article. Regardless of the truth or fallacy in this assumption, taking this attitude will not gain you public support for your project and, importantly, you will very likely miss out on important information that stakeholders could provide you with.

Each group began work with a Somerset artist to create art out of their topics and ideas. Our group is currently putting together a ‘flood survival kit’ containing items which aim to bring together ideas about the impacts and mechanisms behind flooding. Putting this together has been constant interplay between engineers looking to add purpose to items and our artist looking to reduce purpose with a much heavier use of metaphors/symbolism. Items include purpose-heavy hand-made water filters (from drinking bottles and sand!) and metaphor-heavy sponges and boats (made from Somerset clay).

Additionally our group will be inscribing rocks around Somerset with a text-number which will provide flood relevant proverbs or information when a message is sent to them. This was inspired by tsunami warning rocks in Japan!

An original tsunami warning rock in Japan
courtesy of the Huffington Post, 4th June 2011.

On 25th March, all the groups presented their projects in an exhibition in the Exeter Community Centre.

Our most valuable return on these projects are the skills in working with the public we will gain. After all, even capital projects designed with a stakeholder’s desires and demands in mind won’t work if the stakeholder rejects them. The pre-industrial history of the Somerset Levels illustrates this perfectly as drainage works in the region have typically been vandalised and prevented from working due to public opposition (an interesting contrast to the present dredging-heavy mentality!).

————————-
This blog has been reproduced with kind permission from the Bristol Doctoral College blog. It is written by Barney Dobson and Wouter Knoben who are currently studying engineering PhDs at the University of Bristol.

Read part one of this blog.

More about Land of the Summer People

This event was organised by Cabot Institute members Seila Fernández Arconada and Thorsten Wagener.  Read more.

Bringing science and art together – part 1

The Somerset Levels and Moors are a low lying region prone to frequent flooding due to a range of environmental and human factors. The history of drainage and flooding in the Levels is rich and unique, its present condition is unstable and its future uncertain. Winter 2013-14 for example saw extensive floods in the Levels that attracted a great deal of media attention and conflicting opinions on what to do how to prevent this from happening again. The Science & Art project brings engineering PhD students together with local artists, to increase public awareness and understanding of the Somerset floods. Scientific understanding and traditional engineering tools are combined with the artists’ creativity, in an effort to make discussions about the area’s history, present and future more accessible and enjoyable.

Coming from an engineering background, the prospect outlined above slightly scared me at first. As an engineer, you rarely use art as a tool in your work and, funnily enough, doesn’t appear during your university courses either. The few interactions with artists (as colleagues in a bar) and art (sporadic museum visits) left me very sceptic as to the success of this cooperation. Sure, art can be nice to look at, but what is the point of it when you’re trying to convey the results of your studies on flood risk?

This project is divided into a couple of workshops, and the differences between engineers and artists was apparent right from the start. We (the engineers) tried to convey as much knowledge about the Somerset Levels as we could cram onto our posters. Dates, history, water safety plans, references, whatever information was available. The artists then showed us some of their work. We saw sketches of landscapes reflecting in water, paintings of local soldiers in shoe polish and visual representations of sound waves to name a few things.

For the next workshop we were asked to change our original posters in any way we saw fit, based on the things we picked up from our first art workshop. This turned out to be not as easy as we’d hoped. After years of being trained to present information in a thorough and accurate way, making the necessary switch to create something that could be called artistic is difficult. We mostly managed to present the, admittedly dry, material on the posters into a somewhat more appealing way. The idea to do something else than conveying information was still difficult to bring into practice.

As the artists kept reminding us, it is not always necessary to convey knowledge to the viewer of our work. Sometimes it is enough to make someone think about a certain topic you think is important, or to simply present some specific theme in an intriguing, appealing or interesting way. In the third workshop we began to form ideas based on this line of thinking. Transferring information and creating knowledge for the viewer are still important parts of the work, but they have become secondary rather than primary objectives. Now we’re hard at the work to make our ideas become reality!

These workshops have been good to show some perspective. As a specialist, you would normally want to present as much of your gathered information and knowledge as you possibly can, but this quickly becomes overwhelming for someone unfamiliar to the topic. Collaborating with artists can be a good way to introduce a specialised topic to a wider audience in an entertaining and accessible way, while at the same time teaching us how laypeople might think about our subjects.
———————————
This blog has been reproduced with kind permission from the Bristol Doctoral College blog. It is written by Barney Dobson and Wouter Knoben who are currently studying engineering PhDs at the University of Bristol.

Read part two of this blog.

More about Land of the Summer People

This event was organised by Cabot Institute members Seila Fernández Arconada and Thorsten Wagener.  Read more.