Are you a journalist looking for climate experts? We’ve got you covered

We’ve got lots of media trained climate change experts. If you need an expert for an interview, here is a list of Caboteers you can approach. All media enquiries should be made via Victoria Tagg, our dedicated Media and PR Manager at the University of Bristol. Email victoria.tagg@bristol.ac.uk or call +44 (0)117 428 2489.

Climate change / climate emergency / climate science / climate-induced disasters

Dr Eunice Lo – expert in changes in extreme weather events such as heatwaves and cold spells, and how these changes translate to negative health outcomes including illnesses and deaths. Follow on Twitter @EuniceLoClimate.

Professor Daniela Schmidt – expert in the causes and effects of climate change on marine systems. Dani is also a Lead Author on the IPCC reports. Dani will be at COP26.

Dr Katerina Michalides – expert in drylands, drought and desertification and helping East African rural communities to adapt to droughts and future climate change. Follow on Twitter @_kmichaelides.

Professor Dann Mitchell – expert in how climate change alters the atmospheric circulation, extreme events, and impacts on human health. Dann is also a Met Office Chair. Dann will be at COP26. Follow on Twitter @ClimateDann.

Professor Dan Lunt – expert on past climate change, with a focus on understanding how and why climate has changed in the past and what we can learn about the future from the past. Dan is also a Lead Author on IPCC AR6. Dan will be at COP26. Follow on Twitter @ClimateSamwell.

Professor Jonathan Bamber – expert on the impact of melting land ice on sea level rise (SLR) and the response of the ocean to changes in freshwater forcing. Jonathan will be at COP26. Follow on Twitter @jlbamber

Professor Paul Bates CBE – expert in the science of flooding, risk and reducing threats to life and economic losses worldwide. Follow on Twitter @paul_d_bates

Professor Tony Payne – expert in the effects of climate change on earth systems and glaciers.

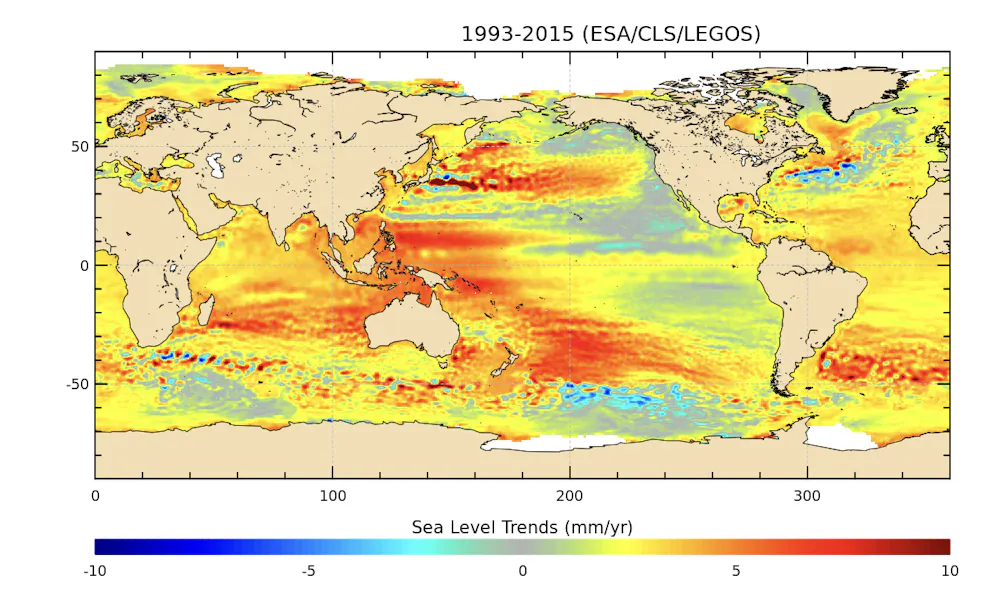
Dr Matt Palmer – expert in sea level and ocean heat content research at the Met Office Hadley Centre and University of Bristol. Follow on Twitter @mpclimate.

Net Zero / Energy / Renewables

Professor Valeska Ting – Engineer and expert in net zero, low carbon technologies, low carbon energy and flying. Also an accomplished STEM communicator, is an BAME Expert Voice for the BBC Academy. Follow on Twitter @ProfValeskaTing.

Professor Philip Taylor – Expert in net zero, energy systems, energy storage, utilities, electric power distribution. Also Pro-Vice Chancellor at the University of Bristol. Philip will be at COP26. Follow on Twitter @rolyatlihp.

Dr Colin Nolden – expert in sustainable energy policy, regulation and business models and interactions with secondary markets such as carbon markets and other sectors such as mobility. Colin will be at COP26.

Climate finance

Dr Rachel James – Expert in climate finance, damage, loss and decision making. Also has expertise in African climate systems and contemporary and future climate change. Follow on Twitter @_RachelJames

Climate justice

Dr Alix Dietzel – climate justice and climate policy expert. Focusing on the global and local scale and interested in how just the response to climate change is and how we can ensure a just transition. Alix will be at COP26. Follow on Twitter @alixdietzel

Dr Ed Atkins – expert on environmental and energy policy, politics and governance and how they must be equitable and inclusive. Also interested in local politics of climate change policies and energy generation and consumption. Follow on Twitter @edatkins_.

Climate activism / Extinction Rebellion

Dr Oscar Berglund – expert on climate change activism and particularly Extinction Rebellion (XR) and the use of civil disobedience. Follow on Twitter @berglund_oscar.

Air pollution / Greenhouse gases

Dr Aoife Grant – expert in greenhouse gases and methane. Has set up a monitoring station at Glasgow for COP26 to record emissions.

Professor Matt Rigby – expert on sources and sinks of greenhouse gases and ozone depleting substances. Follow on Twitter @TheOtherMRigby.

Land, nature and food

Dr Jo House – expert on land and climate interactions, including emissions of carbon dioxide from land use change (e.g. deforestation), climate mitigation potential from the land (e.g. afforestation, bioenergy), and implications of science for policy. Previously Government Office for Science’s Head of Climate Advice. Follow on Twitter @Drjohouse.
Dr Taro Takahashi – expert on farming, livestock production systems as well as progamme evaluation and general equilibrium modelling of pasture and livestock-based economies.

Climate change and infrastructure

Dr Maria Pregnolato – expert on effects of climate change and flooding on infrastructure. Follow on Twitter @MariaPregnolat1.

Plastic and the environment

Dr Charlotte Lloyd – expert on the fate of chemicals in the terrestrial environment, including plastics, bioplastics and agricultural wastes. Follow on Twitter @DrCharlLloyd.

What else the Cabot Institute for the Environment is up to for COP26

Find out what we’re doing for COP26 on our website at bristol.ac.uk/cabot/cop26.
Watch our Cabot Conversations – 10 conversations between 2 experts on a climate change issue, all whilst an artist listens in the background and interprets the conversation into a beautiful piece of art in real time. Find out more at bristol.ac.uk/cabot/conversations.
——————————
This blog was written by Amanda Woodman-Hardy, Communications and Engagement Officer at the Cabot Institute for the Environment. Follow on Twitter @Enviro_Mand and @cabotinstitute.
 

The COP26 Goals and Small Island Developing States

Small Island Developing States (SIDS) have had a giant impact on international climate negotiations. As part of the Alliance of Small Island States and the High Ambition Coalition, SIDS have pushed for the 1.5°C Paris Agreement target through their tagline “1.5°C to stay alive” as well as their advocacy for loss and damage and climate adaptation finance. Without them, the Paris Agreement would not be nearly as ambitious [1], and there would not be the focus on the 1.5°C temperature goal to the extent there is today. SIDS are amongst the countries on the frontline of the climate emergency, whilst being some of the least responsible for greenhouse gases causing anthropogenic climate change.

But SIDS have not sat back quietly whilst their future becomes more uncertain. They are fighting for the assurances of climate mitigation from the rest of the world to help ensure their habitable future.

As part of this year’s United Nations Climate Conference COP26, four goals have been set to drive forward ambition to tackle the climate emergency. Here are four reasons why achieving these goals is not only crucial for the future of humanity, but especially for SIDS.

1. Secure global net zero by mid-century and keep 1.5°C within reach

SIDS have long been champions of the 1.5°C goal, underlining the science that demonstrates that limiting warming to 2°C would be inadequate to ensure a habitable future for some small island states. Following the 2018 IPCC report looking at the impacts of a world at 1.5°C and 2°C, a 1.5°C global temperature rise in SIDS would already lead to [2]:

    ↑ More intense rainfall events

    ↑ More extreme heat

    ↑ Longer and more extreme drought

    ↑ Increased flooding

    ↑ Freshwater stress

    ↑ Significant loss of coral reefs

    ↑ Sea level rise

Any increase greater than 1.5°C would compound and exacerbate these risks further and could lead to the loss of ancestral homelands for thousands of people in low-lying islands such as the Maldives or Kiribati. For other islands, there would be severe impacts on lives and livelihoods. To highlight just one example, communities in small islands often rely on coral reefs for food, storm protection and tourism (to name but a few of the many reasons coral reefs are critical to coastal communities all over the world). But at 2°C warming, 99% of coral reefs are likely to perish [2]. For some small islands it really is “1.5°C to stay alive”.

2. Adapt to protect communities and natural habitats

Adaptation will be required in SIDS to help communities adjust to the consequences of a more extreme climate. From coral reef and mangrove restoration in the Caribbean, to early warning systems in the Pacific, adaptation strategies in SIDS are accelerating, but this must be aided by appropriate finance and support. The United Nations proposes that at least 50% of climate finance should be spent on building resilience and adaptation, but financial capital is currently the key limiting factor for adaptation in SIDS. Mobilising finance to boost adaptation projects would be the first step up a long ladder in assisting SIDS facing the steep cost of adapting to a climate they did not create.

3. Mobilise finance

Developing nations such as those in SIDS need financial assistance from developed economies to fund adaptation and the transition to a greener future. This is entirely reasonable considering that developed nations have built their economies using fossil fuels, of which the consequences are a) already impacting SIDS today and b) not an option to fuel sustainable development. Developed countries pledged to raise at least $100billion annually by 2020 to support developing countries with adaptation and mitigation, but in 2018 just $78.9billion had been mobilised [3]. Even if this $100billion is attained it would still be vastly insufficient, considering estimated costs of adaptation in developing countries will be $280-500billion in 2050 [4].

But what about the communities or entire islands who cannot adapt? SIDS have also been key advocates for loss and damage reparations, seeking compensation for their inequitable experience of climate-related disasters and for the loss and damages that cannot be recovered or adapted against. Broadly speaking, this refers to climate-related loss and damages – such as those from weather and hazard events we know are being made more likely and more severe by climate change – as well as helping to avoid future loss and damage through adequate risk reduction and adaptation.

In whichever form these reparations come, it is vital that they come faster and with bolder ambition.

4. Work together to deliver ambition into action

Small Island Developing States cannot combat the climate emergency alone. After all, the very reason for the extreme injustice of climate change in SIDS is that they have done little to cause the problem that they are bearing the consequences of. To put this in context, SIDS are responsible collectively for less than 1% of global greenhouse emissions [5]. This is where governments, business, and civil society from all over the world come in. SIDS (and the entire planet, frankly) need all countries to come forward with robust plans and targets for slashing emissions by at least 50% by 2030 and reaching net zero by 2050, as well as agreeing to mobilise finance to support adaptation against the damage we have already locked in.

Time is ticking. Let’s ensure these goals are achieved at COP26 to help speed up our race against the clock, so that we can safeguard a habitable future for SIDS, for ourselves and the planet.

References

[1] Ourbak, T. & Magnan, A. K. The Paris Agreement and climate change negotiations: Small Islands, big players. Regional Environmental Change vol. 18 2201–2207 (2018).

[2] Hoegh-Guldberg, O. et al. Chapter 3: Impacts of 1.5oC global warming on natural and human systems. in Global warming of 1.5°C. An IPCC Special Report on the impacts of global warming of 1.5°C above pre-industrial levels and related global greenhouse gas emission pathways, in the context of strengthening the global response to the threat of climate change, (ed. Intergovernmental Panel on Climate Change) 175–311 (Intergovernmental Panel on Climate Change, 2018).

[3] OECD. Climate Finance Provided and Mobilised by Developed Countries in 2013-18. OECD https://www.oecd-ilibrary.org/finance-and-investment/climate-finance-provided-and-mobilised-by-developed-countries-in-2013-18_f0773d55-en (2020) doi:10.1787/F0773D55-EN.

[4] United Nations Environment Programme. Adaptation Gap Report 2020. https://www.unep.org/resources/adaptation-gap-report-2020 (2020).

[5] Thomas, A. et al. Climate Change and Small Island Developing States. Annual Review of Environment and Resources 45, (2020).

Header image: Leigh Blackall (CC BY 2.0)

—————————

This blog is written by Cabot Institute for the Environment member Leanne Archer, School of Geographical Science, University of Bristol. Leanne is a NERC GW4+ PhD student interested in disaster risk in Small Island Developing States, investigating how flood inundation estimates could be improved in small islands under current and future climate change. You can follow Leanne on Twitter @leanne_archer_

Five satellite images that show how fast our planet is changing


Stocktrek Images, Inc. / Alamy

You have probably seen satellite images of the planet through applications like Google Earth. These provide a fascinating view of the surface of the planet from a unique vantage point and can be both beautiful to look at and useful aids for planning. But satellite observations can provide far more insights than that. In fact, they are essential for understanding how our planet is changing and responding to global heating and can do so much more than just “taking pictures”.

It really is rocket science and the kind of information we can now obtain from what are called Earth observation satellites is revolutionising our ability to carry out a comprehensive and timely health check on the planetary systems we rely on for our survival. We can measure changes in sea level down to a single millimetre, changes in how much water is stored in underground rocks, the temperature of the land and ocean and the spread of atmospheric pollutants and greenhouse gases, all from space.

Here I have selected five striking images that illustrate how Earth observation data is informing climate scientists about the changing characteristics of the planet we call home.

1. The sea level is rising – but where?

Map showing global sea level rise
The sea is rising quickly – but not evenly.
ESA/CLS/LEGOS, CC BY-SA

Sea level rise is predicted to be one of the most serious consequences of global heating: under the more extreme “business-as-usual” scenario, a two-metre rise would flood 600 million people by the end of this century. The pattern of sea surface height change, however, is not uniform across the oceans.

This image shows mean sea level trends over 13 years in which the global average rise was about 3.2mm a year. But the rate was three or four times faster in some places, like the south western Pacific to the east of Indonesia and New Zealand, where there are numerous small islands and atolls that are already very vulnerable to sea level rise. Meanwhile in other parts of the ocean the sea level has barely changed, such as in the Pacific to the west of North America.

2. Permafrost is thawing

Source: ESA

Permafrost is permanently frozen ground and the vast majority of it lies in the Arctic. It stores huge quantities of carbon but when it thaws, that carbon is released as CO₂ and an even more potent greenhouse gas: methane. Permafrost stores about 1,500 billion tonnes of carbon – twice as much as in the whole of the atmosphere – and it is incredibly important that carbon stays in the ground.

This animation combines satellite, ground-based measurements of soil temperature and computer modelling to map the permafrost temperature at depth across the Arctic and how it is changing with time, giving an indication of where it is thawing.

3. Lockdown cleans Europe’s skies

Source: ESA

Nitrogen dioxide is an atmospheric pollutant that can have serious health impacts, especially for those who are asthmatic or have weakened lung function, and it can increase the acidity of rainfall with damaging effects on sensitive ecosystems and plant health. A major source is from internal combustion engines found in cars and other vehicles.

This animation shows the difference in NO₂ concentrations over Europe before national pandemic-related lockdowns began in March 2020 and just after. The latter shows a dramatic reduction in concentration over major conurbations such as Madrid, Milan and Paris.

4. Deforestation in the Amazon

Credits: ESA/USGS/Deimos Imaging

Tropical forests have been described as the lungs of the planet, breathing in CO₂ and storing it in woody biomass while exhaling oxygen. Deforestation in Amazonia has been in the news recently because of deregulation and increased forest clearing in Brazil but it had been taking place, perhaps not so rapidly, for decades. This animation shows dramatic loss of rainforest in the western Brazilian state of Rondonia between 1986 and 2010, as observed by satellites.

5. A megacity-sized iceberg

Source: ESA

The Antarctic Ice Sheet contains enough frozen water to raise global sea level by 58 metres if it all ended up in the ocean. The floating ice shelves that fringe the continent act as a buffer and barrier between the warm ocean and inland ice but they are vulnerable to both oceanic and atmospheric warming.

This animation shows the break-off of a huge iceberg dubbed A-74, captured by satellite radar images that have the advantage they can “see” through clouds and operate day or night and are thus unaffected by the 24 hours of darkness that occurs during the Antarctic winter. The iceberg that forms is 1,270 km² in area which is about the same size as Greater London.

These examples illustrate just a few ways in which satellite data are providing unique, global observations of key components of the climate system and biosphere that are essential for our understanding of how the planet is changing. We can use this data to monitor those changes and improve models used to predict future change. In the run up to the vitally important UN climate conference, COP26 in Glasgow this November, colleagues and I have produced a briefing paper to highlight the role Earth observation satellites will play in safeguarding the climate and other systems that we rely on to make this beautiful, fragile planet habitable.The Conversation

————————–

This blog is written by Cabot Institute for the Environment member Jonathan Bamber, Professor of Physical Geography, University of Bristol.

This article is republished from The Conversation under a Creative Commons license. Read the original article.

Jonathan Bamber

Arctic Ocean: why winter sea ice has stalled, and what it means for the rest of the world

Ice floes in the Laptev Sea, Russia.
Olenyok/Shutterstock

Arctic sea ice plays a crucial role in the Earth’s energy balance. It is covered for most of the year by snow, which is the brightest natural surface on the planet, reflecting about 80% of the solar radiation that hits it back out to space.

Meanwhile, the ocean it floats on is the darkest natural surface on the planet, absorbing 90% of incident solar radiation. For that reason, changes in sea ice cover have a big impact on how much sunlight the planet absorbs, and how fast it warms up.

Each year a thin layer of the Arctic Ocean freezes over, forming sea ice. In spring and summer this melts back again, but some of the sea ice survives through the summer and is known as multi-year ice. It’s thicker and more resilient than the sea ice that forms and melts each year, but as the Arctic climate warms – at a rate more than twice that of the rest of the world – this multi-year ice is under threat.

In the last 40 years, multi-year ice has shrunk by about half. At some time in the next few decades, scientists expect the world will see an ice-free Arctic Ocean throughout the summer, with worrying consequences for the rest of the climate system. That prospect got much closer in 2020, due in part to the exceptional summer heatwave that roiled the Russian Arctic.

Shutting down the sea ice factory

The oceans have a large thermal capacity, which means they can store huge amounts of heat. In fact, the top metre of the oceans has about the same thermal capacity as the whole of the atmosphere. Many of us have experienced a balmy afternoon in autumn by the coast even though the air temperature inland is only a few degrees above freezing. That’s because the oceans accumulate heat slowly over the summer, releasing it equally slowly during winter.

So it is with the Laptev Sea, lying north of the Siberian coast. This part of the Arctic Ocean is usually a factory for new sea ice in autumn and winter as air temperatures dip below zero and surface water starts to freeze. That new ice is carried westward by persistent offshore winds in a kind of conveyor belt.

A map of the Laptev Sea with an inset world map.
The Laptev Sea lies off the coast of northern Siberia.
NormanEinstein/Wikipedia, CC BY-SA

This process is powered by the formation of polynyas: areas of open water surrounded by sea ice. Polynas act as engines of new sea ice production by exchanging heat with the colder atmosphere, causing the water to freeze. But if there is no sea ice to start with, the polynya cannot form and the whole process shuts down.

Sea ice in the Laptev Sea reached a record low in 2020, with no new ice through October, later than any previous year in the satellite record. The exceptional summer heatwave across Siberia will have resulted in heat accumulating in the adjacent ocean, which is now delaying the regrowth of sea ice.

In the 1980s, there was as much as 600,000 square kilometres of multi-year ice covering around two thirds of the Laptev Sea. In 2020, it has been ice-free for months with no multi-year ice left at all. The whole Arctic Ocean is heading for ice-free conditions in the future, defined as less than one million square kilometres of ice cover. That’s down from about 8 million square kilometres just 40 years ago. This year’s new record delay in ice formation in the Laptev Sea takes it a step closer.

A rapidly changing Arctic is a global cause for concern. Thawing permafrost releases methane, a greenhouse gas that is about 84 times more potent than CO₂ when measured over 20 years.

Meanwhile, the Greenland Ice Sheet, the largest ice mass in the northern hemisphere, is currently contributing more to sea levels rising than any other source, and has enough ice in it to raise global sea level by 7.4 metres. And if the machinations of a warming Arctic still seem remote, evidence suggests that even the weather across much of the northern hemisphere is heavily influenced by what happens in the rapidly changing roof of the world.The Conversation

————————————-

This blog is written by Cabot Institute member Jonathan Bamber, Professor of Physical Geography, University of BristolThis article is republished from The Conversation under a Creative Commons license. Read the original article.


Jonathan Bamber


Climate change: sea level rise could displace millions of people within two generations

A small boat in the Illulissat Icefjord is dwarfed by the icebergs that have calved from the floating tongue of Greenland’s largest glacier, Jacobshavn Isbrae. Image credit: Michael Bamber

Antarctica is further from civilisation than any other place on Earth. The Greenland ice sheet is closer to home but around one tenth the size of its southern sibling. Together, these two ice masses hold enough frozen water to raise global mean sea level by 65 metres if they were to suddenly melt. But how likely is this to happen?

The Antarctic ice sheet is around one and half times larger than Australia. What’s happening in one part of Antarctica may not be the same as what’s happening in another – just like the east and west coasts of the US can experience very different responses to, for example, a change in the El Niño weather pattern. These are periodic climate events that result in wetter conditions across the southern US, warmer conditions in the north and drier weather on the north-eastern seaboard.

The ice in Antarctica is nearly 5km thick in places and we have very little idea what the conditions are like at the base, even though those conditions play a key role in determining the speed with which the ice can respond to climate change, including how fast it can flow toward and into the ocean. A warm, wet base lubricates the bedrock of land beneath the ice and allows it to slide over it.

Though invisible from the surface, melting within the ice can speed up the process by which ice sheets slide towards the sea. Gans33/Shutterstock

These issues have made it particularly difficult to produce model simulations of how ice sheets will respond to climate change in future. Models have to capture all the processes and uncertainties that we know about and those that we don’t – the “known unknowns” and the “unknown unknowns” as Donald Rumsfeld once put it. As a result, several recent studies suggest that previous Intergovernmental Panel on Climate Change reports may have underestimated how much melting ice sheets will contribute to sea level in future.

What the experts say

Fortunately, models are not the only tools for predicting the future. Structured Expert Judgement is a method from a study one of us published in 2013. Experts give their judgement on a hard-to-model problem and their judgements are combined in a way that takes into account how good they are at assessing their own uncertainty. This provides a rational consensus.

The approach has been used when the consequences of an event are potentially catastrophic, but our ability to model the system is poor. These include volcanic eruptions, earthquakes, the spread of vector-borne diseases such as malaria and even aeroplane crashes.

Since the study in 2013, scientists modelling ice sheets have improved their models by trying to incorporate processes that cause positive and negative feedback. Impurities on the surface of the Greenland ice sheet cause positive feedback as they enhance melting by absorbing more of the sun’s heat. The stabilising effect of bedrock rising as the overlying ice thins, lessening the weight on the bed, is an example of negative feedback, as it slows the rate that the ice melts.

The record of observations of ice sheet change, primarily from satellite data, has also grown in length and quality, helping to improve knowledge of the recent behaviour of the ice sheets.

With colleagues from the UK and US, we undertook a new Structured Expert Judgement exercise. With all the new research, data and knowledge, you might expect the uncertainties around how much ice sheet melting will contribute to sea level rise to have got smaller. Unfortunately, that’s not what we found. What we did find was a range of future outcomes that go from bad to worse.

Reconstructed sea level for the last 2500 years. Note the marked increase in rate since about 1900 that is unprecedented over the whole time period. Robert Kopp/Kopp et al. (2016).


Rising uncertainty

We gathered together 22 experts in the US and UK in 2018 and combined their judgements. The results are sobering. Rather than a shrinking in the uncertainty of future ice sheet behaviour over the last six years, it has grown.

If the global temperature increase stays below 2°C, the experts’ best estimate of the average contribution of the ice sheets to sea level was 26cm. They concluded, however, that there is a 5% chance that the contribution could be as much as 80cm.

If this is combined with the two other main factors that influence sea level – glaciers melting around the world and the expansion of ocean water as it warms – then global mean sea level rise could exceed one metre by 2100. If this were to occur, many small island states would experience their current once-in-a-hundred–year flood every other day and become effectively uninhabitable.

A climate refugee crisis could dwarf all previous forced migrations. Punghi/Shutterstock

For a climate change scenario closer to business as usual – where our current trajectory for economic growth continues and global temperatures increase by 5℃ – the outlook is even more bleak. The experts’ best estimate average in this case is 51cm of sea level rise caused by melting ice sheets by 2100, but with a 5% chance that global sea level rise could exceed two metres by 2100. That has the potential to displace some 200m people.

Let’s try and put this into context. The Syrian refugee crisis is estimated to have caused about a million people to migrate to Europe. This occurred over years rather than a century, giving much less time for countries to adjust. Still, sea level rise driven by migration of this size might threaten the existence of nation states and result in unimaginable stress on resources and space. There is time to change course, but not much, and the longer we delay the harder it gets, the bigger the mountain we have to climb.


Click here to subscribe to our climate action newsletter. Climate change is inevitable. Our response to it isn’t.The Conversation

This blog was written by Cabot Institute member Jonathan Bamber, Professor of Physical Geography, University of Bristol and Michael Oppenheimer, Professor of Geosciences and International Affairs, Princeton University.  This article is republished from The Conversation under a Creative Commons license. Read the original article.

Environments without Borders

The effects of climate change vary hugely across political borders, and have wide-ranging impacts on different communities and environments. Climate policy responses must recognise this global interconnectedness, and integrate international cooperation with effective
local action. This is why global treaties such as the Paris Agreement are so important in the fight against climate change, but individual nations must also do their bit to achieve the objectives set out in the agreement. In Environments without Borders  (part of Research Without
Borders), a panel debate hosted by Bristol Doctoral College and the Cabot Institute on Wednesday 10th May, we will discuss some of these issues, using examples from our research on particular challenges facing our global ocean and water environments.


Iceberg photo taken on a research trip to Antarctica, by
Eric Mackie

Rising Sea Levels

Many climate change impacts require a policy response that balances mitigation with adaptation. Mitigation, by reducing global greenhouse gas emissions to achieve a zero-carbon economy, can drastically reduce some of the worst effects of climate change. However, we are already committed to certain climate change impacts, and these will require humanity to adapt. Sea level rise is a prime example. Global sea level has already risen 20cm since 1900, and the rate of sea level rise is increasing. We know this trend will continue throughout the 21st century and beyond, but the question is, how much will sea level rise, and how fast?
Projections of global sea level rise by 2100 range from a further 30cm, assuming drastic mitigation action, to 1m or more in “business-as-usual” scenarios with increasing carbon emissions. Cutting carbon emissions can hugely reduce the number of people at risk of displacement by sea level rise globally, from up to 760 million in a scenario with 4°C of warming, down to 130 million if warming is limited to 2°C in line with the Paris Agreement. Mitigation is therefore essential if we want to avoid the worst effects, but adaptation is also necessary to ensure humanity is resilient to sea level rise that is already locked in.
A coastal scene taken on a research trip in the South
Pacific, by Alice Venn

Disappearing Islands

The South Pacific is home to some of the world’s states most vulnerable to climate change impacts. Sea-level rise threatens coastal erosion, the widespread displacement of people and the inundation of the lowest-lying islands in Tuvalu, Kiribati and the Marshall Islands, while oceanic warming and acidification threaten the livelihoods of many remote coastal communities. More intense tropical cyclones, Cyclone Pam in 2015 and Winston in 2016, have recently resulted in tragic losses of life and damages in excess of $449 million and $470 million respectively. The devastation facing Small Island Developing States in the region, when juxtaposed with their negligible contribution to global greenhouse gas emissions which is estimated at just 0.03%, serves to illustrate the need for the international community to urgently step up efforts to provide support. Enhanced financial assistance for adaptation is essential, however this must be accompanied by strengthened legal protection for communities, readily accessible compensation for loss and damage, capacity building and a strengthened role for civil society organisations giving voice to community needs and traditional knowledge in policy-making processes.
The Lion Fish is an example of an aggressive invasive fish
in the Caribbean Sea, and has had an impact over native species, ecosystems and
local economies.

Invasive Aliens

Biodiversity in water environments can be adversely affected by invasive fish species, which originate from different sources, including marine ballast, fisheries improvements, and aquaculture. Invasive fish species can cause environmental concerns such as changes in the nutrients cycle, transmission of diseases, competence for resources, displacement and extinction of native species. Success in the establishment of invasive species depends on propagule size, physiology of the proper species, and current biotic and abiotic factors in the invaded system. Invasive species represent a global issue, and when combined with climate change their effects can be sharpened. Some limiting abiotic factors are expected to change as the climate changes, favouring new invasions and the spread of established invasive species to new ranges. Milder winters in northern latitude lakes, worldwide flooding and salinisation of coastal freshwater systems will provide suitable thermal conditions, new pathways for escape and dispersion, and the increase in dominance by invasive fish species adapted to brackish water systems. Deficient planning for future responses in water management can also result in favourable conditions for dispersion of undesirable aquatic organisms. For example, this is the case with the Nile tilapia, an invasive species in tropical ecosystems of southern Mexico and Tanzania, where flooding causes its dispersion but alternative management policies could improve the situation. More information see the Invasive Species Specialists Group.


Sustainable Resource Management

Against the backdrop of climate change, which will exacerbate the impact of human activities on natural resources, today’s environmental challenges require above all a strong and consistent commitment by national governments to better implement ambitious environmental policies that they previously adopted. However, traditional decision making approaches often are not equipped to ensure that precious resources are protected, if not enhanced. Sustainable management of natural resources is without doubt complex and creates conflicts between users that compete for access. For instance, there still seems to be too great a divide between the environmental and the business sector and these policy domains are as yet not fully integrated. Nonetheless, there are good examples of governments (and sub-national governments) that were successful in getting all key policy sectors on board when implementing difficult and ambitious environmental policies. For instance, the Scottish Government’s approach in implementing the Water Framework Directive demonstrates that with a strong political commitment, coupled with very proactive efforts in balancing the decision making towards more inclusive and cooperative policy processes, and with an intense and systematic use of evidence to back up policy proposals, it is possible to build trust between sectors and to act upon the barriers to implementation.

It’s clear that each of these challenges requires imminent action, but what are the right approaches, actors, and requirements to make meaningful progress? Whether you’re a member of the public, a policy maker, or someone working in the field, we invite you to join us at the Environments without Borders event on Wednesday 10 May for a lively and provocative debate about the challenges we face and how, collectively, we can spur action for change.
Blog authors (and panel members): Laura De Vito is a postgraduate researcher in the School of Geographical Sciences. Carlos Gracida Juarez is a postgraduate researcher in the School of Biological Sciences. Alice Venn is a postgraduate researcher in the School
of Social Sciences and Law. Erik Mackie is a postgraduate researcher in the School of Geographical Sciences, working together with the British Antarctic Survey, and kept up a blog during his recent fieldwork in Antarctica. Blog originally posted on the Policy Bristol Blog.

Uncertain World: Understanding past and future sea level rise

A recent study published in Science Advances suggests that if we burn all attainable fossil fuels (up to 12,000 gigatonnes of carbon), the Antarctic ice sheet is likely to become almost ice-free within 10,000 years. However, what does this mean in terms of sea level rise? To illustrate this we have designed an infographic which shows the likely extent of sea level rise under a range of different scenarios. We have chosen to use the Wills Memorial Building as an example and assume, for the purpose of this exercise, that it resides at sea level (Figure 1).

1) Sea level rise over the next century:

The most recent report by the Intergovernmental Panel on Climate Change (IPCC AR5) indicates that if we continue emitting greenhouse gases under business-as-usual scenarios (i.e. no reduction in emissions), it is likely that global mean sea level will rise between 0.52 and 0.98 m by the year 2100. If we are more optimistic, and we allow greenhouse gas emissions to peak in 2040 and decline thereafter, the range of likely global mean sea level rise is lower, but not insignificant (0.36 to 0.71 m). Both of these estimates are illustrated below and shown alongside the Wills Memorial Building.

Figure 1: An infographic showing the approximate height of sea level rise depending upon a range of different scenarios (Fretwell et al., 2013; IPCC AR5). This assumes the Wills Memorial Building resides at sea level

Although ~30 to 100 cm of sea level rise may seem insignificant, it is worth considering what this means for other regions. For example, “…since 80% of its 1,200 islands are no more than 1m above sea level“, sea level rise has the potential to impact up to 360,000 citizens and lead to widespread migration.

The reason that scientists provide a range of values for sea level rise is that the climate system is very complex. For example, under low emissions scenarios, there is expected to be an increase in moisture content around Antarctica, leading to increased snowfall along the ice sheet margins. However, under higher emissions scenarios, ice sheet discharge overcompensates for an increase in snowfall, leading to a net sea level rise.

2) Sea level rise over 10,000 years:

The variations between these two emission scenarios are less important when looking over longer timescales. Winklemann et al. (2015) have recently simulated changes in the Antarctic ice sheet over the next 10,000 years using a combination of climate and ice sheet models. From these experiments, it is clear that ice loss is driven by two key feedback mechanisms. The first begins with warming and subsequent retreat of the grounding line (Figure 2). The grounding line is the region where ice transitions from a grounded ice sheet to a freely-floating ice shelf. When the grounding line retreats to a point where the ice sheet falls below sea level, then ice sheets can become unstable.

Figure 2: A schematic of an ice sheet showing the position of the grounding line (bottom right). Image credit: www.AntarcticGlaciers.org.

Winklemann et al. (2015) argue that the West Antarctic Ice Sheet (WAIS) becomes unstable when cumulative carbon emissions reach 600 to 800 gigatonnes of carbon (this is equivalent to a 2 degree rise in temperature by 2100). If this part of the Antarctic Ice Sheet becomes unstable, we can expect ~4 m of global sea level rise (Figure 1).Once a specific temperature is reached, a second feedback then kicks in. This destabilises the rest of the Antarctic ice sheet via the so-called surface elevation feedback. On the timescale of 10,000 years this will eventually lead to an almost ice-free Antarctica (Winklemann et al. 2015).

Figure 3: Predicted ice-sheet loss on Antarctica under different carbon emission pathways (Winkelmann et al., 2015: Science Advances).

3) Sea level rise over millions of years:

Palaeoclimatologists can provide insights into the fate of ice sheets over longer timescales. For example, the last time Antarctica was ice-free was during the early Eocene (~56 to 48 million years ago). During this interval, carbon dioxide concentrations were much higher and allowed the development of lush, tropical rainforests along the ancient coastline (Figure 4). Gradual cooling over millions of years eventually culminated in the sudden and rapid establishment of ice-sheets on Antarctica. This occurred ~34 million years ago and was likely driven by a reduction in carbon dioxide (and perhaps some other feedback mechanisms). Although Antarctica has fluctuated in size since then, it has never been completely ice-free since the Eocene. However, under rising carbon emissions, we are rapidly returning to a world that has not been seen for at least 34 million years.

Figure 4: This may be what the East Antarctic coastline looked like during the early Eocene (Pross et al., 2012).

Further reading:

  • www.AntarcticGlaciers.org
  • Fretwell et al. 2013. Bedmap2: improved ice bed, surface and thickness datasets for Antarctica. The Cryosphere. v. 7.
  • Winkelmann et al. 2015 Combustion of available fossil fuel resources sufficient to eliminate the Antarctic Ice Sheet. Science Advances, v.1.
  • Bamber et al., 2009. Reassessment of the Potential Sea-Level Rise from a Collapse of the West Antarctic Ice Sheet. Science. v. 324
  • Church et al. 2013.  Sea Level Change. In: Climate Change 2013: The Physical Science Basis. Contribution of Working Group I to the Fifth Assessment Report of the Intergovernmental Panel on Climate Change. Cambridge University Press, Cambridge, United Kingdom and New York, NY, USA (see Chapter 13; Table 13.5, p. 1182 for 21st Century sea-level rise estimates).
  • Pross et al., 2012. Persistent near-tropical warmth on the Antarctic continent during the early Eocene epoch. Nature. v. 488.

n.b. As with the IPCC, we occasionally use the following terms to indicate the assessed likelihood of an outcome or a result. These are noted in italics: Virtually certain 99–100% probability, Very likely 90–100%, Likely 66–100%, About as likely as not 33–66%, Unlikely 0–33%, Very unlikely 0–10%, Exceptionally unlikely 0–1%.

——

Correction: the original post incorrectly stated that “… more than 80% of the Maldives lie one metre below sea level”. This has since been amended. Thanks to @radicalrodent for spotting this.
——

This blog was written by Gordon Inglis (@climategordon), a palaeoclimatologist working in the Organic Geochemistry Unit within the School of Chemistry. The infographic was created by Catherine McIntyre (@cathmci), an organic geochemistry PhD student working in same group.

The controversy of the Greenland ice sheet

I was expecting a dusty road, a saloon door swinging, two geologists standing facing each other in spurrs and cowboy hats with their hands twitching at their sides, both ready to whip out their data and take down their opponent with one well-argued conclusion.

Sadly (for me), things were much more friendly at Professor Pete Nienow‘s seminar in Bristol’s Geographical Sciences department last week. Twelve years ago he visited the University with a controversial hypothesis, causing considerable debate with members of the department. Now he was back, Powerpoint at the ready, to revisit the theory.

Professor Nienow is a glaciologist at the University of Edinburgh. He is currently researching glacial movement and mass in Greenland, but I’ll let him tell you more.


Pete Nienow – GeoScience from Research in a Nutshell on Vimeo.

The Greenland ice sheet covers almost 80% of the country, enclosed by mountains around its edges. The ice sheet is dynamic; glaciers are constantly moving down from the summit towards the sea but replaced each winter by snow. Glaciers are funnelled through the mountains in large “outlet glaciers” that either melt or break into icebergs when they reach the sea.

There is plenty of evidence to suggest that the outlet glaciers are speeding up, rushing down to meet the sea almost twice as fast as they did in the 1970s. Unfortunately that means more melting icebergs floating around, contributing to sea level rise. The winter snowfall is not able to replenish this increased loss of glacial mass, so the Greenland ice sheet is slowly shrinking.

Coverage of the Greenland ice sheet in different future climate change scenarios. A critical tipping
point could be reached, after which it will be impossible to stop the ice from melting and raising sea
levels by seven metres globally.  Source: Alley et al., 2005 (Science)

Controversy

Professor Nienow stirred up a debate in 2002, when he proposed that the Zwally Effect could be hugely important for the Greenland ice sheet. This theory suggests that meltwater could seep down through the glacier to the bedrock, lubricating and speeding up the glacial movement.

The conventional wisdom of the time was that it would be impossible for meltwater to pass through the 2km of solid ice that comprises most of the Greenland ice sheet. The centre of the glacier is around -15 to -20°C, so the just-above-freezing water would never be able to melt its way through.

Meltwater research

Meltwater on glaciers often pools on the surface, creating supraglacial lakes. These lakes can drain slowly over the surface, but Professor Nienow found that they can disappear rapidly too. The water slips down through cracks in the ice to the bedrock, leading to a rapid spike in the amount of meltwater leaving the glacier.

Supraglacial lake.
Source: United States Geological Survey, Wikimedia Commons

Meltwater can reach the base of the glacier so that’s one point to Nienow, but can this actually affect the movement of the glacier?

During the summer, the higher temperatures lead to increased glacial melting, which drains down to the bedrock. This raises the water pressure under the glacier, forcing it to slide more rapidly.  Interestingly, as the season progresses, Nienow found that the meltwater forms more efficient drainage channels beneath the glacier, stabilising the speed of the ice.

Nienow was almost ready to mosey on back to Bristol, show them how subglacial meltwater had clear implications of glacier loss for a warmer world, and declare himself the Last Geologist Standing.

Turning point

Glaciologists had always assumed that the winter glacier velocity was consistently low. However, at the end of a very warm 2010, Nienow and his colleagues discovered a blip of especially low speeds, even slower than the standard winter “constant”.

The large channels underneath the glaciers formed by the extra meltwater of that hot year actually reduced the subglacial water pressure during the winter, slowing the glacier more than on a normal year. Nienow found that this winter variability is critical for overall glacier velocity and displacement. In 2010, the net effect of both summer and winter actually meant that the glacier velocity was reduced in this hot year.

Back to Bristol

Nienow returned to Bristol to give his seminar. Somewhat unlike a cowboy film, Nienow concluded that it was a draw; he’d been right that it was possible for meltwater to seep down to the bedrock and lubricate glacial movement, but his friends at Bristol had been correct in thinking that it wasn’t very important in the grand scheme of things.

A collaborative paper between Professor Nienow, the Bristol team and other glaciologists from around the world found that subglacial meltwater will only have a minor impact on sea level rise, contributing less than 1cm of water globally by 2200.  Surface run off and the production of icebergs will continue to play a bigger role, even in a warming world. The computer models used to predict sea level rise will be able to include these findings to give a more accurate insight into future glacier movement and coverage across Greenland and beyond.

Bristol glaciologist Dr. Sarah Shannon, lead author on the paper, pointed out that whilst overall glacier velocity is unlikely to be affected by subglacial meltwater in warm years, “global warming will still contribute to sea level rise by increasing surface melting which will run directly into the ocean”.

This blog is written by Sarah Jose, Cabot Institute, Biological Sciences, University of Bristol
You can follow Sarah on Twitter @JoseSci

Sarah Jose