Back on dry land after seven-and-a-half weeks at sea, the sights of the Southern Ocean are already drifting from my mind into the whirlwind of modern life. The threats of land-sickness never materialised and the taste of fresh fruit and vegetables is everything I hoped it would be. Reflecting on a research cruise is not dissimilar to reflecting on a PhD.
“We only remember half”
Looking back can be a glorious thing. We all know the benefits that hindsight can bring. There are few things in our lives we couldn’t improve, whether they be things we said, research we carried out or ideas we had, if we got but one trial run at everything first. But looking back also gives the past a magical quality. The vividness of a blue sky intensifies, the significance of a rare sight swells and all the hardships are suppressed into one dense ball that our mind tries not to remember. The retelling of tales reconsolidates the good memories at the expense of the bad.
Of course this isn’t always the case and, if we really take the time, all of the gory details can be unpacked. I’m reading an amazing book at the moment, The Worst Journey in the World by Apsley Cherry-Garrard, that gives the most warts-and-all description of early Antarctic exploration. His descriptions are detailed, his wit hilarious and his tale harrowing. He is one of three who dragged two sleds to an emperor penguin colony in the heart of the Antarctic winter, being physically frozen into their clothes, losing their tent to a blizzard and of course getting plenty of frostbite. They did this just to collect three penguin eggs for science, as they hoped the embryos could be used to shed light on the evolutionary history of these creatures, which they believed were more primitive than other birds. The following year several of his closest friends died on the return leg of making it to the South Pole with Scott and he had to help recover their bodies.
Needless to say, Apsley didn’t have the greatest time in Antarctica, but still he writes:
Whatever merit there may be in going to the Antarctic, once there you must not credit yourself for being there. To spend a year in the hut at Cape Evans because you explore is no more laudable than to spend a month at Davos because you have consumption … It is just the most comfortable thing and the easiest thing to do under the circumstances.
This book is a definitive grim account of fieldwork and I really had nothing to complain about during our research cruise. To rephrase Apsley:
The [James Clark Ross], as [ships] go, was as palatial as is the Ritz, as hotels go.
A few nods towards monotony in work and some bad nights’ sleep in the previous blog articles in this series are all the negative memories I need to keep, otherwise the rest can go down for the record as one of the most interesting experiences of my PhD.
 |
| Southern Ocean Bridgeman Island Bridgeman Island off the Antarctic Peninsula. The sea was a bit choppy that day, but nothing too major to complain about. |
Questions remain
I have just completed my PhD viva and, pending some minor corrections to my thesis, I have drawn a line under a four-and-a-half-year period of my life. During that time, most of my intellectual energy has gone into trying to understand what Antarctica was like in the past. Despite having been situated more or less in the same position over the South Pole for over 100 million years, this continent twice the size of Australia hasn’t always been the cold, inhospitable place that Apsley and co. experienced so brutally.
Fossils found on the few exposed outcrops of rock around the coast of the continent, on the sub-Antarctic islands and in the Transantarctic mountain range that cuts across between the Weddell and Ross Seas, show that up until relatively recently, diverse vegetation lived on this continent. (By relatively recently, I mean up until potentially 5 million years ago or so.) Definitely up until the end of the Eocene (the period I researched), much of the continent is believed to have been ice free.
The past environment of the Earth can be reconstructed using all sorts of complex chemistry and dating of past rocks and sediments, but the simplest and sometimes most compelling evidence can be those geological indicators that can be seen with the naked eye. Fossilised leaves, branches and seed pods from a variety of Southern Beech, most similar to modern Nothofagus Antarctica, show quite clearly what kind of ecosystem used to exist.
 |
| Nothofagus Antarctica and the Magellanic Forest, Southern Chile: a window into the past environment of Antarctica? |
 |
| Nothofagus Antarctica and the Magellanic Forest, Southern Chile: a window into the past environment of Antarctica? |
Today, Southern Beech forests can be found in Patagonia and other high latitude regions of the Southern Hemisphere. On our one day off we had in Punta Arenas before we set sail, I went with the other researchers from Exeter up into the Magellanic Forest Park just outside the town. As we walked through this ancient forest, snarled up in Old Man’s Beard lichen, with birds singing on a warm, sunny autumn day, I had to think ‘So this is what I (and lots of other people) have said Antarctica might have been like 34 million years ago?’
My research uses climate models to try to understand the processes that could explain the geological evidence of past climate. While there are some things they can help us understand reasonably well, there are other aspects of the Earth system that still remain difficult to explain, even after decades of research. How could the Earth remain warm enough to sustain forests over Antarctica and not freeze up? That is one such question which I can’t definitively answer.
My PhD research also focussed a lot on the importance of deep water formation on the regional temperatures in the Southern Ocean around the end of the Eocene. There could be little fieldwork more relevant therefore than going to try to understand deep water formation occurring around Antarctica today. Through conversations with researchers from all over the UK and beyond on the many long days of the cruise, I got an insight into the uncertainties that still exist in understanding this process today. Compared to the observational data we collected on our cruise, I looked at how the climate model we use compares in how it recreates the present day ocean. While there are some realistic elements, there are also some important differences which have planted future research questions in my brain. If these are the uncertainties in the model for the present day, how uncertain might my simulations of the ancient world be?
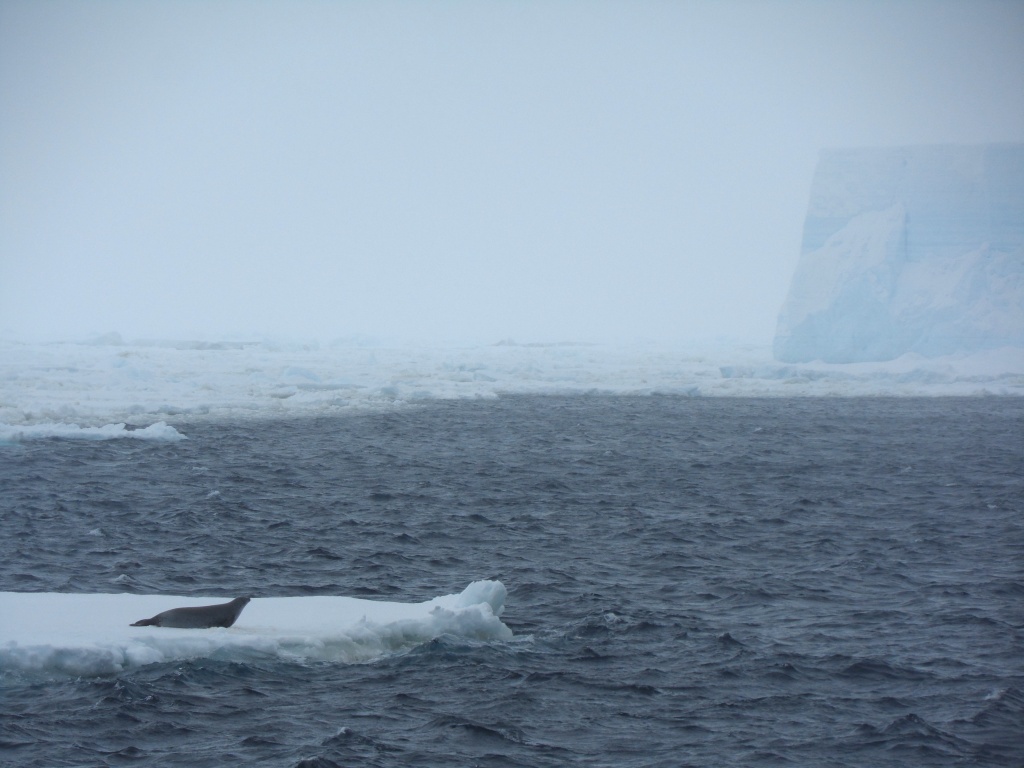 |
| Crabeater seal in Antarctic pack ice. Understanding deep water formation remains challenging, in part because of how extreme the environment is. |
Terra Australis Incognita
Looking back isn’t always easy. The deeper back in time we try to look, the harder it becomes to find data and to synthesise it with our knowledge of how the Earth and its oceans, atmosphere and biology work. In writing my PhD thesis, I had to come to terms with not knowing all of the answers. There are many, many questions that are too big and too complex to solve even with years of effort and 50,000 words. Stepping onto the James Clark Ross reminded me of that fact like a blast of 40 knot southerly Antarctic air to the face.
In the 17th Century, cartographers grappled with their limited understanding of this world, putting together the pieces of information they had and using artistic license to fill in the unmapped gaps that explorers had yet to reach. This map by Blaeu includes the Terra Australis Incognita, or ‘Unknown Southern Land’. While modern science would generally not approve of such guess work, exploring the history of the Earth system is a similar step into the unknown, with geologists, palaeoceanographers and palaeoclimatologists having to build the picture around what limited information they have.
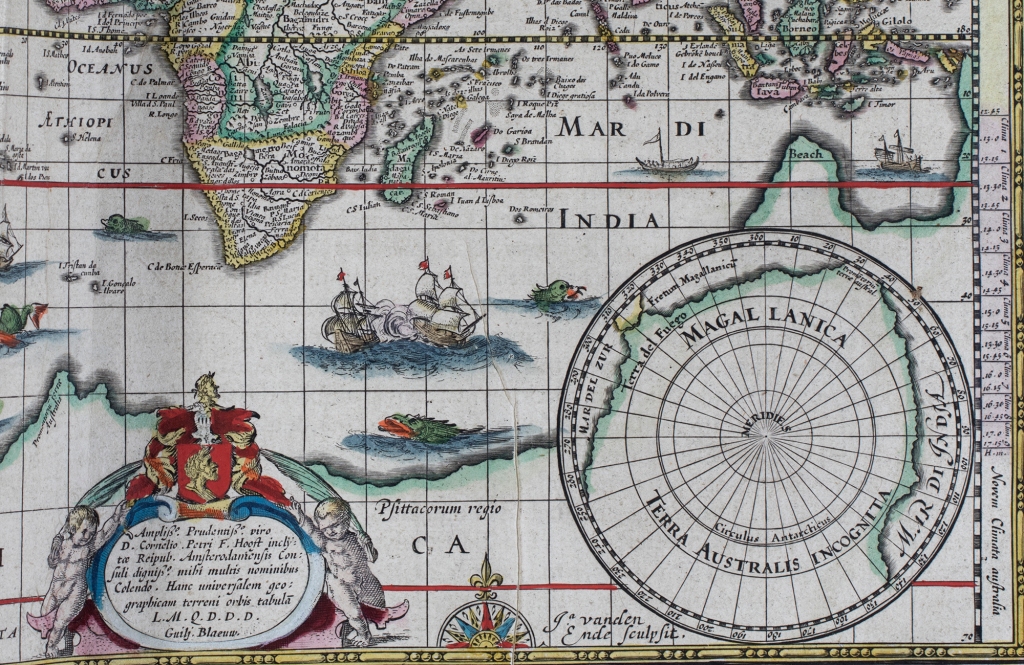 |
| A section of map by Blaeu (1645-1646), showing the as yet uncharted and hence imagined Terra Australis Incognita. Image courtesy of Special Collections, University of Bristol Library. |
From 1646, when Blaeu’s map was published, it was a further 174 years before the first humans saw the Antarctic continent. Now, nearly 200 years on from that first sighting, the Unknown Southern Land still holds many secrets.
Still, looking back also shows how far we have come: a pleasant relief from thinking how far we have yet to go. We know so much more about Antarctica today than we ever have. Unfortunately, with hindsight, Apsley and co.’s journey to find emperor penguin eggs in the middle of winter was a relatively fruitless exercise as the hypothesis they were collecting the eggs to test has since been proven wrong: emperor penguins are actually very specialised and highly evolved birds, not primitive or reptile-like.
Should we give up because we might never know the answers or we might be going down a blind alley? I don’t think so. I’ll give the last words to Apsley, as he really, really earned them.
The question constantly put to us in civilization was and still is: ‘What is the use? Is there gold? Or is there coal? … The members of this expedition believed that it was worthwhile to discover new land and new life, to reach the Southern Pole of the Earth, to make elaborate meteorological and magnetic observations and extended geological surveys … They were prepared to suffer great hardship; and some of them died for their beliefs. …We travelled for science … in order that the world may have a little more knowledge, that it may build on what it knows instead of on what it thinks.
This blog is part of a blog series from Antarctica by Alan Kennedy-Asser, who has recently completed his PhD at the University of Bristol. This blog has been republished with kind permission from Alan. View the original blog. You can follow Alan on Twitter @EzekielBoom.
 |
| Alan Kennedy-Asser |
Read part one of Alan’s Antarctica blog series – Antarctica: Ship life
Read part two of Alan’s Antarctica blog series – Antarctica: Why are we here again?
Read part three of Alan’s Antarcica blog series: Antarctica: Looking back


