New research by Cabot Institute members reveals super eruptions more frequent than previously thought

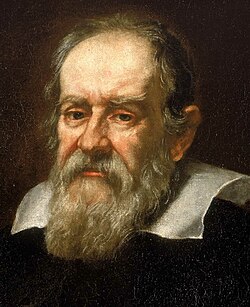
Toba supervolcano – image credit NASA METI AIST Japan Space Systems, and U.S. Japan ASTER Science Team

I’m sat in my office in the Earth Sciences department reading a research paper entitled ‘The global magnitude-frequency relationship for large explosive volcanic eruptions’. Two lines in and I can already picture the headlines: ‘APOCOLYPTIC VOLCANIC ERUPTION DUE ANY DAY’ or perhaps ‘MANAGED TO GET OFF BALI? YOU’RE STILL NOT SAFE FROM THE VOLCANOES. The temptation is to laugh but I suppose it’s not actually very funny.

The paper in question, produced by four Bristol scientists and published in Earth and Planetary Science Letters on Wednesday, uses a database of recorded volcanic eruptions to make estimates about the timing of large world-changing eruptions. It is the first estimate of its kind to use such a comprehensive database and the results are a little surprising.

In case you’re in a rush, the key take-home message is this…

When it comes to rare volcanic eruptions, the past is the key to the future. Volcanoes have erupted in the past. A lot. These past eruptions establish a pattern, which, assuming nothing has changed, can give us clues about the future. This can be done for a range of eruption sizes, but this paper focusses on the biggest of the lot. It turns out they have happened more frequently than previously thought. Yes, it’s surprising. No, you don’t need to worry.

Here’s how they did it:

In reality, supplying the kind of information needed for a study like this is an enormous task. Generations of volcanologists have found evidence of volcanic material from thousands of past eruptions scattered all over the world. Key bits of information on these eruptions has been collected across many years by hundreds of geologists and collated in one place called the LaMEVE database 
The database essentially turns each volcanic eruption into a statistic based on when it erupted and the eruption size. These statistics are the fuel for the study by statistician Prof Jonty Rougier and three volcanologists (and Cabot Institute members), Prof. Steve Sparks, Prof. Katharine Cashman and Dr Sarah Brown.  
The paper highlights that overwhelming majority of these eruptions have been fairly small (think Eyjafjallajökull*, think Stromboli), a smaller proportion have been a bit more lively (heard of Krakatau? Mount St. Helens?) and a really very tiny proportion are so big they might be described as ‘civilisation ending’ if they occurred today. I can’t give a well-known example of one of these as we, fairly obviously, haven’t had one in human timescales. 
Mount St Helens. Credit: Keri McNamara.
To give you a flavour, here are some statistics from the Toba super-eruption that occurred about 75 thousand years ago. The eruption produced a minimum of 2800kmof material.That is equivalent to covering the entire area of the UK in a 12-meter-thick layer of volcanic material, or filling the O2 arena a million times. It is thought the corresponding ash and aerosols that circled the earth cooled the surface temperature by between 3 and 10oC. The reduction in the sun’s radiation would see the death of the majority of plant species, and consequently human’s primary food source.  
 
It paints a rather grim picture. The alarming part of the new study is that eruptions such as Toba might not be as rare as previously thought. Earlier reports have suggested that these eruptions occur every 45-714 thousand years. The new paper revises this range down to 5.2 -48 thousand years with a best guess of one every 17 thousand years. According to geological records, the most recent super eruptions were between 20 and 30 thousand years ago (Taupo 25 ka, Aira 27 ka).
 
Given that humans started to use agriculture around 12 thousand years ago, it seems as though our modern civilization has flourished in the gap between super eruptions. As Prof.Rougier commented: “on balance, we have been slightly lucky not to experience any super-eruptions in the last 20 thousand years.” A little scary perhaps? 

Here’s why you shouldn’t worry:

The really important part of all this is uncertainty.There is a huge amount of statistical leeway either side of these estimates.
Trying to put an exact number on the recurrence interval of something so naturally complex is a bit like trying to estimate the final score of a football match without knowing exactly who the players are. You know how well the team has performed in the past, but you don’t know who will play in the future, or if the same player will behave the same way in every game. There are
also a whole range of things that could happen but probably won’t – perhaps the whole match will get rained off? 
 
 
Volcanoes aren’t much different. Just because a volcano has exhibited one pattern in the past, doesn’t necessarily mean it will do the same in the future. Volcanic systems are infinitely complicated and affected by a huge range of different variables. Assuming perfect cyclicity in eruption recurrence intervals just isn’t realistic. As Prof. Rougier said ‘It is important to appreciate that the absence of super-eruptions in the last 20 ,000 years does not imply that one is overdue.  Nature is not that regular.’ 
On top of that, our records of volcanic eruptions in the past are far from perfect. Sizes of prehistoric eruptions are easily under or overestimated, and some are simply missing from the record. Generally, the further you go back in time, the hazier it gets. While Rougier and his co-authors have done their best to account for these uncertainties, it is impossible to do so completely.  
If that wasn’t enough to put your mind at rest, it is important to remember that geological timescales are a lot bigger than human ones. Whether a volcano erupts every 200 thousand years or 202 thousand years is a very small difference in the context of a volcano’s period of dormancy.
But the extra few
thousand years encompasses the last two millennia and the
hundreds of human generations that have lived within it. 
 
When it comes down to it, the real risks from volcanoes come not from the super-eruptions, but from the smaller, frequent, more locally devastating eruptions. Ultimately, when volcanoes like Agung in Bali erupt, it isn’t us who will suffer. It is those who depend on the volcano for their homes and livelihood who will have to uproot and leave. The real value in this research is not in scare mongering, or in a dramatic headline, it’s developing new techniques that further our understanding of these unpredictable natural phenomena.  


(*Remember
in 2010 when a volcano in Iceland erupted and shut European airspace?
Eyjafjallajökull: Pronounced ‘eye-
yafiyat-la-yerkitle in case anyone’s interested) 
 

Read the original press release Time between world-changing volcanic super-eruptions less than previously thought


—————————————–
This blog is written by Keri McNamara: Cabot Institute writer and geologist in the School of Earth Sciences at the University of Bristol. Keri’s current research looks at using ash layers to improve records of volcanism in the central Main Ethiopian Rift.

Keri McNamara

To read more about the Cabot Institute’s Research, you can subscribe to this blog, or subscribe to our weekly newsletter

Deploying and Servicing a Seismic Network in Central Italy

From a scientific point of view, the seismicity that is hitting Central Italy presents itself as an unmissable opportunity for seismologists to analyse the triggering and the evolution of an earthquake sequence. From the tens of instruments installed in the affected area, a huge amount of data is being collected. Such a well-recorded sequence will allow us to produce a comprehensive seismic catalogue of events. On this big quantity of data, new algorithms will be developed and tested for the characterisation of even the smallest earthquakes. Moreover, they will enable the validation of more accurate and testable statistical and physics-based forecast models, which is the core objective of my Ph.D. project.
Seismicity map of the Amatrice-Norcia sequence updated 5 November 2016.
The Central Apennines are one of the most seismically hazardous areas in Italy and in Europe. Many destructive earthquakes have occurred throughout this region in the past, most recently the 2009 MW = 6.4 L’Aquila event. On August 24th, just 43 km North of the 2009 epicentre, an earthquake of magnitude 6.0 occurred and devastated the villages of Amatrice and Accumuli, leading to 298 fatalities, hundreds of injured and tens of thousands people affected. The mainshock was followed, in under an hour, by a MW = 5.4 aftershock. Two months later, on October 26th, the northern sector of the affected area was struck by two earthquakes of magnitude 5.4 and 5.9, respectively, with epicentres near the village of Visso. To make things even worse, on October 30th the city of Norcia was hit by a magnitude 6.5 mainshock, which has been the biggest event of the sequence to date and the strongest earthquake in Italy in the last 36 years. Building collapses and damages were very heavy for many villages and many historical heritage buildings have reported irreparable damages, such as the 14th century St. Benedict cathedral. Luckily, the has been no further fatalities since the very first event of August 24.
St. Benedict cathedral (Norcia), erected in the late 14th century and completely destroyed after the Mw 6.5 earthquake of October 30th.
Immediately after the first big event, an emergency scientific response team was formed by the British Geological Survey (BGS) and the School of GeoSciences at the University of Edinburgh, to support the rapid deployment of high-accuracy seismometers in collaboration with the Istituto Nazionale di Geofisica e Vulcanologia (INGV). The high detection capabilities, made possible by such a dense network, will let us derive a seismic catalogue with a great regional coverage and improved magnitude sensitivity. This new, accurate, catalogue will be crucial in developing operational forecast models. The ultimate aim is to understand the potential migration of seismic activity to neighbouring faults as well as the anatomy of the seismogenic structure and to shed light into the underlying physical processes that produce the hazard.
Thanks to the quick response of the National Environmental Research Council (NERC) and SEIS-UK, 30 broadband stations have been promptly dispatched from Leicester and arrived in less than 48 hours in Rome. There, a group of 9 people composed by INGV and BGS seismologists, technicians and Ph.D. students (including myself) from University of Bristol, Dublin Institute for Advanced Study (DIAS) and University of Ulster were ready to travel across the Apennines to deploy this equipment. The first days in Rome were all about planning; the location of each station was carefully decided so as to integrate the existing Italian permanent and temporary networks in the most appropriate way. After having performed the ‘huddle test’ in the INGV, which involves parallel checking of all the field instrumentation in order to ensure its correct functioning, we packed all the equipment and headed to the village of Leonessa, a location considered safe enough to be used as our base camp (despite the village being damaged and evacuated after the 30th October event).
Preparing instrumentation for the huddle test in one of INGV’s storage rooms.
In order to optimise time and resources, and to start recording data as soon as possible, we decided to split in 3 groups so that we could finish our work between the end of August and the first week of September. Each seismic station is composed of a buried sensor, a GPS antenna, a car battery, a regulator and two solar panels. The current deployment will stay for 1 year and will be collecting data continually. Each sensor had to be carefully buried and levelled to guarantee the highest quality of recording, which was a strenuous challenge when the ground was quite rocky!
Typical setting of our deployed stations. On the left, the buried sensor. Its cables, buried as well, connect it to the instrumentation inside the black box (a car battery, and a regulator). On the right, the solar panel (a second one was added in October service) and the white GPS antenna.
Aside from the scientific value of the expedition, the deployment week was a great opportunity to get to know each other, share opinions, ideas and, of course, get some training in seismology! At the end, we managed to install 24 stations around an area of approximately 2700 km2.
As this type of seismic station didn’t have telemetry, each needed to be revisited to retrieve data. For this purpose, from October 17th, David Hawthorn (BGS) and I flew to Italy again and stayed there for the following ten days to service the seismometers and to do the first data dump. Our goals were also  to check the quality of the first month of recordings, to add a second solar panel where needed, and to prepare the stations for the forthcoming winter. To do that, a lot of hammering and woodworking was needed. We serviced all the sites, raising the solar panels and GPS antennas on posts, which were securely anchored to the ground, to prevent snow from covering them. The stations were all in good conditions, with just minor damages due to some very snoopy cows.
David Hawthorn (BGS) servicing the stations – A second solar panel was added. Panels and GPS antennas were raised on posts anchored to the ground through timbers.
Dumping data from the stations using a netbook and specific hard drive.
On October 26, just the night before leaving for Rome, we experienced first-hand the frightening feeling of a mainshock just below our feet. Both the quakes of that evening surprised us while we were inside a building; the rumble just few seconds before the quake was shocking and the shaking was very strong. Fortunately, there were no severe damages in Leonessa but many people in the village refused to spend the night in their own houses. Also, it was impressive to see the local emergency services response: only a few minutes after the first quake, policemen were already out to patrol the inner village checking for any people experiencing difficulties.
The small village of Pescara del Tronto suffered many collapses and severe damages after the 24 August earthquakes. View from the motorway above.
Throughout our car transfers from one site to another we frequently found roads interrupted by a building collapse or by a landslide, but we could also admire the mountains with a mantle of beautiful autumnal colours and the spectacular landscapes offered by the Apennines, like the Monte Vettore, the Gran Sasso (the highest peak in the Apennines) and the breath-taking Castelluccio plain near Norcia.
View of the Norcia plain, near to the 24th August magnitude 5.4 and the 30th October magnitude 6.5 epicentres.
View of the Castelluccio plain. This picture was taken from the village of Castelluccio, just 5 days before it was totally destroyed by the magnitude 6.5 mainshock.
From my point of view, I learned a lot and really enjoyed this experience. I feel privileged to have started my Ph.D. in leading institutions like the University of Bristol and the BGS and, at the same time, to be able to spend time in my home country (yes, I am Italian…) with such interesting scientific questions. What I know for sure is that we will be back there again.

Blog written by Simone Mancini, 1st year Ph.D. student, University of Bristol and British Geological Survey.
Measuring our world: Notes from the V.M. Goldschmidt Conference

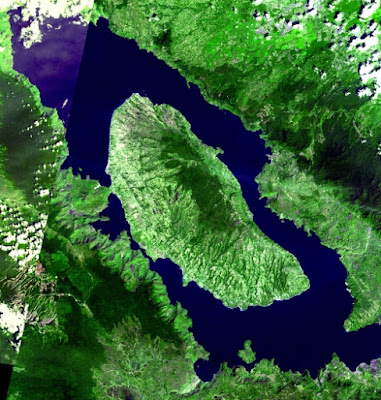
Galileo Galilee
Measure what is measurable, and make measurable what is not so.’ – Galileo Galilee

Science is measuring.

Of course, it is about much more than measuring.  The scientific approach includes deduction, induction, lateral thinking and all of the other creative and logistical mechanisms by which we arrive at ideas. But what distinguishes the ideas of science from those of religion, philosophy or art is that they are expressed as testable hypotheses – and by testable hypotheses, scientists mean ideas that can be examined by observations or experiments that yield outcomes that can be measured.

Earth scientists use astonishingly diverse approaches to measure our world, from the submolecular to the planetary, from bacterial syntrophic interactions to the movement of continental plates. A particularly important aspect of observing the Earth system involves chemical reactions – the underlying processes that form rocks, fill the oceans and sustain life. The Goldschmidt Conference, held this year in Florence, is the annual highlight of innovations in geochemical methodologies and the new knowledge emerging from them.

Geochemists reported advances in measuring the movement of electrons across nanowires, laid down by bacteria in soil like electricians lay down cables; the transitory release of toxic metals by microorganisms, daily emissions of methane from bogs, and annual emissions of carbon dioxide from the whole of the Earth; the history of life on Earth as recorded by the isotopes of rare metals archived in marine sediments; the chemical signatures in meteorites and the wavelengths of light emitted from distant solar nebulae, both helping us infer the building blocks from which our own planet was formed.

******


The Goldschmidt Conference is often held in cities with profound cultural legacies, like that of Florence.  And although Florence’s legacy that is perhaps dominated by Michelangelo and Botticelli, Tuscany was also home to Galileo Galilee, and he and the Scientific Revolution are similarly linked to the Renaissance and Florence. Wandering through the
Galileo Museum is a stunning reminder of how challenging it is to measure the world around us, how casually we take for granted many of these measurements and the ingenuity of those who first cracked the challenges of quantifying time or temperature or pressure.

And it is also exhilarating to imagine the thrill of those scientists as they developed new tools and turned them to the stars above us or the Earth beneath us.  Galileo’s own words tell  us how he felt when he pointed his telescope at Jupiter and discovered the satellites orbiting around it; and how those observations unlocked other insights and emboldened new hypotheses:

‘But what exceeds all wonders, I have discovered four new planets and observed their proper and particular motions, different among themselves and from the motions of all the other stars; and these new planets move about [Jupiter] like Venus and Mercury… move about the sun.’

The discoveries of the 21st century are no less exciting, if perhaps somewhat more nuanced.

******

The University of Bristol is one of the world leaders in the field of geochemistry.  Laura Robinson co-chaired several sessions, while also presenting a new approach to estimating water discharge from rivers, based on the ratio of uranium isotopes in coral; the technique has great potential for studying flood and drought events over the past 100,000 years, helping us to better understand, for example, the behaviour of monsoon systems on which the lives of nearly one billion people depend.  Heather Buss chaired a session and presented research quantifying the nature and consequences of reactions occurring at the bedrock-soil interface – and by extension, the processes by which rock becomes soil and nutrients are liberated, utilised by plants or flushed to the oceans. Kate Hendry, arriving at the University of Bristol in October, presented her latest work employing the distribution of zinc in sponges (trapped in their opal hard parts) to examine how organic matter is formed in surface oceans, then transported to the deep ocean and ultimately buried in sediments; this is a key aspect to understanding how carbon dioxide is ultimately removed from the atmosphere.  The Conference is not entirely about measuring these processes – it is also about how those measurements are interpreted. This is exemplified by Andy Ridgwell who presented two keynote lectures on his integrated physical, chemical and biological model, with which he evaluated the evidence for how and when oceans become more acidic or devoid of oxygen.

What next?  Every few years, a major innovation opens up new insights.  Until about 20 years ago, organic carbon isotope measurements (carbon occurs as two stable isotopes – ~99% as the isotope with 12 nuclear particles and ~1% as the isotope with 13) were conducted almost exclusively on whole rock samples. These values were useful in studying ancient life and the global carbon cycle, but somewhat limited because the organic matter in a rock derives from numerous organisms including plants, algae and bacteria. But in the late 1980s, new methods allowed us to measure carbon isotope values on individual compounds within those rocks, including compounds derived from specific biological sources.  Now, John Eiler and his team at Caltech are developing methods for measuring the values in specific parts or even at a single position in those individual compounds within those rocks.  This isotope mapping of molecules could open up new avenues for determining the temperatures at which ancient animals grew or elide what microorganisms are doing deep in the Earth’s subsurface.

Scientists are going to continue to measure the world around us.  And while that might sound cold and calculating, it is not!  We do this out of our fascination and wonder for nature and our planet.  Just like Galileo’s discovery of Jovian satellites excited our imagination of the cosmos, these new tools are helping us unravel the astonishingly beautiful interactions between our world and the life upon it.

This blog was written by Professor Rich Pancost, Cabot Institute Director, University of Bristol

Prof Rich Pancost