Lobbying in ‘forever chemicals’ industry is rife across Europe – the inside story of our investigation

Forever chemical or PFAS contamination is widespread, but so too are lobbying efforts.
Melnikov Dmitriy/Shutterstock

A team of academic researchers, lawyers and journalists from 16 European countries has exposed a huge lobbying campaign aimed at gutting a proposed EU-wide restriction on the use of “forever chemicals”. This campaign saw significant increases in the lobbying expenditure of major producers of perfluoroalkyl and polyfluoroalkyl substances (PFAS), known as forever chemicals for their persistence in the environment.

This expenditure supported many high-level meetings with European Commission officials, as well as efforts to mobilise other industry players in the lobbying campaign to promote voluntary alternatives and substantial exceptions to this proposed restriction. One result was that the European Chemical Agency’s public consultation on the restriction was buried under a deluge of responses to its proposal.

PFAS are a family of thousands of synthetic chemicals that are implicated in a growing number of illnesses and health complications – ranging from liver damage to compromised immune systems. They share a common characteristic: a carbon-fluorine bond – one of the strongest in organic chemistry – which makes PFAS highly persistent, meaning they can bioaccumulate within plants and animals over time.

The sheer number of PFAS means that restricting them as a class, as is being considered by the EU, is regarded as vital by a growing number of scientists . If this proposed restriction fails and PFAS emissions remain unrestricted, the cost of cleaning up ongoing contamination in Europe is estimated to run to €2 trillion (£1.7 trillion) over the next 20 years – an annual bill of €100 billion.

Without a class restriction, the alternative is a case-by-case approach to assessing toxicity. This would not only be very slow, it would increase the risk of just swapping banned PFAS for other ones that haven’t yet been proven to cause harm – known as “regrettable substitution”.

Historically, banning individual PFAS chemicals has led to their replacement with structurally similar compounds that pose similar or unknown risks. A class-based restriction would reduce the likelihood of such substitutions.

As part of a Europe-wide investigation into PFAS called the Forever Lobbying Project, I have been collaborating with 18 academic researchers and lawyers plus 46 investigative journalists, including Stéphane Horel and Raphaëlle Aubert at French newspaper Le Monde, which coordinated the project. By working together, we can reach a much larger audience across Europe and increase awareness of the costs of PFAS to public health and the environment.

Revelations of the major lobbying campaign and the clean-up costs – the first estimate of its kind for Europe – have come out of this collaboration. Our work has been an inventive combination of investigative journalism and social and applied science methodologies, which aim to extend and underpin existing reporting techniques.

labcoat arm shakes arm in dark suit
A new investigation drew on approaches used to measure lobbies in the fossil fuel and tobacco industry.
Ian Hayhurst/Shutterstock

In 2023, many members of the current team had previously mapped PFAS contamination across Europe, making “unseen science” available to the public for the first time. This first investigation, which identified over 23,000 confirmed contaminated sites, was hugely influential, strengthening calls for the current class-based, EU-wide restriction.

But resistance from chemical manufacturers quickly proved to be fierce. And it was the realisation among journalists within the consortium that the chemical industry might defeat the proposed class-based restriction that kickstarted the idea for this latest investigation into the lobbying campaign.

The cost of policy failure

Two questions are central to making sense of the lobbying campaign for the public. What would the bill be for cleaning up ongoing PFAS pollution if the campaign is successful? And how had the PFAS manufacturers and plastics industry been able to make so much headway with European officials?

The annual cost estimate of €100 billion was one of several calculated – it relates to ongoing clean-up costs in Europe in the absence of effective restrictions and source control. The process of calculating the costs was overseen by environmental engineer Ali Ling and environmental chemist Hans Peter Arp, who developed a methodology with data journalist Aubert. Together, they advised journalists within the team on which data to look for and actively checked datasets.

The annual cost figure is large – roughly the GDP of Bulgaria – yet represents a conservative estimate, reflecting the difficulties in addressing PFAS decontamination. PFAS chemicals escape most traditional remediation techniques and require highly specialised, energy-intensive technologies to eradicate them. This annual cost will continue as long as PFAS are not phased out and continue to accumulate in the environment.

The lobbying campaign essentially rested on three contentions: that most PFAS were not harmful to health so there was no need for a broad restriction; that there were few practical alternatives to PFAS; and that a broad restriction on their manufacture and use would effectively hollow out the European economy, killing the European green transition.

If the chemical industry were being taken seriously by EU officials, EU policymakers would be more likely to be persuaded by these arguments. So, our consortium decided to look at them more closely and “stress-test” them.

To do this, the team – organised by Horel – adapted approaches used to explore the validity of industry arguments used in tobacco and food policy conflicts. Our results are telling.

Interview with American lawyer Rob Billott, a legal advisor for the Forever Lobbying Project.

The industry association that represents European polymer producers, Plastics Europe, for instance, emphasised the concept of “polymers of low concern” to claim that most fluoropolymers were in fact perfectly safe, or at least highly likely to be safe.

But, as one Le Monde article states: “Plastics Europe declined to share the data, assumptions and methods that underpin its dire predictions.” Plastics Europe also declined interview requests from Le Monde.

Plastics Europe arguably had implied that the concept of polymers of low concern encapsulated criteria developed by the Organisation for Economic Co-operation and Development (OECD). To the casual observer, this association with a respected international policy organisation gave it a measure of validity.

So, we traced the origins of the concept. Yes, there had been an OECD expert group which had “engaged in discussions on criteria for identifying polymers of low concern” between 1993 and 2009. But there had never been enough reliable data for the OECD to commit to the idea as an institution. The OECD confirmed to Horel that “no agreed-upon set of criteria at the OECD level was finalised”.

Other arguments we stress-tested exhibited different weaknesses, but they typically worked to the same effect. Facts and observations were twisted and exaggerated to present a lose-lose or “dystopian” characterisation of the EU proposals – terrible economic losses globally, with no appreciable health or environmental benefits.

As things stand, the EU restriction is finely balanced. Officials within the European Commission have been reported to be “offering reassuring indications to corporate interests about future decision-making”.

By raising important questions about the consequences of not regulating, and highlighting the dubious arguments put forward to justify doing nothing, we hope our latest investigation has shifted the language and focus of public debate. But whether this will displace the current short-termist emphasis on competitiveness and deregulation being pushed by some members of the European Commission remains to be seen.

————————————

This blog is written by Gary Fooks, Professor in Criminology, University of BristolThis article is republished from The Conversation under a Creative Commons license. Read the original article.

Gary Fooks

,

We built an AI model that analysed millions of images of retreating glaciers – what it found is alarming

BEST-BACKGROUNDS / shutterstock / NASA

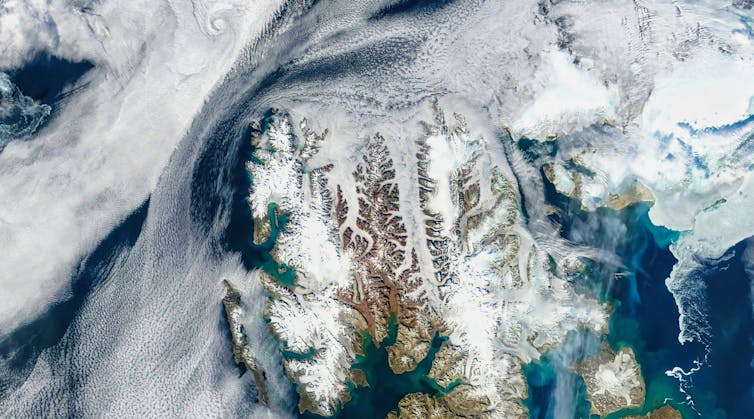
The Arctic has warmed nearly four times faster than the global average since 1979. Svalbard, an archipelago near the northeast coast of Greenland, is at the frontline of this climate change, warming up to seven times faster than the rest of the world.

More than half of Svalbard is covered by glaciers. If they were to completely melt tomorrow, the global sea level would rise by 1.7cm. Although this won’t happen overnight, glaciers in the Arctic are highly sensitive to even slight temperature increases.

To better understand glaciers in Svalbard and beyond, we used an AI model to analyse millions of satellite images from Svalbard over the past four decades. Our research is now published in Nature Communications, and shows these glaciers are shrinking faster than ever, in line with global warming.

Specifically, we looked at glaciers that drain directly into the ocean, what are known as “marine-terminating glaciers”. Most of Svalbard’s glaciers fit this category. They act as an ecological pump in the fjords they flow into by transferring nutrient-rich seawater to the ocean surface and can even change patterns of ocean circulation.

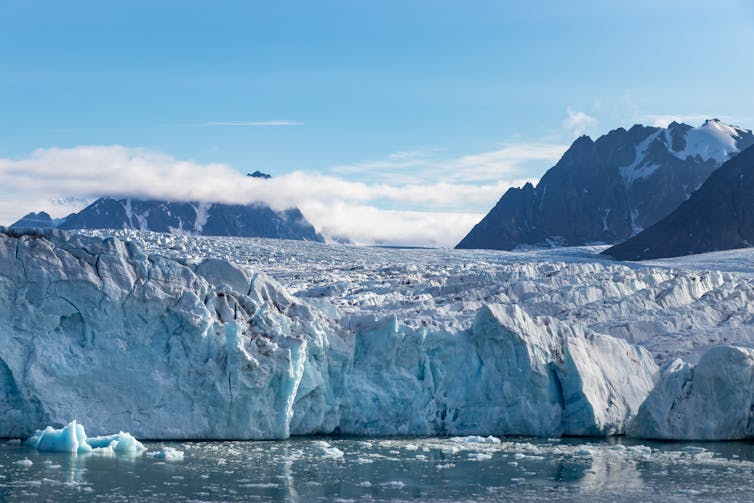
Where these glaciers meet the sea, they mainly lose mass through iceberg calving, a process in which large chunks of ice detach from the glacier and fall into the ocean. Understanding this process is key to accurately predicting future glacier mass loss, because calving can result in faster ice flow within the glacier and ultimately into the sea.

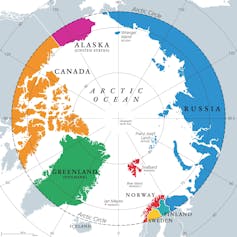
Map of Arctic
Svalbard (in red) belongs to Norway and is one of the northernmost places int he world.
Peter Hermes Furian / shutterstock

Despite its importance, understanding the glacier calving process has been a longstanding challenge in glaciology, as this process is difficult to observe, let alone accurately model. However, we can use the past to help us understand the future.

AI replaces painstaking human labour

When mapping the glacier calving front – the boundary between ice and ocean – traditionally human researchers painstakingly look through satellite imagery and make digital records. This process is highly labour-intensive, inefficient and particularly unreproducible as different people can spot different things even in the same satellite image. Given the number of satellite images available nowadays, we may not have the human resources to map every region for every year.

A novel way to tackle this problem is by using automated methods like artificial intelligence (AI), which can quickly identify glacier patterns across large areas. This is what we did in our new study, using AI to analyse millions of satellite images of 149 marine-terminating glaciers taken between 1985 and 2023. This meant we could examine the glacier retreats at unprecedented scale and scope.

Glacier flows into sea
Svalbard is slightly smaller than Scotland yet has more than 2,000 glaciers.
RUBEN M RAMOS / shutterstock

Insights from 1985 to today

We found that the vast majority (91%) of marine-terminating glaciers across Svalbard have been shrinking significantly. We discovered a loss of more than 800km² of glacier since 1985, larger than the area of New York City, and equivalent to an annual loss of 24km² a year, almost twice the size of Heathrow airport in London.

The biggest spike was detected in 2016, when the calving rates doubled in response to periods of extreme warming. That year, Svalbard also had its wettest summer and autumn since 1955, including a record 42mm of rain in a single day in October. This was accompanied by unusually warm and ice-free seas.

How ocean warming triggers glacier calving

In addition to the long-term retreat, these glaciers also retreat in the summer and advance again in winter, often by several hundred metres. This can be greater than the changes from year to year.

We found that 62% of the glaciers in Svalbard experience these seasonal cycles. While this phenomenon is well documented across Greenland, it had previously only been observed for a handful of glaciers in Svalbard, primarily through manual digitisation.

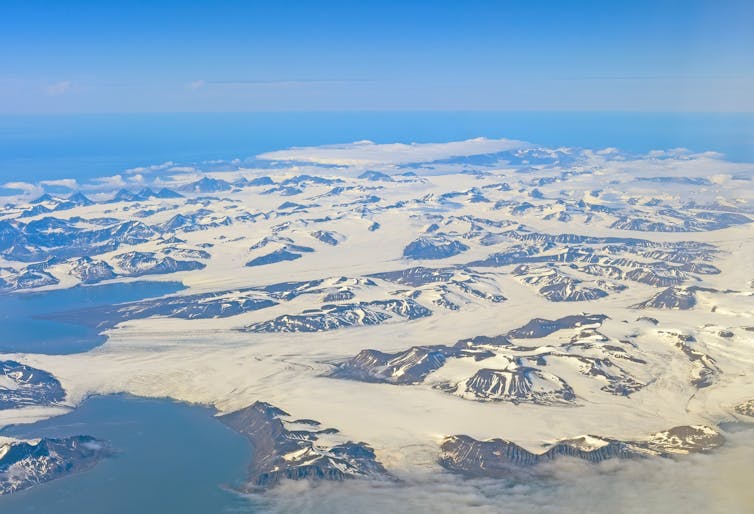
Aerial view of island of mountains and glaciers
Svalbard’s many glaciers grow and shrink with the seasons.
Wildnerdpix / shutterstock

We then compared these seasonal changes with seasonal variations in air and ocean temperature. We found that as the ocean warmed up in spring, the glacier retreated almost immediately. This was a nice demonstration of something scientists had long suspected: the seasonal ebbs and flows of these glaciers are caused by changes in ocean temperatures.

A global threat

Svalbard experiences frequent climate extremes due to its unique location in the Arctic yet close to the warm Atlantic water. Our findings indicate that marine-terminating glaciers are highly sensitive to climate extremes and the biggest retreat rates have occurred in recent years.

This same type of glaciers can be found across the Arctic and, in particular, around Greenland, the largest ice mass in the northern hemisphere. What happens to glaciers in Svalbard is likely to be repeated elsewhere.

If the current climate warming trend continues, these glaciers will retreat more rapidly, the sea level will rise, and millions of people in coastal areas worldwide will be endangered.

———————


This blog is written by Tian Li, Senior Research Associate, Bristol Glaciology Centre, University of Bristol; Jonathan Bamber, Professor of Glaciology and Earth Observation, University of Bristol, and Konrad Heidler, Chair of Data Science in Earth Observation, Technical University of MunichThis article is republished from The Conversation under a Creative Commons license. Read the original article.

Tian Li
Jonathan Bamber
Konrad Heidler

Repression of climate and environmental protest is intensifying across the world

Climate and environmental protest is being criminalised and repressed around the world. The criminalisation of such protest has received a lot of attention in certain countries, including the UK and Australia. But there have not been any attempts to capture the global trend – until now.

We recently published a report, with three University of Bristol colleagues, which shows this repression is indeed a global trend – and that it is becoming more difficult around the world to stand up for climate justice.

This criminalisation and repression spans the global north and south, and includes more and less democratic countries. It does, however, take different forms.

Our report distinguishes between climate and environmental protest. The latter are campaigns against specific environmentally destructive projects – most commonly oil and gas extraction and pipelines, deforestation, dam building and mining. They take place all around the world.

Climate protests are aimed at mitigating climate change by decreasing carbon emissions, and tend to make bigger policy or political demands (“cut global emissions now” rather than “don’t build this power plant”). They often take place in urban areas and are more common in the global north.

Four ways to repress activism

The intensifying criminalisation and repression is taking four main forms.

1. Anti-protest laws are introduced

Anti-protest laws may give the police more powers to stop protest, introduce new criminal offences, increase sentence lengths for existing offences, or give policy impunity when harming protesters. In the 14 countries we looked at, we found 22 such pieces of legislation introduced since 2019.

2. Protest is criminalised through prosecution and courts

This can mean using laws against climate and environmental activists that were designed to be used against terrorism or organised crime. In Germany, members of Letzte Generation (Last Generation), a direct action group in the mould of Just Stop Oil, were charged in May 2024 with “forming a criminal organisation”. This section of the law is typically used against mafia organisations and had never been applied to a non-violent group.

In the Philippines, anti-terrorism laws have been used against environmentalists who have found themselves unable to return to their home islands.

Criminalising protest can also mean lowering the threshold for prosecution, preventing climate activists from mentioning climate change in court, and changing other court processes to make guilty verdicts more likely. Another example is injunctions that can be taken out by corporations against activists who protest against them.

3. Harsher policing

This stretches from stopping and searching to surveillance, arrests, violence, infiltration and threatening activists. The policing of activists is carried out not just by state actors like police and armed forces, but also private actors including private security, organised crime and corporations.

In Germany, regional police have been accused of collaborating with an energy giant (and its private fire brigade) to evict coal mine protesters, while private security was used extensively in policing anti-mining activists in Peru.

4. Killings and disappearances

Lastly, in the most extreme cases, environmental activists are murdered. This is an extension of the trend for harsher policing, as it typically follows threats by the same range of actors. We used data from the NGO Global Witness to show this is increasingly common in countries including Brazil, Philippines, Peru and India. In Brazil, most murders are carried out by organised crime groups while in Peru, it is the police force.

Protests are increasing

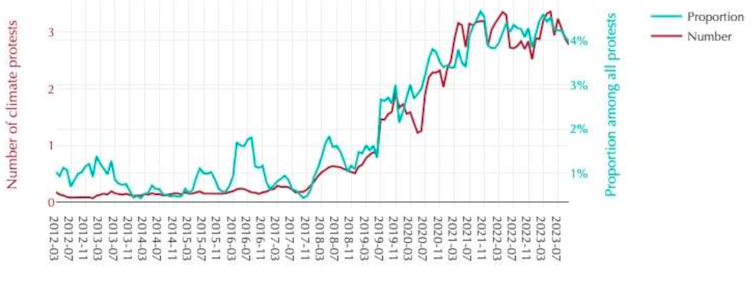
To look more closely at the global picture of climate and environmental protest – and the repression of it – we used the Armed Conflicts Location Event database. This showed us that climate protests increased dramatically in 2018-2019 and have not declined since. They make up on average about 4% of all protest in the 81 countries that had more than 1,000 protests recorded in the 2012-2023 period:

Graph
Climate protests increased sharply in the late 2010s in the 14 countries studied. (Data is smoothed over five months; number of protests is per country per month.)
Berglund et al; Data: ACLED, CC BY-SA

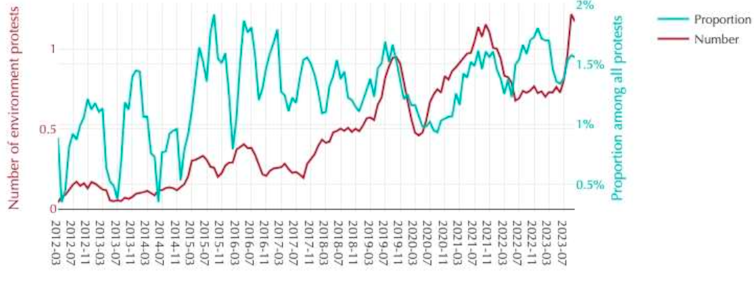
This second graph shows that environmental protest has increased more gradually:

Graph
Environmental protests in the same 14 countries.
Data: ACLED, CC BY-SA

We used this data to see what kind of repression activists face. By looking for keywords in the reporting of protest events, we found that on average 3% of climate and environmental protests face police violence, and 6.3% involve arrests. But behind these averages are large differences in the nature of protest and its policing.

A combination of the presence of protest groups like Extinction Rebellion, who often actively seek arrests, and police forces that are more likely to make arrests, mean countries such as Australia and the UK have very high levels of arrest. Some 20% of Australian climate and environmental protests involve arrests, against 17% in the UK – with the highest in the world being Canada on 27%.

Meanwhile, police violence is high in countries such as Peru (6.5%) and Uganda (4.4%). France stands out as a European country with relatively high levels of police violence (3.2%) and low levels of arrests (also 3.2%).

In summary, while criminalisation and repression does not look the same across the world, there are remarkable similarities. It is increasing in a lot of countries, it involves both state and corporate actors, and it takes many forms.

This repression is taking place in a context where states are not taking adequate action on climate change. By criminalising activists, states depoliticise them. This conceals the fact these activists are ultimately right about the state of the climate and environment – and the lack of positive government action in these areas.The Conversation

——————————————

This blog is written by Cabot Institute for the Environment member, Dr Oscar Berglund, Senior Lecturer in International Public and Social Policy, University of Bristol and Tie Franco Brotto, PhD Candidate, School for Policy Studies, University of Bristol

This article is republished from The Conversation under a Creative Commons license. Read the original article.

(more…)

Climate, migration and conflict mix to create ‘deadly’ intense tropical storms like Chido

Cyclone Chido
Cyclone Chido – image from VIIRS, NOAA

Cyclone Chido was an “intense tropical cyclone”, equivalent to a category 4 hurricane in the Atlantic. It made landfall in Mayotte, a small island lying to the north-west of Madagascar on December 14, generating wind gusts approaching 155mph (250km/hr). Later on, it hit Mozambique, East Africa with the same ferocity.

This storm skirted north of Madagascar and affected the Comoros archipelago before making landfall in Mozambique. It is well within the range of what is expected for this part of the Indian Ocean. But this region has experienced an increase in the most intense tropical cyclones in recent years. This, alongside its occurrence so early in the season, can be linked to increases in ocean temperatures as a result of climate change.

News of the effects of tropical cyclone Chido in Mayotte, Mozambique and Malawi continues to emerge. Current estimates suggest 70% of Mayotte’s population have been affected, with over 50,000 homes in Mozambique partially or completely destroyed.

Ongoing conflict in Mozambique and undocumented migration to Mayotte will have played a key role in the number of deaths and the infrastructure damage.

Assessing how these cyclones characteristics are changing across southern Africa is part of the research we are involved in. Our team also studies how to build resilience to cyclones where conflict, displacement and migration magnify their effects.

A human-made disaster?

The risk that tropical cyclones pose to human life is exacerbated by socioeconomic issues. Migrants on Mayotte, many of whom made perilous journeys to escape conflict in countries such as the Democratic Republic of Congo, now make up more than half of the island’s population.

Precarious housing and the undocumented status of many residents reportedly made the disaster more deadly, as people feared evacuation would lead them to the police. On islands with poor infrastructure such as Mayotte, there is often simply nowhere safe to go. It takes many days for the power network and drinking water supply to be restored.

The situation is particularly complex in Mozambique. The ongoing conflict and terrorist violence, coupled with cyclones, including Kenneth in 2019, has caused repeated evacuations and worsening living conditions. Cabo Delgado and Nampula in the far north of Mozambique, the provinces most affected by both Chido and the conflict, rank among the poorest and most densely populated in the country due to limited education, scarce livelihood options and an influx of people displaced by violence.

As of June 2024, more than half a million people remained without permanent homes in the region, many living in displacement camps. That number is likely to rise significantly after Chido.

Compounding the crisis, Chido’s landfall so early in the cyclone season meant that the usual technical and financial preparations were not yet fully ramped up, with low stock levels delaying the timely delivery of aid. Unrest following elections in November hampered preparations further, cutting the flow of resources and personnel needed for anticipatory action and early response.

Tropical cyclones in a warmer world

Warmer sea surface temperatures not only provide more fuel for stronger storms, but may also expand the regions at risk of tropical cyclones.

The Indian Ocean is warming faster than the global average, and is experiencing a staggering increase in the proportion of storms reaching the intensity of Chido.

Climate simulations predict that storms will continue getting stronger as we further warm our world, and could even lead to an unprecedented landfall as far south as the Mozambican capital, Maputo.

Scientists carry out attribution studies to determine how climate change contributed to specific events. Scientists undertaking rapid attribution studies of Chido have found that the ocean surface temperatures along the path of the storm were 1.1°C warmer than they would have been without climate change. So, temperatures this warm were made more than 50 times more likely by climate change. Another study focusing on Chido itself concluded that the cyclone’s winds were 5% faster due to global heating caused by burning fossil fuels, enough to bump it from a category 3 to a category 4 storm.

Intense winds are not the only hazard. Scientists are confident that tropical cyclones will dump more rain as a result of climate change. A trend towards slower-moving storms has been observed, causing more of that rain to accumulate in a single location, resulting in floods.

Cyclone Freddy delivered a year’s worth of rain to southern Malawi in just four days in March 2023. Storm surges, exacerbated by sea level rise, also raise the scale of flooding, as in the devastating Cyclone Idai in March 2019. An increase in the number of storms that rapidly intensify, as Chido did before landfall in Mayotte has also been linked to climate change, which makes it harder to provide early warnings.

To improve resilience to future cyclones, conflict, migration and social dynamics must be considered alongside climate change, without this, displaced and migrant communities will continue to be the most affected by the risks that climate change poses.

———————————-
This blog is written by Liz Stephens, Professor of Climate Risks and Resilience, University of Reading; Cabot Institute for the Environment member Dan Green, PhD Candidate in African Climate Science, University of Bristol, and Luis Artur, Lecturer and Researcher of Disaster Risk Reduction, Universidade Eduardo Mondlane. This article is republished from The Conversation under a Creative Commons license. Read the original article.