National greenhouse gas reporting needs an overhaul – it’s time to directly measure the atmosphere

Junk Culture / shutterstock

How much greenhouse gas is emitted by any individual country? With global emissions of carbon dioxide hitting a record of 36.8 billion tonnes this year, and delegates gathering in Madrid for the latest UN climate talks, it’s a pressing question.

One might assume that we know precisely how much is emitted by any given country, and that such figures are rigorously cross-checked and scrutinised. And in some respects, this is true – countries are required to report their emissions to the UN, based on exhaustive guidelines and with reams of supporting data.

Yet these reports are based on what are known as inventory (or “bottom-up”) methods. To simplify, this means that governments figure out how much greenhouse gas is emitted by a typical car, cow, or coal plant, and then add up all the cows, cars and so on to get an overall emissions figure.
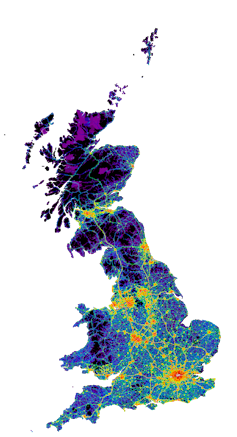
Map showing the UK’s CO2 emissions, calculated using ‘bottom-up’ methods. Daniel Hoare, University of Bristol, © Crown 2019 copyright Defra & BEIS, Author provided.


While this method is essential to understand the make-up of a country’s emissions, it is ultimately reliant on accurate and comprehensive information on economic activity, some compromises to allow standardisation across countries, and some element of trust.
And such reporting can go awry. In 2018 and again earlier this year, colleagues and I made headlines when we first identified mystery emissions of a banned ozone-depleting substance and greenhouse gas and then later tracked its source down to factories in eastern China.


Read more:
How we traced ‘mystery emissions’ of CFCs back to eastern China


The problem is that these “bottom-up” emissions reports do not generally include what some might consider key information: measurements that can indicate the actual amount of greenhouse gas in the atmosphere.

So could new data help us better understand how much we are emitting?

A national greenhouse gas monitoring network

The UK, Switzerland and Australia have pioneered a measurement-based approach to add credibility and transparency to their emissions reports. In 2012, a network of measurement stations was established on telecommunications towers across the UK to sniff out greenhouse gases emitted from around the country.
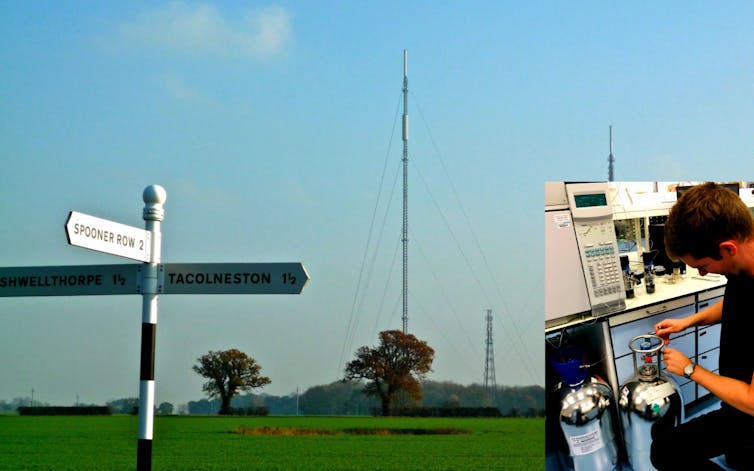
A tower used to sample the greenhouse gases in the air in Norfolk, England. Inset: a researcher working on the project. University of Bristol, Author provided
To interpret these measurements, we use sophisticated computer models that simulate how gases are transported from the surface, through the atmosphere, to the points where they are observed. By comparing the modelled and measured concentrations, we can determine the national emission rate.
These “top-down” estimates, which now form a key part of the UK’s National Inventory Report to the UN, have yielded some surprising insights. Sceptics may suspect that governments would be keen to “hide” emissions from the rest of the world, but in at least one case atmospheric data suggests that the UK has for years actually over-estimated, by around 100%, emissions of a potent greenhouse gas used in car air conditioners (HFC-134a). In contrast, for the major greenhouse gases methane and nitrous oxide, the data in recent years corroborates the UK inventory reports remarkably well.

More questions than answers?

Naturally, once this measurement data is available, new questions emerge. For example, the UK inventory suggests that methane emissions have gradually declined since 1990 but the atmospheric data suggests little trend, if any. This is important, because the UK benchmarks its emissions reductions against the year 1990.

Could this suggest that the country has not been as successful as it thought at reducing methane leaked from landfills, for example? Or have such emissions reductions been offset by some other source? Unfortunately, such questions are difficult to answer using “standard” atmospheric measurement techniques – a molecule of methane emitted from a landfill looks very similar to one from a cow.

Very similar, that is, but not identical. I am involved in a new £3m project called DARE-UK (Detection and Attribution of Regional Emissions in the UK), which looks for tell-tale features that can help us identify where carbon dioxide, methane and nitrous oxide in the atmosphere came from.
One type of signal that we are looking for is a tiny perturbation to the ratio of heavy and light isotopes of methane and carbon dioxide in the air. Isotopes are almost identical to one another but differ in their molecular mass. It turns out that cow burps, for example, emit methane with less of the heavy isotope than similar amounts of methane from a leaky gas boiler. So, we hope that this type of data may help the UK’s inventory team identify which sectors of the bottom-up reports may require re-examination.

We need improved transparency

While these measurements are proving a valuable aid for inventory compilers, their main utility is likely to be in ensuring trust and transparency in the international reporting process. Atmospheric measurements do not suffer from the confidentiality issues that can prevent interested parties from peeking behind the scenes of national inventories.

Could governments still hide their emissions? It’s unlikely, provided top-down methods are used with open and transparent protocols and data sharing. This should avoid accusations of foul play that could threaten to derail initiatives like the international climate accord, the Paris Agreement.

The UK example shows this type of emissions evaluation is now ready for the international stage. Institutions such as the World Meteorological Organization are working with governments and sub-national stakeholders to try to make it happen. Hopefully policymakers will see the value of finding out what’s really being released into their airThe Conversation.

————————————
This blog is written by Cabot Institute member Dr Matt Rigby, Reader in Atmospheric Chemistry, University of Bristol. This article is republished from The Conversation under a Creative Commons license. Read the original article.

How we traced ‘mystery emissions’ of CFCs back to eastern China

Since being universally ratified in the 1980s, the Montreal Protocol – the treaty charged with healing the ozone layer – has been wildly successful in causing large reductions in emissions of ozone depleting substances. Along the way, it has also averted a sizeable amount of global warming, as those same substances are also potent greenhouse gases. No wonder the ozone process is often held up as a model of how the international community could work together to tackle climate change.

However, new research we have published with colleagues in Nature shows that global emissions of the second most abundant ozone-depleting gas, CFC-11, have increased globally since 2013, primarily because of increases in emissions from eastern China. Our results strongly suggest a violation of the Montreal Protocol.

A global ban on the production of CFCs has been in force since 2010, due to their central role in depleting the stratospheric ozone layer, which protects us from the sun’s ultraviolet radiation. Since global restrictions on CFC production and use began to bite, atmospheric scientists had become used to seeing steady or accelerating year-on-year declines in their concentration.

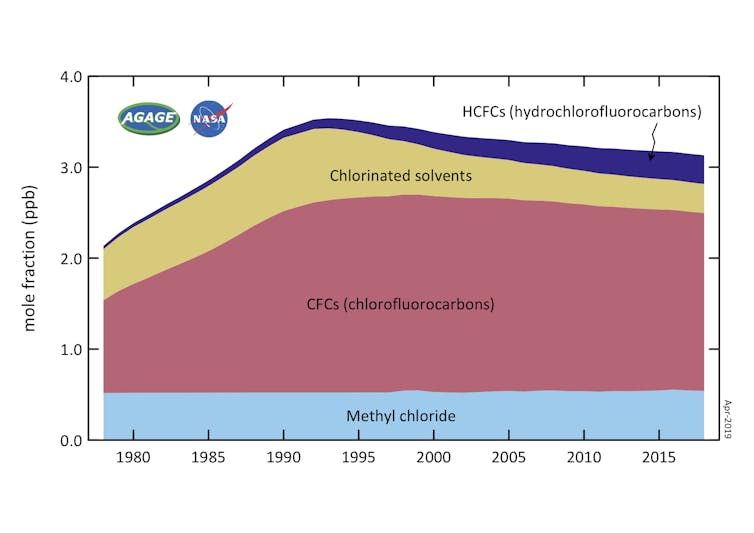
Ozone-depleting gases, measured in the lower atmosphere. Decline since the early 1990s is primarily due to the controls on production under the Montreal Protocol. AGAGE / CSIRO

But bucking the long-term trend, a strange signal began to emerge in 2013: the rate of decline of the second most abundant CFC was slowing. Before it was banned, the gas, CFC-11, was used primarily to make insulating foams. This meant that any remaining emissions should be due to leakage from “banks” of old foams in buildings and refrigerators, which should gradually decline with time.

But in that study published last year, measurements from remote monitoring stations suggested that someone was producing and using CFC-11 again, leading to thousands of tonnes of new emissions to the atmosphere each year. Hints in the data available at the time suggested that eastern Asia accounted for some unknown fraction of the global increase, but it was not clear where exactly these emissions came from.

Growing ‘plumes’ over Korea and Japan

Scientists, including ourselves, immediately began to look for clues from other measurements around the world. Most monitoring stations, primarily in North America and Europe, were consistent with gradually declining emissions in the nearby surrounding regions, as expected.
But all was not quite right at two stations: one on Jeju Island, South Korea, and the other on Hateruma Island, Japan.

These sites showed “spikes” in concentration when plumes of CFC-11 from nearby industrialised regions passed by, and these spikes had got bigger since 2013. The implication was clear: emissions had increased from somewhere nearby.

To further narrow things down, we ran computer models that could use weather data to simulate how pollution plumes travel through the atmosphere.

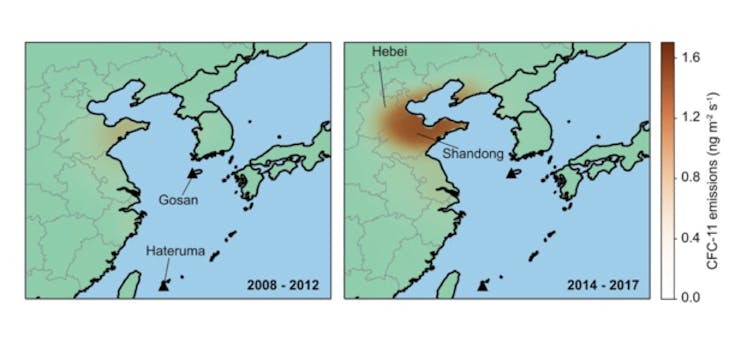
Atmospheric observations at Gosan and Hateruma monitoring stations showed an increase in CFC-11 emissions from China, primarily from Shandong, Hebei and surrounding provinces. Rigby et al, Author provided

From the simulations and the measured concentrations of CFC-11, it became apparent that a major change had occurred over eastern China. Emissions between 2014 and 2017 were around 7,000 tonnes per year higher than during 2008 to 2012. This represents more than a doubling of emissions from the region, and accounts for at least 40% to 60% of the global increase. In terms of the impact on climate, the new emissions are roughly equivalent to the annual CO₂ emissions of London.

The most plausible explanation for such an increase is that CFC-11 was still being produced, even after the global ban, and on-the-ground investigations by the Environmental Investigations Agency and the New York Times seemed to confirm continued production and use of CFC-11 even in 2018, although they weren’t able to determine how significant it was.

While it’s not known exactly why production and use of CFC-11 apparently restarted in China after the 2010 ban, these reports noted that it may be that some foam producers were not willing to transition to using second generation substitutes (HFCs and other gases, which are not harmful to the ozone layer) as the supply of the first generation substitutes (HCFCs) was becoming restricted for the first time in 2013.

Bigger than the ozone hole

Chinese authorities have said they will “crack-down” on any illegal production. We hope that the new data in our study will help. Ultimately, if China successfully eliminates the new emissions sources, then the long-term negative impact on the ozone layer and climate could be modest, and a megacity-sized amount of CO₂-equivalent emissions would be avoided. But if emissions continue at their current rate, it could undo part of the success of the Montreal Protocol.


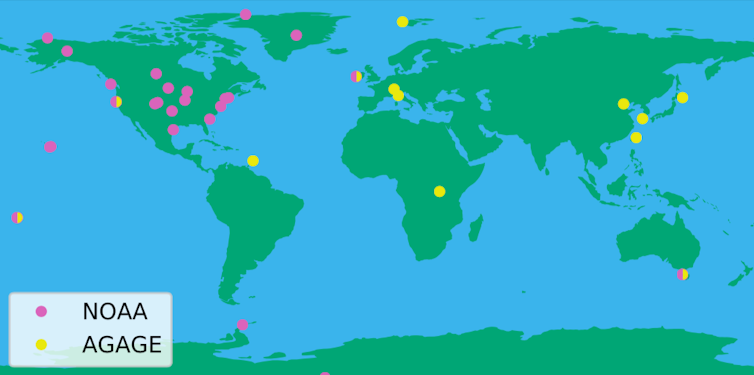
The network of global (AGAGE) and US-run (NOAA) monitoring stations. Luke Western, Author provided

While this story demonstrates the critical value of atmospheric monitoring networks, it also highlights a weakness of the current system. As pollutants quickly disperse in the atmosphere, and as there are only so many measurement stations, we were only able to get detailed information on emissions from certain parts of the world.

Therefore, if the major sources of CFC-11 had been a few hundred kilometres further to the west or south in China, or in unmonitored parts of the world, such as India, Russia, South America or most of Africa, the puzzle would remain unsolved. Indeed, there are still parts of the recent global emissions rise that remain unattributed to any specific region.

When governments and policy makers are armed with this atmospheric data, they will be in a much better position to consider effective measures. Without it, detective work is severely hampered.


—————————
This blog is written by Cabot Institute member Dr Matt Rigby, Reader in Atmospheric Chemistry, University of Bristol; Luke Western, Research Associate in Atmospheric Science, University of Bristol, and Steve Montzka, Research Chemist, NOAA ESRL Global Monitoring Division, University of ColoradoThis article is republished from The Conversation under a Creative Commons license. Read the original article.
Listen to Matt Rigby talk about CFC emissions on BBC Radio 4’s Inside Science programme.

35 years monitoring the changing composition of our atmosphere

I work on an experiment that began when the Bee Gees’ Stayin’ Alive was at the top of the charts. The project is called AGAGE, the Advanced Global Atmospheric Gases Experiment, and I’m here in Boston, Massachusetts celebrating its 35-year anniversary. AGAGE began life in 1978 as the Atmospheric Lifetimes Experiment, ALE, and has been making high-frequency, high-precision measurements of atmospheric trace gases ever since.

At the time of its inception, the world had suddenly become aware of the potential dangers associated with CFCs (chlorofluorocarbons). What were previously thought to be harmless refrigerants and aerosol propellants were found to have a damaging influence on stratospheric ozone, which protects us from harmful ultraviolet radiation. The discovery of this ozone-depletion process was made by Mario Molina and F. Sherwood Rowland, for which they, and Paul Crutzen, won the Nobel Prize in Chemistry in 1995. However, Molina and Rowland were not sure how long CFCs would persist in the atmosphere, and so ALE, under the leadership of Prof. Ron Prinn (MIT) and collaborators around the world, was devised to test whether we’d be burdened with CFCs in our atmosphere for years, decades or centuries.

Fig 1. The AGAGE network

ALE monitored the concentration of CFCs, and other ozone depleting substances, at five sites chosen for their relatively “unpolluted” air (including the west coast of Ireland station which is now run by Prof. Simon O’Doherty here at the University of Bristol). The idea was that if we could measure the increasing concentration of these gases in the air, then, when combined with estimates of the global emission rate, we would be able to determine how rapidly natural processes in the atmosphere were removing them.

 
Fig 2. Mace Head station on the West coast of Ireland
 

Thanks in part to these measurements, we now know that CFCs will only be removed from the atmosphere over tens to hundreds of years, meaning that the recovery of stratospheric ozone and the famous ozone “hole” will take several generations. However, over the years, ALE, and now AGAGE, have identified a more positive story relating to atmospheric CFCs: the effectiveness of international agreements to limit gas emissions.

The Montreal Protocol on Substances that Deplete the Ozone Layer was agreed upon after the problems associated with CFCs were recognised. It was agreed that CFC use would be phased-out in developed countries first, and developing countries after a delay of a few years. The effects were seen very rapidly. For some of the shorter-lived compounds, such as methyl chloroform (shown in the figure), AGAGE measurements show that global concentrations began to drop within 5 years of the 1987 ratification of the Protocol. 

Figure 3. Concentrations of methyl chloroform, a substance banned under the Montreal Protocol, measured at four AGAGE stations.
Over time, the focus of AGAGE has shifted. As the most severe consequences of stratospheric ozone depletion look like they’ve been avoided, we’re now more acutely aware of the impact of “greenhouse” gases on the Earth’s climate. In response, AGAGE has developed new techniques that can measure over 40 compounds that are warming the surface of the planet. These measurements are showing some remarkable things, such as the rapid growth of HFCs, which are replacements for CFCs that have an unfortunate global-warming side effect, or the strange fluctuations in atmospheric methane concentrations, which looked like they’d plateaued in 1999, but are now growing rapidly again.

The meeting of AGAGE team members this year has been a reminder of how important this type of meticulous long-term monitoring is. It’s also a great example of international scientific collaboration, with representatives attending from the USA, UK, South Korea, Australia, Switzerland, Norway and Italy. Without the remarkable record that these scientists have compiled, we’d be much less informed about the changing composition of the atmosphere, more unsure about the lifetimes of CFCs and other ozone depleting substances, and unclear as to the exact concentrations and emissions rates of some potent greenhouse gases. I’m looking forward to the insights we’ll gain from the next 35 years of AGAGE measurements!This blog was written by Dr Matt Rigby, Atmospheric Chemistry Research Group, University of Bristol.

Matt Rigby