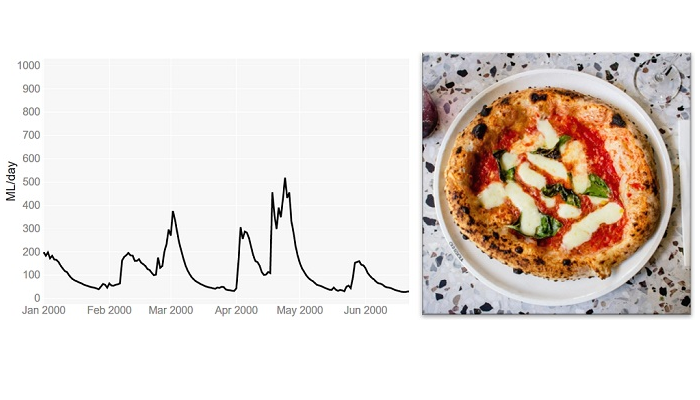
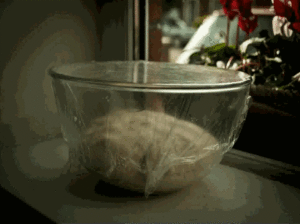
Is this a question that you have asked yourself after following a recipe, for instance, to make pizza?
You have used the same ingredients and followed all the steps and still the result doesn’t look like the one in the picture…
Don’t worry: you are not alone! This is a common issue, and not only in cooking, but also in hydrological sciences, and in particular in hydrological modelling.
Most hydrological modelling studies are difficult to reproduce, even if one has access to the code and the data (Hutton et al., 2016). But why is this?
In this blog post, we will try to answer this question by using an analogy with pizza making.
Let’s imagine that we have a recipe together with all the ingredients to make pizza. Our aim is to make a pizza that looks like the one in the picture of the recipe.
This is a bit like someone wanting to reproduce the results reported in a scientific paper about a hydrological “rainfall-runoff” model. There, one would need to download the historical data (rainfall, temperature and river flows) and the model code used by the authors of the study.
However, in the same way as the recipe and the ingredients are just the start of the pizza making process, having the input data and the model code is only the start of the modelling process.
To get the pizza shown in the picture of the recipe, we first need to work the ingredients, i.e. knead the dough, proof and bake. And to get the simulated river flows shown in the study, we need to ‘work’ the data and the model code, i.e. do the model calibration, evaluation and final simulation.
Using the pizza making analogy, these are the correspondences between pizza making and hydrological modelling:
Pizza making Hydrological modelling
kitchen and cooking tools computer and software
ingredients historical data and computer code for model simulation
recipe modelling process as described in a scientific paper or in a computer script / workflow
Step 1: Putting the ingredients together
Dough kneading
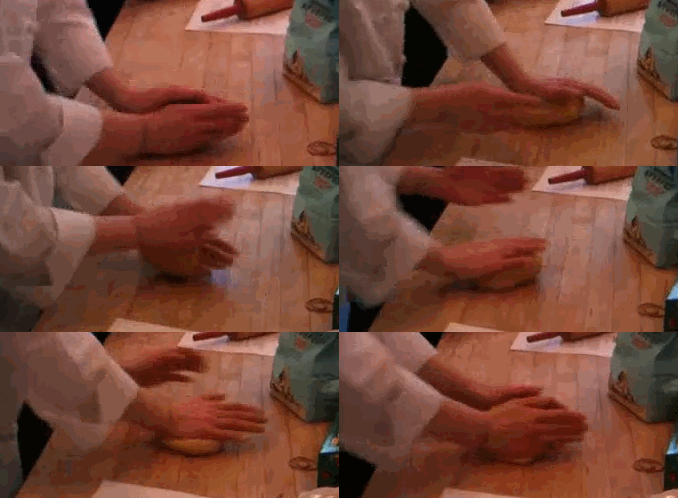
So, let’s start making the pizza. According to the recipe, we need to mix well the ingredients to get a dough and then we need to knead it. Kneading basically consists of pushing and stretching the dough many times and it can be done either manually or automatically (using a stand mixer).
The purpose of kneading is to develop the gluten proteins that create the structure and strength in the dough, and that allow for the trapping of gases and the rising of the dough.The recipe recommends using a stand mixer for the kneading, however if we don’t have one, we can do it manually.
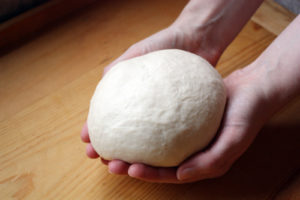
The recipe says to knead until the dough is elastic and looks silky and soft. We then knead the dough until it looks like the one in the photo shown in the recipe.
Model calibration
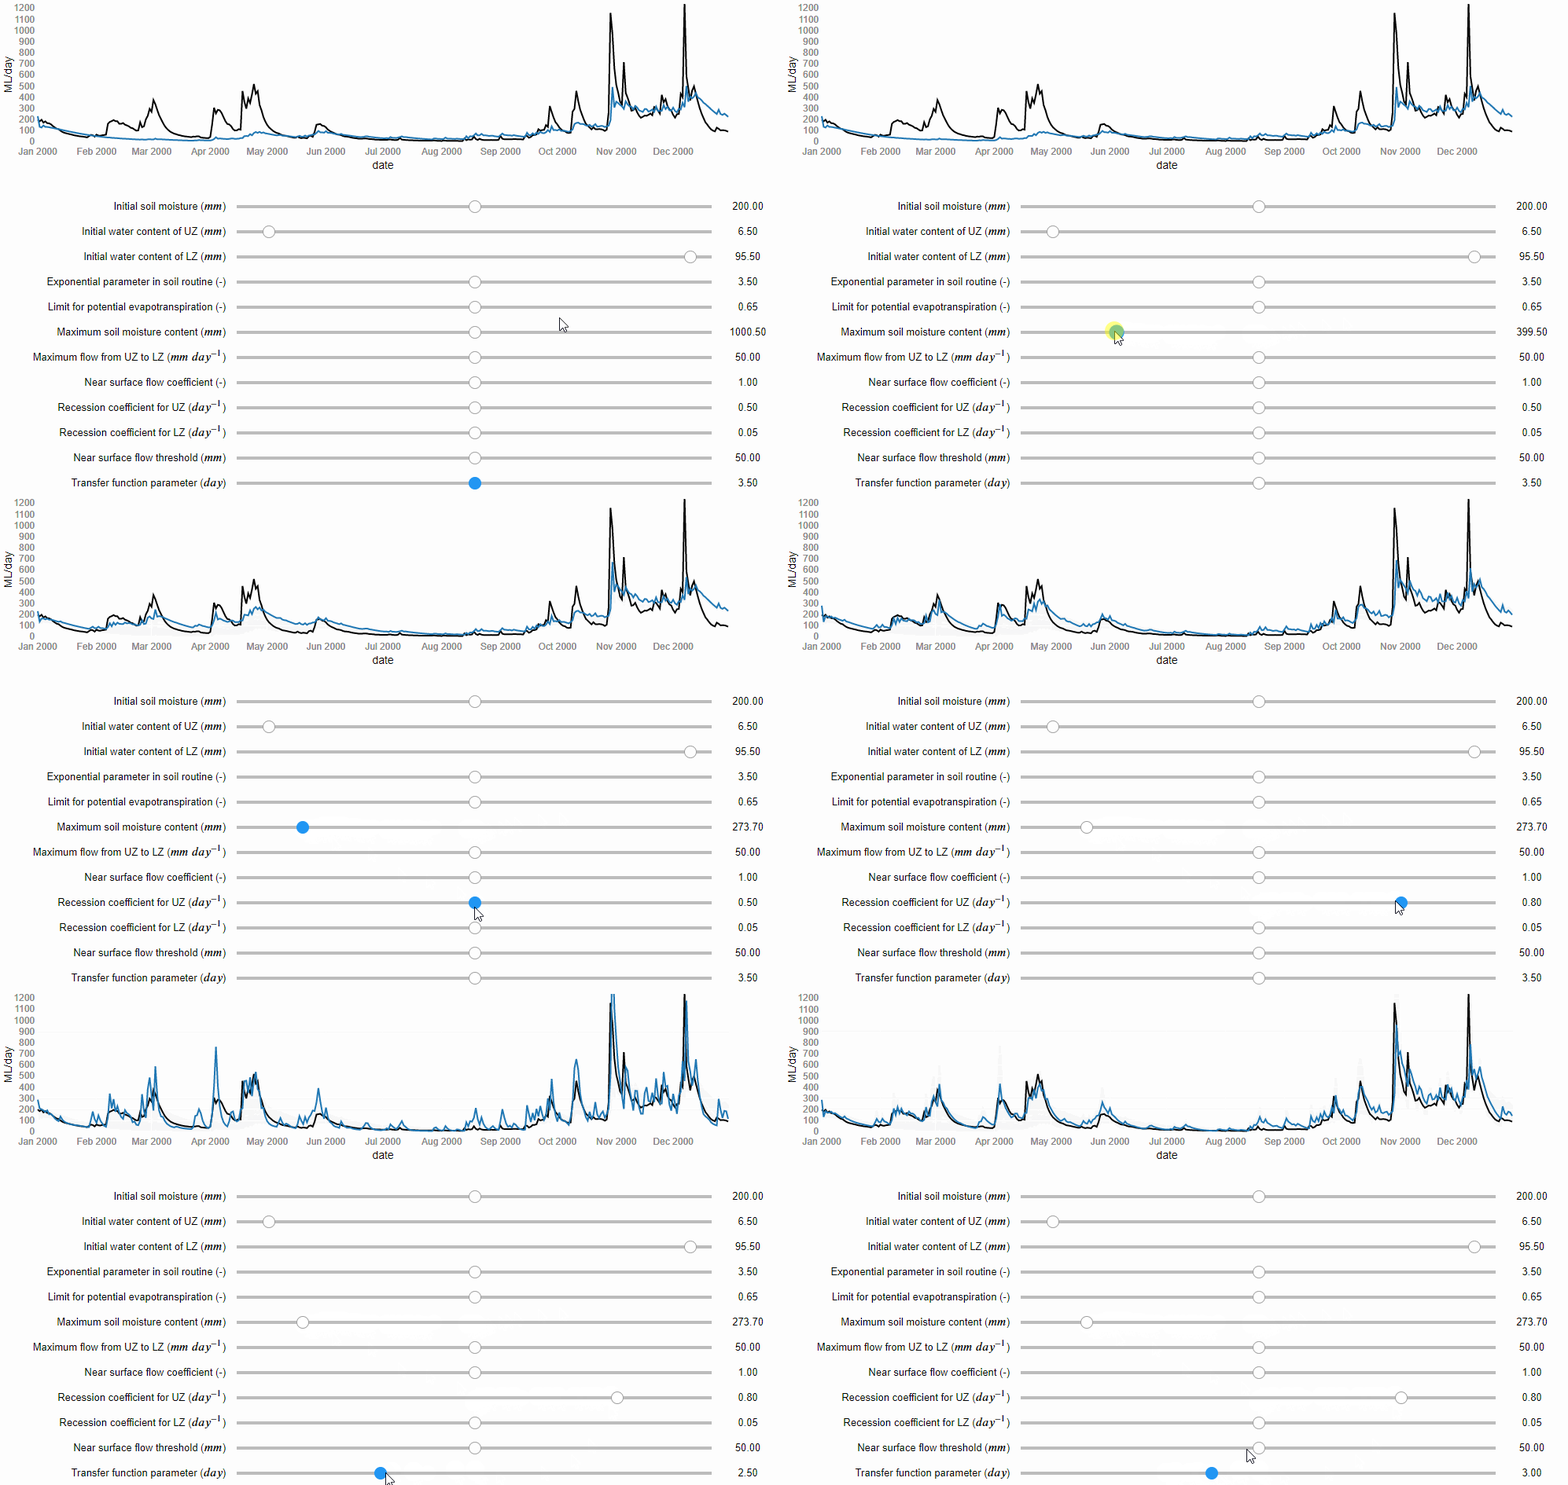
Now, let’s start the modelling process. If the paper does not report the values of the model parameters, we can determine them through model calibration. Model calibration is a mathematical process that aims to tailor a general hydrological model to a particular basin. It involves running the model many times under different combinations of the parameter values, until one is found that matches well the flow records available for that basin. Similarly to kneading, model calibration can be manual, i.e. the modeller changes manually the values of the model parameters trying to find a combination that captures the patterns in the observed flows (Figure 1), or it can be automatic, i.e. a computer algorithm is used to search for the best combination of parameter values more quickly and comprehensively.
Figure 1 Manual model calibration. The river flows predicted by the model are represented by the blue line and the observed river flows by the black line (source: iRONS toolbox)
According to the study, the authors used an algorithm implemented in an open source software for the calibration. We can download and use the same software. However, if any error occurs and we cannot install it, we could decide to calibrate the model manually. According to the study, the Nash-Sutcliffe efficiency (NSE) function was used as numerical criteria to evaluate the calibration obtaining a value of 0.82 out of 1. We then do the manual calibration until we obtain NSE = 0.82.
(source: iRONS toolbox)
Step 2: Checking our work
Dough proofing
In pizza making, this step is called proofing or fermentation. In this stage, we place the dough somewhere warm, for example close to a heater, and let it rise. According to the recipe, the proofing will end after 3 hours or when the dough has doubled its volume.
The volume is important because it gives us an idea of how strong the dough is and how active the yeast is, and hence if the dough is ready for baking. We let our dough rise for 3 hours and we check. We find out that actually it has almost tripled in size… “even better!” we think.
Model evaluation
In hydrological modelling, this stage consists of running the model using the parameter values obtained by the calibration but now under a different set of temperature and rainfall records. If the differences between estimated and observed flows are still low, then our calibrated model is able to predict river flows under meteorological conditions different from the one to which it was calibrated. This makes us more confident that it will work well also under future meteorological conditions. According to the study, the evaluation gave a NSE = 0.78. We then run our calibrated model fed by the evaluation data and we get a NSE = 0.80… “even better!” we think.
Step 3: Delivering the product!
Pizza baking
Finally, we are ready to shape the dough, add the toppings and bake our pizza. According to the recipe, we should shape the dough into a round and thin pie. This takes some time as our dough keeps breaking when stretched, but we finally manage to make it into a kind of rounded shape. We then add the toppings and bake our pizza.
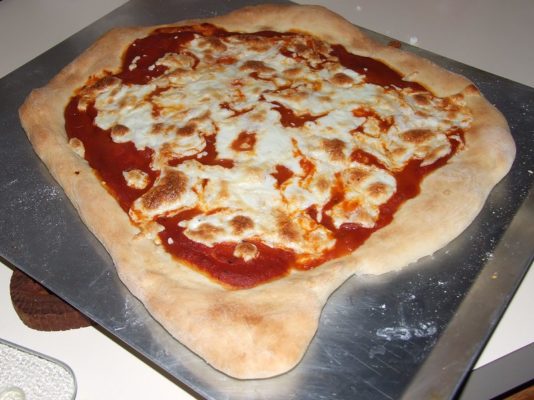
Ten minutes later we take the pizza out of the oven and… it looks completely different from the one in the picture of the recipe! … but at least it looks like a pizza…
 |
| (Source: flickr.com) |
River flow simulation
And finally, after calibrating and evaluating our model, we are ready to use it to simulate recreate the same river flow predictions as shown in the results of the paper. In that study, they forced the model with seasonal forecasts of rainfall and temperature that are available from the website of the European Centre for Medium-range Weather Forecasts (ECMWF).
Downloading the forecasts takes some time because we need to write two scripts, one to download the data and one to pre-process them to be suitable for our basin (so called “bias correction”). After a few hours we are ready to run the simulation and… it looks completely different from the hydrograph shown in the study! … but at least it looks like a hydrograph…
Why we never get the exact same result?
Here are some possible explanations for our inability to exactly reproduce pizzas or modelling results:
- We may have not kneaded the dough enough or kneaded it too much; or we may have thought that the dough was ready when it wasn’t. Similarly, in modelling, we may have stopped the calibration process too early or too late (so called “over-fitting” of the data).
- The recipe does not provide sufficient information on how to test the dough; for example, it does not say how wet or elastic the dough should be after kneading. Similarly, in modelling, a paper may not provide sufficient information about model testing as, for instance, the model performance for different variables and different metrics.
- We don’t have the same cooking tools as those used by the recipe’s authors; for example, we don’t have the same brand of the stand mixer or the oven. Similarly, in modelling we may use a different hardware or operating system, which means calculations may differ due to different machine precision or slightly different versions of the same software tools/dependencies.
- Small changes in the pizza making process, such as ingredients quantities, temperature and humidity, can lead to significant changes in the final result, particularly because some processes, such as kneading, are very sensitive to small changes in conditions. Similarly, small changes in the modelling process, such as in the model setup or pre-processing of the data, can lead to rather different results.
In conclusion…
Setting up a hydrological model involves the use of different software packages, which often exist in different versions, and requires many adjustments and choices to tailor the model to a specific place. So how do we achieve reproducibility in practice? Sharing code and data is essential, but often is not enough. Sufficient information should also be provided to understand what the model code does, and whether it does it correctly when used by others. This may sound like a big task, but the good news is that we have increasingly powerful tools to efficiently develop rich and interactive documentation. And some of these tools, such as R Markdown or Jupyter Notebooks, and the online platforms that support them such as Binder, enable us not only to share data and code but also the full computational environment in which results are produced – so that others have access not only to our recipes but can directly cook in our kitchen.
—————————
This blog has been reposted with kind permission from the authors, Cabot Institute for the Environment members Dr Andres Peñuela, Dr Valentina Noacco and Dr Francesca Pianosi. View the original post on the EGU blog site.
Andres Peñuela is a Research Associate in the Water and Environmental Engineering research group at the University of Bristol. His main research interest is the development and application of models and tools to improve our understanding on the hydrological and human-impacted processes affecting water resources and water systems and to support sustainable management and knowledge transfer
Valentina Noacco is a Senior Research Associate in the Water and Environmental Engineering research group at the University of Bristol. Her main research interest is the development of tools and workflows to transfer sensitivity analysis methods and knowledge to industrial practitioners. This knowledge transfer aims at improving the consideration of uncertainty in mathematical models used in industry
Francesca Pianosi is a Senior Lecturer in Water and Environmental Engineering at the University of Bristol. Her expertise is in the application of mathematical modelling to hydrology and water systems. Her current research mainly focuses on two areas: modelling and multi-objective optimisation of water resource systems, and uncertainty and sensitivity analysis of mathematical models.

