Two weeks in the ‘Avenue of Volcanoes’

Workshops, conferences, field work – national and international travel is an essential part of many PhD programs. I’ve been lucky enough to see numerous new parts of the globe during my studies, and, less luckily, numerous different airport layovers (I’m currently writing this post from a corridor between terminals at Washington airport…!).

I’m on my way back to Bristol from a workshop in Ecuador on volcanic unrest, which culminated with an eruption simulation exercise. As my PhD is focused on unravelling the science behind volcanic unrest, these trips (this is the second of three with this specific aim) form a main focus for the real-world application of my research.

This workshop was split into 3 different parts. The first was a series of lectures on how volcanologists, social scientists, emergency managers, civil protection officials, and the general public interact during volcanic crises. Each specialist contributed their individual expertise, in my case as a volcanologist interpreting the signals that the volcano gives off, but the main message was that communication at all times between all parties must be especially clear. As with almost all lectures though, this part of the workshop obviously wasn’t the most exciting – especially with the inevitable jet-lagged tiredness kicking in for the first few days.

The second part of the workshop took us out into the field to explore two of Ecuador’s most famous volcanoes: Cotopaxi and Tungurahua. This was my favourite part! These are two quite epic volcanoes with the classical conical shape you imagine when you think of a volcano. By examining them in situ we learnt about the hazards they pose today to many nearby towns and cities. This really helps to put my research into perspective, as I know that by contributing to a better understanding of how volcanoes work I am helping to protect the people whose livelihood’s depend on the benefits the volcano brings them (for example, the more fertile soil).

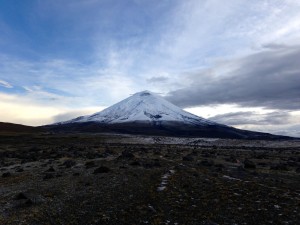
Cotopaxi volcano, summit 5897 m ASL

The final part of the workshop took us to the Ecuadorian national centre for crisis management in Quito (cue vigilant security checks!). Here we conducted the volcanic unrest and eruption simulation. This is similar in some ways to a fire drill but a whole lot more complicated. Simulated monitoring ‘data’ from the volcano is fed to a team of volcanologists who have to quickly interpret what the data means and feed that information in a clear, coherent and understandable way to emergency managers, politicians and civil authorities. Upon the advice of the volcanologists, the decision makers can then choose how best to respond and mitigate a potential impending crisis. As this was just an exercise, different stages in the unrest crisis were dealt with all in one very busy day, with ‘data’ from the volcano arriving every couple of hours but representing several weeks or months in simulated time.

The final ‘update’ from the volcano: BIG eruption! I think we all could have predicted that – everyone likes a grand finale.

Despite the Hollywood firework finish, these exercises are crucial to prepare those individuals who will actually be in positions of responsibility when a true volcanic crisis develops. By playing out the different stages in as close to real-life as possible, strengths and weaknesses were highlighted that will allow for improvements to be made in the future. Improvements that may just save extra lives or livelihoods, and foster improved relationships between the public and the scientists trying to help them.

As one of those scientists, I was just happy enough to be able to take part.
——————
Cabot Institute member James Hickey is a final year PhD student in the School of Earth Sciences. His research is focused on unravelling the mechanisms that cause volcanoes to become restless prior to eruptions. Ultimately, the aim is to improve our understanding of precursory signals to enhance forecasting and mitigation efforts.

James Hickey

This blog has been republished with kind permission from the Bristol Doctoral College.  View the original blog post.


If you would like to study a PhD at the University of Bristol, please visit the Univeristy’s scholarships page

Do people respond to air pollution forecasts?

In 2010, the House of Commons Environmental Audit Committee published a report on air quality in which they concluded that “poor air quality probably causes more mortality and morbidity than passive smoking, road traffic accidents or obesity”. Concerned that the Government was still not giving air quality a high enough priority, the Committee published another report in 2011. To date, the Committee’s main recommendations have not been implemented. Amidst new evidence on the negative effects of air pollution on health and a court case that found the UK Government guilty of failing to meet EU air quality targets, the Committee published a third report on air quality last week.

One of the Committee’s recommendations is that the Government works more closely with the Met Office, the BBC and other broadcasters to ensure that forecasts of high air pollution episodes are disseminated widely together with advice on what action should be taken. The Committee’s rationale is that information about air pollution allows individuals to take action that reduces exposure. However, avoidance behaviour, such as staying indoors, imposes a cost on individuals that might exceed the perceived gains.

A BBC weather forecast for Bristol showing the commonly
encountered “green” air pollution forecast.

In a paper published this month in the Journal of Health Economics (Link with free access until 22 January 2015) I investigate responses to air pollution warnings in England. I obtained data on the air pollution forecasts issued by Defra from 2002 to 2008. During this period the daily air pollution forecast was freely available via the internet, a Freephone telephone service, Teletext and with the weather forecast on the BBC website. The forecast was disseminated using traffic light colour-coding, with green indicating low levels of air pollution, amber moderate and red high levels. “Red” forecasts were extremely rare (3% of forecasts) and “green” forecasts very common (70% of forecasts), so a change from “green” to “amber” (27% of forecasts) was akin to an air pollution warning. Hence, I define an “amber” or “red” forecast as an air pollution warning.

Air pollution warnings and hospital emergency admissions

First, I looked at indirect evidence of avoidance behaviour by estimating the relationship between air pollution warnings and hospital emergency admissions for respiratory diseases in children aged 5 to 19 years. I controlled for actual air pollution levels and therefore essentially compared days with a certain level of air pollution for which an air pollution warning was issued with days with the same level of air pollution for which no air pollution warning was issued. If parents and children do respond to air pollution warnings by reducing their exposure or taking other preventive measures, we expect fewer emergency hospital admissions on days for which an air pollution warning was issued compared to days with the same level of air pollution but no warning.

Looking at all respiratory admissions I found no effect. Looking at a subset of respiratory admissions – admissions for acute respiratory infections such as pneumonia and bronchitis – I also found no effect. Only when I examined another subset of respiratory admissions, namely admissions for asthma, did I find that air pollution warnings reduce hospital emergency admissions, by about 8%.

Presumably, it is less costly for asthmatics to respond to an air pollution warning. Standard advice for asthmatics is to adjust the dose of their reliever medicine and to make sure they carry their inhaler with them. Other types of respiratory disease require far more disruptive preventive measures such as staying indoors, making the cost of responding to air pollution warnings larger than the perceived gains.

Direct evidence of avoidance behaviour: visitors to Bristol Zoo

To find direct evidence of avoidance behaviour, I examined daily visitor counts to Bristol Zoo Gardens. Zoos are attractive destinations for families with children. Even with some animal houses under cover, most people will consider a zoo visit to be an outdoor activity and therefore susceptible individuals might adjust their plans to the air pollution forecast.  I found that lower temperature, more rain and higher wind speed reduced visitor numbers but found no effect of air pollution warnings on visitor numbers. Only when I looked at members – visitors who have an annual membership that entitles them to unlimited visits for a year – did I find that air pollution warnings reduce visits by about 6%. For members it is less costly to respond to air pollution warnings as they tend to be local residents who can just drop in for a quick visit. Thus, the perceived gains from postponing a visit are more likely to exceed the cost of postponing than for day visitors.

This graph shows monthly means of visitors to Bristol Zoo Gardens, daily maximum temperature and monthly total of air pollution warnings. Day visitors (grey bars) are far more responsive to temperature (yellow line) than to air pollution warnings (purple bars). Members’ visits (green bars) seem to be fewer in months with more air pollution warnings (purple bars).

Overall, my results show that whether individuals respond to air quality information depends on the costs and benefits of doing so: where costs are low and the benefits clear, responses are higher. This finding suggests, that wider dissemination of high air pollution forecasts as recommended by the Commons Environmental Audit Committee may not bring about the desired prevention of adverse health effects from air pollution. The Committee’s other recommendations aimed at lowering air pollution levels are more likely to succeed in preventing ill health.

——————-
This blog is written by Cabot Institute member Katharina Janke, Research Associate in Applied Microeconomics and Health Economics at the Centre for Market and Public Organisation at the University of Bristol.
Katharina Janke

A N-ICE trip to the North Pole: Understanding the link between sea ice and climate

Imagine. It’s the bitter Arctic winter, it’s dark, cold enough to kill, and your ship is stuck in sea-ice.  There’s nothing you can do against the heave of the ice, except let your ship drift along. Out of your control. This seems like a difficult prospect today, but then imagine it happening over a century ago.

This is exactly what did happen when Norwegian explorer, Fridtjof Nansen, intentionally trapped his ship, Fram, in Arctic sea-ice in 1893 in an attempt to reach the North Pole. For about three years, Fram drifted with the ice until finally reaching the North Atlantic. Whilst a main motivation for their extraordinary journey was to find the Pole, they also made a number of scientific observations that had a profound influence on the (at the time) young discipline of oceanography.

Scientists led by the Norwegian Polar Institute (NPI) are now – pretty much on the 120th anniversary of the original expedition – repeating the journey, this time purely in the name of science.  I’m a member of the international team, meaning that the University of Bristol gets to play its part.

View from near the Norwegian Polar Institute, Tromsø, at about
2.30pm in the afternoon! Tromsø is on a small island,
surrounded by beautiful mountains, but has very long, dark winters.

The group I’m working with are investigating the role of newly formed sea-ice and freshwater on the flow of heat and nutrients through Arctic oceans, which plays a key role in regulating climate both locally and on a global scale.  The sea-ice in the Arctic is diminishing at an alarming rate, with between 9.4 and 13.6% decline per decade in the perennial sea-ice from 1979 to 2012 according to the last Intergovernmental Panel on Climate Change report [1]. If we are to understand how the sea-ice might change in the future, and what impact this might have on other systems, we have to be able to understand the physics of the system today.

My role is to help to chemically analyse the seawater, in order to trace the freshwater input to the oceans.  The amount of freshwater will determine the density of the water, and so will control the degree of stratification or sinking, which will be important for the transport of heat.

In November, I went to visit the Norwegian Polar Institute in Tromsø in the very north of Norway for a pre-cruise workshop.  I got to meet a number of the Norwegian Young Sea-Ice (N-ICE2015) team, and visit Norway – a place I’d never been before as Antarctica is my usual stomping ground! We had two days of learning about the scientific interests of all the group members, and finding our way around some of the high-tech instrumentation that we will have at our disposal. I also got a tour of the ship that N-ICE2015 will use: the R/V Lance. By the end, everyone was keen to set off – although everyone will now have to wait until January…

This blog is written by Cabot Institute member Kate Hendry, Earth Sciences, University of Bristol.

Further information

You can find out more about N-ICE2015 at the project website.

[1] Climate Change 2013: The Physical Science Basis. Working Group 1 Contribution to the Fifth Assessment Report of the Intergovernmental Panel on Climate Change, 2013.

Why forests are about more than just climate change

It’s National Tree Week, and there is a plethora of talk about all the great things that trees do: encouraging biodiversity, providing a pleasant space for humans, and providing numerous ecosystem services. As well as this, there is some reference to how trees take in carbon dioxide, and the benefits of this for helping to prevent climate change. But what if trees didn’t help prevent climate change? What if actually, they increased climate change?

Afforestation (planting forests) is one of many suggestions as a way to deliberately change the earth’s climate to attempt to reverse the effects of climate change (known as ‘geoengineering’). Planting more trees seems like a an obvious, natural solution. Carbon offsetting, RED+ and lots of other schemes around the issue of climate change have been based on the preservation or increase of forests. But does it work?

We’ve known for some time that boreal forests contribute to climate change rather than help prevent it, because of changes in the surface reflectance (the albedo). But thus far, forests in other places have been thought to be beneficial, storing up carbon and not affecting the albedo so much.

But our recent study suggests that globally, preserving and expanding forests actually causes a net global warming. We used the Met Office’s latest climate model and did simulations of future climate change, with and without afforestion/forest preservation, and we found that though the deforestation has no discernable effect on the climate, the afforestation does.

Does this mean that we are advocating chopping down forests? No. As National Tree Week says, forests are about more than climate change. However much climate change is a key challenge for the future, we can’t forget that other things are important too. The climate effect of the forest preservation and expansion is small – only about 0.1 °C. How do you value that against the mass loss of biodiversity, irrelplaceable ecosystems and ecosystem services that would be lost?

Saving or planting forests is not a panacea for climate change, but neither is it the enemy. Conserving forest is worthwhile for lots of other reasons, but we shouldn’t kid ourselves that there won’t be difficult decisions to make about protecting the unique forest habitats, especially tropical forests like the Amazon, and preventing climate change.
—————-
This blog was written by Cabot Institute member, T Davies-Barnard, University of Exeter.