World Water Day: Climate change and flash floods in Small Island Developing States

Pluvial flash flooding (otherwise known as flash flooding caused by rain) is a major hazard globally, but a particularly acute problem for Small Island Developing States (SIDS). Many SIDS experience extreme rainfall events associated with tropical cyclones (often referred to as hurricanes) which trigger excess surface water runoff and lead to pluvial flash flooding.

Following record-breaking hurricanes in the Caribbean such as Hurricane Maria in 2017 and Hurricane Dorian in 2019, the severe risk facing SIDS has been reaffirmed and labelled by many as a sign of the ‘new normal’ due to rising global temperatures under climate change. Nonetheless, in the Disaster Risk Reduction community there is a limited understanding of both current tropical-cyclone induced flood hazard and how this might change under different climate change scenarios, which inhibits attempts to build adaptive capacity and resilience to these events.

As part of the first year of my PhD research, I am applying rainfall data that has been produced by Emily Vosper and Dr Dann Mitchell in the University of Bristol BRIDGE group using a tropical cyclone rainfall model. This model uses climate model data to simulate a large number of tropical cyclone events in the Caribbean, which are used to understand how the statistics of tropical cyclone-induced rainfall might change under the 1.5C and 2C Paris Agreement scenarios. This rainfall data will be input into the hydrodynamic model LISFLOOD-FP to simulate pluvial flash flooding associated with hurricanes in Puerto Rico.

Investigating changes in flood hazard associated with different rainfall scenarios will help us to understand how flash flooding, associated with hurricanes, emerges under current conditions and how this might change under future climate change in Puerto Rico. Paired with data identifying exposure and vulnerability, my research hopes to provide some insight into how flood risk related to hurricanes could be estimated, and how resilience could be improved under future climate change.

————————————-
This blog is written by Cabot Institute member Leanne Archer, School of Geographical Sciences,  University of Bristol.
Leanne Archer

Flooding in the UK: Understanding the past and preparing for the future

On the 16th of October 2019, Ivan Haigh ­Associate Professor in Coastal Oceanography at the University of Southampton – gave a presentation on the “characteristics and drivers of compound flooding events around the UK coast” at the BRIDGE research seminar in the School of Geographical Sciences. He began by outlining the seriousness of flood risk in the UK – it is the second highest civil emergency risk factor as defined by the Cabinet Office – before moving on to the first section of the talk on his work with the Environment Agency on its Thames Estuary 2100 plan (TE2100)[1].

Thames Estuary 2100 plan: 5-year review

The construction of a Thames barrier was proposed after severe flooding in London in 1953, and it eventually became operational 30 years later in 1983. Annually, the Thames barrier removes around £2bn of flood damage risk from London and is crucial to the future prosperity of the city in a changing environment.

The Thames Barrier in its closed formation. Image source: Thames Estuary 2100 Plan (2012)

Flood defences in the Thames estuary were assessed in the TE2100 plan, which takes an innovative “adaptive pathways management approach” to the future of these flood defences over the coming century. This approach means that a range of flood defence options are devised and the choice of which ones to implement is based upon the current environmental data and the latest models of future scenarios, in particular predictions of future sea level rise.

For this method to be effective, accurate observations of recent sea level changes must be made in order to determine which management pathway to implement and to see if these measurements fit with the predictions of future sea level rise used in the plan. This work is carried out in reviews of the plan at five-year intervals, and it was this work that Ivan and his colleagues were involved with.

There is significant monthly and annual variability in the local tide gauge records that measure changes in sea level, and this can make it difficult to assess whether there is any long-term trend in the record. Using statistical analysis of the tide gauge data, the team was able to filter 91% of the variability that was due to short term changes in atmospheric pressure and winds to reveal a trend of approximately 1.5 mm per year of sea level rise, in line with the predictions of the model that is incorporated into the TE2100 plan.

Compound flood events around the UK Coast

In the second half of his presentation, Ivan went on to discuss a recent paper he was involved with studying compound flood events around the UK (Hendry et al. 2019)[2]. A compound flood occurs when a storm surge, caused by low atmospheric pressure allowing the sea surface to rise locally, combines with river flooding caused by a large rainfall event. These can be the most damaging natural disasters in the UK, and from historical data sets stretching back 50 years at 33 tide gauges and 326 river stations, the team were able to determine the frequency of compound floods across the UK.

Along the west coast, there were between 3 and 6 compound flooding events per decade, whereas on the east coast, there were between 0 and 1 per decade. This difference between east and west is driven by the different weather patterns that lead to these events. On the west coast it is the same type of low-pressure system that causes coastal storm surges and high rainfall. However, on the east coast different weather patterns are responsible for high rainfall and storm surges, meaning it is very unlikely they could occur at the same time.

Number of compound flood events per decade at each of the 326 river stations in the study. Triangle symbols implies rover mouth on West coast, circles East coast and squares South coast. Image Source: Hendry et al. 2019 [2]

There is also significant variability along the west coast of the UK as well, and the team investigated whether the characteristics of the river catchments could impact the possibility of these compound flooding events occurring. They found that smaller river catchments, and steeper terrain within the catchments, increased the probability of these compound flooding events occurring as water from rainfall was delivered to the coast more quickly. From the improved understanding of the weather patterns behind compound flooding events that this work provides, the quality and timeliness of flood warnings could be improved.

From the question and answer session we heard that current flood risk assessments do not always include the potential for compound flood events, meaning flood risk could be underestimated along the west coast of the UK. We also heard that Ivan will be working with researchers in the hydrology group here at the University of Bristol to further the analysis of the impact of river catchment characteristics on the likelihood of compound flooding events, and then extending this analysis to Europe, North America and Asia.

References

[1] Environment Agency (2012), “Thames Estuary 2100 Plan”.
[2] Alistair Hendry, Ivan D. Haigh, Robert J. Nicholls, Hugo Winter, Robert Neal, Thomas Wahl, Amélie Joly-Laugel, and Stephen E. Darby, (2019). “Assessing the characteristics and drivers of compound flooding events around the UK coast”, Hydrology and Earth System Science, 23, 3117-3139.

——————————————-

This blog was written by Cabot Institute member Tom Mitcham. He is a PhD student in the School of Geographical Sciences at the University of Bristol and is studying the ice dynamics of Antarctic ice shelves and their tributary glaciers.

Tom Mitcham

Read Tom’s other blog:
1. Just the tip of the iceberg: Climate research at the Bristol Glaciology Centre

Climate-driven extreme weather is threatening old bridges with collapse

The recent collapse of a bridge in Grinton, North Yorkshire, raises lots of questions about how prepared we are for these sorts of risks. The bridge, which was due to be on the route of the cycling world championships in September, collapsed after a month’s worth of rain fell in just four hours, causing flash flooding.

Grinton is the latest in a series of such collapses. In 2015, first Storm Eva and then Storm Frank caused flooding which collapsed the 18th century Tadcaster bridge, also in North Yorkshire, and badly damaged the medieval-era Eamont bridge in nearby Cumbria. Floods in 2009 collapsed or severely damaged 29 bridges in Cumbria alone.

With climate change making this sort of intense rainfall more common in future, people are right to wonder whether we’ll see many more such bridge collapses. And if so – which bridges are most at risk?

In 2014 the Tour de France passed over the now-destroyed bridge near Grinton. Tim Goode/PA

We know that bridges can collapse for various reasons. Some are simply old and already crumbling. Others fall down because of defective materials or environmental processes such as flooding, corrosion or earthquakes. Bridges have even collapsed after ships crash into them.

Europe’s first major roads and bridges were built by the Romans. This infrastructure developed hugely during the industrial revolution, then much of it was rebuilt and transformed after World War II. But since then, various factors have increased the pressure on bridges and other critical structures.
For instance, when many bridges were first built, traffic mostly consisted of pedestrians, animals and carts – an insignificant load for heavy-weight bridges. Yet over the decades private cars and trucks have got bigger, heavier and faster, while the sheer number of vehicles has massively increased.

Different bridges run different risks

Engineers in many countries think that numerous bridges could have reached the end of their expected life spans (between 50-100 years). However, we do not know which bridges are most at risk. This is because there is no national database or method for identifying structures at risk. Since different types of bridges are sensitive to different failure mechanisms, having awareness of the bridge stock is the first step for an effective risk management of the assets.


Newcastle’s various bridges all have different risks. Shaun Dodds / shutterstock

In Newcastle, for example, seven bridges over the river Tyne connect the city to the town of Gateshead. These bridges vary in function (pedestrian, road and railway), material (from steel to concrete) and age (17 to 150 years old). The risk and type of failure for each bridge is therefore very different.

Intense rain will become more common

Flooding is recognised as a major threat in the UK’s National Risk Register of Civil Emergencies. And though the Met Office’s latest set of climate projections shows an increase in average rainfall in winter and a decrease in average rainfall in summer, rainfall is naturally very variable. Flooding is caused by particularly heavy rain so it is important to look at how the extremes are changing, not just the averages.

Warmer air can hold more moisture and so it is likely that we will see increases in heavy rainfall, like the rain that caused the flash floods at Grinton. High resolution climate models and observational studies also show an intensification of extreme rainfall. This all means that bridge collapse from flooding is more likely in the future.

To reduce future disasters, we need an overview of our infrastructure, including assessments of change of use, ageing and climate change. A national bridge database would enable scientists and engineers to identify and compare risks to bridges across the country, on the basis of threats from climate change.


This blog is written by Cabot Institute member Dr Maria Pregnolato, Lecturer in Civil Engineering, University of Bristol and Elizabeth Lewis, Lecturer in Computational Hydrology, Newcastle University.  This article is republished from The Conversation under a Creative Commons license. Read the original article.

Learning about cascading hazards at the iRALL School in China

Earlier this year, I wrote about my experiences of attending an interdisciplinary workshop in Mexico, and how these approaches foster a rounded approach to addressing the challenges in communicating risk in earth sciences research. In the field of geohazards, this approach is increasingly becoming adopted due to the concept of “cascading hazards”, or in other words, recognising that when a natural hazard causes a human disaster it often does so as part of a chain of events, rather than as a standalone incident. This is especially true in my field of research; landslides. Landslides are, after all, geological phenomena studied by a wide range of “geoscientists” (read: geologists, geomorphologists, remote sensors, geophysicists, meteorologists, environmental scientists, risk assessors, geotechnical and civil engineers, disaster risk-reduction agencies, the list goes on). Sadly, these natural hazards affect many people across the globe, and we have had several shocking reminders in recent months of how landslides are an inextricable hazard in areas prone to earthquakes and extremes of precipitation.

The iRALL, or the ‘International Research Association on Large Landslides’, is a consortium of researchers from across the world trying to adopt this approach to understanding cascading hazards, with a particular focus on landslides. I was lucky enough to attend the ‘iRALL School 2018: Field data collection, monitoring and modelling of large landslides’ in October this year, hosted by the State Key Laboratory of Geohazard Prevention and Geoenvironment Protection (SKLGP) at Chengdu University of Technology (CDUT), Chengdu, China. The school was attended by over 30 postgraduate and postdoctoral researchers working in fields related to landslide and earthquake research. The diversity of students, both in terms of subjects and origins, was staggering: geotechnical and civil engineers from the UK, landslide specialists from China, soil scientists from Japan, geologists from the Himalaya region, remote sensing researchers from Italy, earthquake engineers from South America, geophysicists from Belgium; and that’s just some of the students! In the two weeks we spent in China, we received presentations from a plethora of global experts, delivering lectures in all aspects of landslide studies, including landslide failure mechanisms, hydrology, geophysics, modelling, earthquake responses, remote sensing, and runout analysis amongst others. Having such a well-structured program of distilled knowledge delivered by these world-class researchers would have been enough, but one of the highlights of the school was the fieldwork attached to the lectures.

The scale of landslides affecting Beichuan County is difficult to grasp: in this photo of the Tangjiwan landslide, the red arrow points to a one story building. This landslide was triggered by the 2008 Wenchuan earthquake, and reactivated by heavy rainfall in 2016.

The first four days of the school were spent at SKLGP at CDUT, learning about the cascading hazard chain caused by the 2008 Wenchuan earthquake, another poignant event which demonstrates the interconnectivity of natural hazards. On 12th May 2008, a magnitude 7.9 earthquake occurred in Beichuan County, China’s largest seismic event for over 50 years. The earthquake triggered the immediate destabilisation of more than 60,000 landslides, and affected an area of over 35,000 km2; the largest of these, the Daguangbao landslide, had an estimated volume of 1.2 billion m3 (Huang and Fan, 2013). It is difficult to comprehend numbers on these scales, but here’s an attempt: 35,000 km2 is an area bigger than the Netherlands, and 1.2 billion m3 is the amount of material you would need to fill the O2 Arena in London 430 times over. These comparisons still don’t manage to convey the scale of the devastation of the 2008 Wenchuan earthquake, and so after the first four days in Chengdu, it was time to move three hours north to Beichuan County, to see first-hand the impacts of the earthquake from a decade ago. We would spend the next ten days here, continuing a series of excellent lectures punctuated with visits to the field to see and study the landscape features that we were learning about in the classroom.

The most sobering memorial of the 2008 Wenchuan earthquake is the ‘Beichuan Earthquake Historic Site’, comprising the stabilised remains of collapsed and partially-collapsed buildings of the town of Old Beichuan. This town was situated close to the epicentre of the Wenchuan earthquake, and consequently suffered huge damage during the shaking, as well as being impacted by two large landslides which buried buildings in the town; one of these landslides buried a school with over 600 students and teachers inside. Today, a single basketball hoop in the corner of a buried playground is all that identifies it as once being a school. In total, around 20,000 people died in a town with a population of 30,000. Earth science is an applied field of study, and as such, researchers are often more aware of the impact of their research on the public than in some other areas of science. Despite this, we don’t always come this close to the devastation that justifies the importance of our research in the first place.

River erosion damaging check-dams designed to stop debris flows is still a problem in Beichuan County, a decade after the 2008 Wenchuan earthquake.

It may be a cliché, but seeing is believing, and the iRALL School provided many opportunities to see the lasting impacts of large slope failures, both to society and the landscape. The risk of debris flows resulting from the blocking of rivers by landslides (a further step in the cascading hazard chain surrounding earthquakes and landslides) continues to be a hazard threatening people in Beichuan County today. Debris flow check-dams installed after the 2008 Wenchuan earthquake are still being constantly maintained or replaced to provide protection to vulnerable river valleys, and the risk of reactivation of landslides in a seismically active area is always present. But this is why organisations such as the iRALL, and their activities such as the iRALL School are so important; it is near impossible to gain a true understanding of the impact of cascading hazards without bringing the classroom and the field together. The same is true when trying to work on solutions to lessen the impact of these cascading hazard chains. It is only by collaborating with people from a broad range of backgrounds, skills and experiences can we expect to come up with effective solutions that are more than the sum of their parts.

—————
This blog has been reposted with kind permission from James Whiteley.  View the original blog on BGS Geoblogy.   This blog was written by James Whiteley, a geophysicist and geologist at University of Bristol, hosted by British Geological Survey. Jim is funded through the BGS University Funding Initiative (BUFI). The aim of BUFI is to encourage and fund science at the PhD level. At present there are around 130 PhD students who are based at about 35 UK universities and research institutes. BUFI do not fund applications from individuals.

Participating and coaching at a risk communication ‘pressure cooker’ event

Anna Hicks (British Geological Survey) and BUFI Student (University of Bristol) Jim Whiteley reflect on their experiences as a coach and participant of a NERC-supported risk communication ‘pressure cooker’, held in Mexico City in May.

Jim’s experience….

When the email came around advertising “the Interdisciplinary Pressure Cooker on Risk Communication that will take place during the Global Facility for Disaster Reduction and Recovery (GFDRR; World Bank) Understanding Risk Forum in May 2018, Mexico City, Mexico” my thoughts went straight to the less studious aspects of the description:

‘Mexico City in May?’ Sounds great!
‘Interdisciplinary risk communication?’ Very à la mode! 
‘The World Bank?’ How prestigious! 
‘Pressure Cooker?’ Curious. Ah well, I thought, I’ll worry about that one later…

As a PhD student using geophysics to monitor landslides at risk of failure, communicating that risk to non-scientists isn’t something I am forced to think about too often. This is paradoxical, as the risk posed by these devastating natural hazards is the raison d’être for my research. As a geologist and geophysicist, I collect numerical data from soil and rocks, and try to work out what this tells us about how, or when, a landslide might move. Making sense of those numbers is difficult enough as it is (three and a half years’ worth of difficult to be precise) but the idea of having to take responsibility for, and explain how my research might actually benefit real people in the real world? Now that’s a daunting prospect to confront.

However, confront that prospect is exactly what I found myself doing at the Interdisciplinary Pressure Cooker on Risk Communication in May this year. The forty-odd group of attendees to the pressure cooker were divided in to teams; our team was made up of people working or studying in a staggeringly wide range of areas: overseas development in Africa, government policy in the US, town and city planning in Mexico and Argentina, disaster risk reduction (DRR) in Colombia, and of course, yours truly, the geophysicist looking at landslides in Yorkshire.

Interdisciplinary? Check.

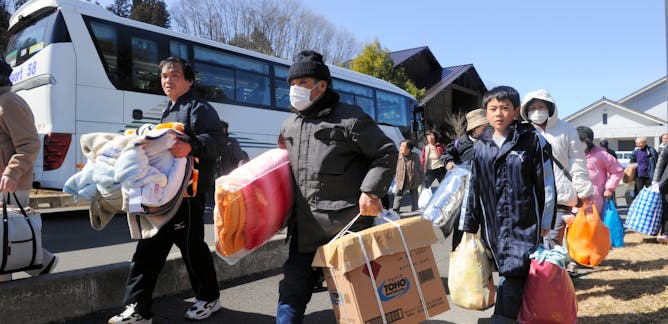
One hour before the 4am deadline.

The possible issues to be discussed were as broad as overfishing, seasonal storms, population relocation and flooding. My fears were alleviated slightly, when I found that our team was going to be looking at hazards related to ground subsidence and cracking. Easy! I thought smugly. Rocks and cracks, the geologists’ proverbial bread and butter! We’ll have this wrapped up by lunchtime! But what was the task? Develop a risk communication strategy, and devise an effective approach to implementing this strategy, which should be aimed at a vulnerable target group living in the district of Iztapalapa in Mexico City, a district of 1.8 million people. Right.

Risk communication? Check.

It was around this time I realised that I glossed over the most imperative part of the email that had been sent around so many months before: ‘Pressure Cooker’. It meant exactly what it said on the tin; a high-pressure environment in which something, in this case a ‘risk communication strategy’ needed to be cooked-up quickly. Twenty-four hours quickly in fact. There would be a brief break circa 4am when our reports would be submitted, and then presentations were to be made to the judges at 9am the following morning. I checked the time. Ten past nine in the morning. The clock was ticking.

Pressure cooker? Very much check.

Anna’s experience….

What Jim failed to mention up front is it was a BIG DEAL to win a place in this event. 440 people from all over the world applied for one of 35 places. So, great job Jim! I was also really grateful to be invited to be a coach for one of the groups, having only just ‘graduated’ out of the age bracket to be a participant myself! And like Jim, I too had some early thoughts pre-pressure cooker, but mine were a mixture of excitement and apprehension in equal measures:

‘Mexico City in May?’ Here’s yet another opportunity to show up my lack of Spanish-speaking skills…
‘Interdisciplinary risk communication?’ I know how hard this is to do well…
‘The World Bank?’ This isn’t going to be your normal academic conference! 
‘Pressure Cooker?’ How on earth am I going to stay awake, let alone maintain good ‘coaching skills’?!

As an interdisciplinary researcher working mainly in risk communication and disaster risk reduction, I was extremely conscious of the challenges of generating risk communication products – and doing it in 24 hours? Whoa. There is a significant lack of evidence-based research about ‘what works’ in risk communication for DRR, and I knew from my own research that it was important to include the intended audience in the process of generating risk communication ‘products’. I need not have worried though. We had support from in-country experts that knew every inch of the context, so we felt confident we could make our process and product relevant and salient for the intended audience. This in part was also down to the good relationships we quickly formed in our team, crafted from patience, desire and ability to listen to each other, and for an unwavering enthusiasm for the task!

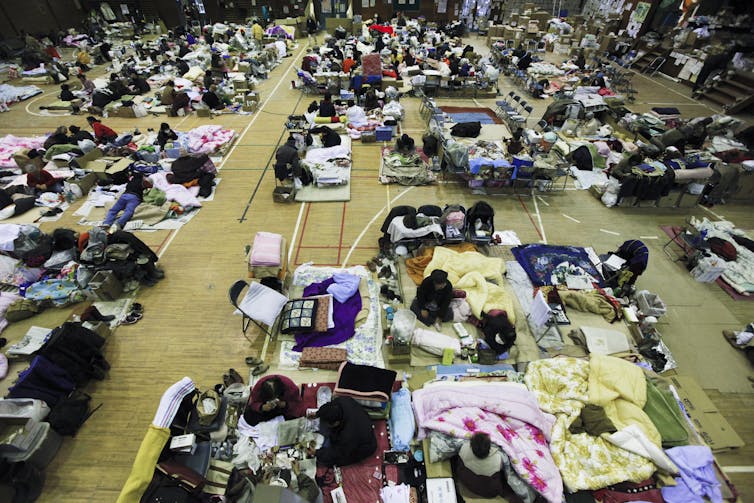
The morning after the night before.

So we worked through the day and night on our ‘product’ – a community based risk communication strategy aimed at women in Iztapalapa with the aim of fostering a community of practice through ‘train the trainer’ workshops and the integration of art and science to identify and monitor ground cracking in the area.

The following morning, after only a few hours’ sleep, the team delivered their presentation to fellow pressure-cooker participants, conference attendees, and importantly, representatives of the community groups and emergency management teams in the geographical areas in which our task was focused. The team did so well and presented their work with confidence, clarity and – bags of the one thing that got us through the whole pressure cooker – good humour.

It was such a pleasure to be part of this fantastic event and meet such inspiring people, but the icing on the cake was being awarded ‘Best Interdisciplinary Team’ at the awards ceremony that evening. ‘Ding’! Dinner served.

—————
This blog has been reposted with kind permission from James Whiteley.  View the original blog on BGS Geoblogy.   This blog was written by James Whiteley, a geophysicist and geologist at University of Bristol, hosted by British Geological Survey and Anna Hicks from the British Geologial Survey.

Privacy paradoxes, digital divides and secure societies

More and more, we are living our lives in the online space. The development of wearable technology, automated vehicles, and the Internet of Things means that our societies are becoming increasingly digitized. Technological advances are helping monitor city life, target resources efficiently, and engage with citizens more effectively in so-called smart cities. But as with all technological developments, these substantial benefits are accompanied by multiple risks and challenges.

The Wannacry attack. The TalkTalk data breach. The Cambridge Analytica scandal. Phishing emails. Online scams. The list of digital threats reported by the media is seemingly endless. To tackle these growing threats, the National Cyber Security Centre (NCSC) was established in the UK in 2016 with the aim of making ‘the UK the safest place to live and do business online’. But with the increasing complexity of online life, connected appliances, and incessant data collection, how do people navigate these challenges in their day-to-day lives? As a psychologist, I am interested in how people consider and make decisions regarding these digital risks and how we can empower people to make more informed choices going forward.

The privacy paradox

People often claim that privacy is important to them. However, research shows that they are often willing to trade that privacy for short-term benefits. This incongruence between people’s self-reported attitudes and their behaviour has been termed the ‘privacy paradox’. The precise reasons for this are uncertain, but are likely to be a combination of lack of knowledge, competing goals and priorities, and the fact that maintaining privacy can be, well, difficult.

Security is often not an individual’s primary goal, instead being secondary to other tasks that they are trying to complete. For instance, accessing a particular app, sharing location data to find directions, or communicating on the move with friends and colleagues. Using these online services, however, often requires a trade-off with regards to privacy. This trade-off may be unclear, communicated through incomprehensible terms and conditions, or simply unavoidable for the user. Understanding what drives people to make these privacy trade-offs, and under what conditions, is a growing research area.

The digital divide

As in other areas of life, access to technology across society is not equal. Wearable technology and smart phones can be expensive. People may not be familiar with computers or have low levels of digital literacy. There are also substantial ethical implications about how such data may be used that are still being debated. For instance, how much will the information captured and analysed about citizens differ across socio-economic groups?

Research has also shown that people are differentially susceptible to cyber crime, with generational differences apparent (although, not always in the direction that you would expect). Trust in the institutions that handle digital data may vary across communities. Existing theories of societal differences, such as the Cultural Theory of Risk, are increasingly being applied to information security behaviour. Understanding how different groups within society perceive, consider, and are differentially exposed to, digital risks is vital if the potential benefits of such technologies are to be maximised in the future.

Secure societies – now and in the future

Regulation: The General Data Protection Regulation (GDPR) comes into force on the 25 May 2018. Like me, you may have been receiving multiple emails from companies informing you how they use your data, or asking your permission to keep it. This regulation is designed to help people manage their privacy and understand who has access to their data, and why. It also allows for substantial fines to be imposed if personal data is not managed adequately or if data breaches are not reported to authorities in a timely manner.

Secure by default: There is a growing recognition that products should have security built-in. Rather than relying on us, the human user, to understand and manage security settings on the various devices that we own, such devices should be ‘secure by default’. Previous considerations of humans as the ‘weakest link’ in cyber security are being replaced with an understanding that people have limited time, expertise and ability to manage security. The simplified password guidance provided by the NCSC provides a good example of this (7). Devices,  applications and policies should take the onus off the user as much as possible.

Education and communication: People need to be educated about online risks in an engaging, relevant and targeted way. Such risks can be perceived as abstract and distant from the individual, and can be difficult to understand at the technical level. I was recently paired with an artist as part of Creative Reactions 2018 (an art exhibition running in Hamilton House 11 – 22 May 2018) to portray my research in this area to members of the public in a different way. Understanding how best to communicate digital risks to diverse audiences who engage with the online world in a range of different contexts is crucial. In this regard, there is much to be learned from risk communication approaches used in climate change, public health, and energy sectors.

Overall, there is much to be optimistic about. A renewed focus on empowering people to understand digital risks and make informed decisions, supported by regulation, secure design and considerations of ethical issues. Only by understanding how people make decisions regarding online activities and emerging technologies, and providing them with the tools to manage their privacy and security effectively, can the opportunities provided by a digital society be fully realised in cities of the future.

——————————–
This blog has been written by Cabot Institute member Dr Emma Williams, a Vice-Chancellor’s Fellow in Digital Innovation and Well-being in the School of Experimental Psychology at the University of Bristol.

Dadaism in Disaster Risk Reduction: Reflections against method

Much like Romulus and Remus, we the academic community must take the gift bestowed unto us by the Lupa Capitolina of knowledge and enact progressive change in these uncertain and complex times.

Reflections and introductions: A volta

The volta is a poetic device, closely but not solely, associated with the Shakespearean sonnet, used to enact a dramatic change in thought or emotion. Concomitant with this theme is that March is a month with symbolic links to change and new life. The Romans famously preferred to initiate the most significant socio-political manoeuvres of the empire during the first month of their calendar, mensis Martius. A month that marked the oncoming of spring, the weakening of winter’s grip on the land and a time for new life.

The need for change

Having very recently attended the March UKADR conference, organised by the Cabot Institute here in Bristol, I did so with some hope and anticipation. Hope and anticipation for displays and discussions that conscientiously touched upon this volta, this need for change in how we study the dynamics of natural hazards. The conference itself was very agreeable, it had great sandwiches, with much stimulating discussion taking place and many displays of great skill and ingenuity having been demonstrated. Yet, despite a few instances where this need for change was indirectly touched upon by a handful of speakers and displays, I managed to go the entirety of the conference without getting what I really wanted, an explicit discussion, mention, susurration of the role of emergence in natural disaster and resilience.

Understanding the problem

My interest in this kind of science is essentially motivated by merit of my Ph.D. research, here at the School of Geographical Sciences in Bristol, broadly concentrating on modelling social influence on, and response to, natural perturbations in the physical environment, i.e. urban flooding scenarios. From the moment I began the preliminary work for this project, it has steadily transformed into a much more complex mise-en-abyme of human inter-social dynamics, of understanding how these dynamics determine the systems within which we exist, both social and physical, and then the broader dynamics of these systems when change is enacted from within and upon them externally. A discipline known broadly as Complex Physical and Adaptive Systems, of which a very close theoretical by-product is the concept of emergence.
An enormous preoccupation throughout my research to this point has been in developing ways to communicate the links between these outlying concepts and those that are ad unicum subsidium. Emergence itself is considered a rather left-field concept, essentially because you can’t physically observe it happening around you. Defined, broadly, as a descriptive term whereby “the whole is greater than the sum of the parts”, it can be used to describe a system which is characterised by traits beyond those of the individual parts that comprise that system, some examples include a market economy, termite mounds, a rainforest ecosystem, a city and the internet. Applying this concept to human systems affected by natural disasters, to interpret the dynamics therein, is quite simple but due to the vast inter-disciplinary nature of doing so is seen as being a bit of an academic taboo.
A schematic representing the nature of a complex system. Vulnerability, Risk and hazards would co-exist as a supervenient, complex hierarchy.
So then, I remind myself that I shouldn’t feel downhearted, I saw clear evidence that we, the academic community, are certainly asking the right questions now and more often than ever before;
  • “How do we translate new methods for vulnerability and risk assessment into practice?”
  • “Are huge bunches of data, fed through rigid equations and tried and tested methods, really all we need to reduce the impacts of vulnerability and exposure, or do we need to be more dynamic in our methods?”
  • “Are the methods employed in our research producing an output with which the affected communities in vulnerable areas can engage with? If not, then why not and how can this be improved?”

Moving forward

Upon reflection, this pleased me. These questions are an acknowledgement of the complex hazard systems which exist and indicate that we are clearly thinking about the links between ourselves, our personal environment and the natural environment at large. Furthermore, it is clear, from the themes within these questions, that academia is crawling its way towards accepted and mainstream interdisciplinary method and practice. I am pleased, though not satiated, as I witnessed a discussion in the penultimate conference session where “more data and community training” was suggested as a solution to ever-increasing annual losses attributable to natural disasters globally. I am inherently pessimistic, but I am as unconvinced by the idea of Huxleyesque, neo-Pavlovian disaster training for the global masses as I am unmotivated by the value of my research being placed in the amount of data it produces to inform such exercises!
“Don’t judge each day by the harvest you reap but by the seeds that you plant.” – Robert Louis Stevenson (image is of The Sower, from The Wheat Fields series by Vincent Van Gough, June 1888 – source: Wikipedia.)
Thus, it is as we now enter the month of April, mensis Aprilis, a month that is truly symbolic of Spring and one which embodies a time where new seeds are sewn carefully in the fields, where thorough work can take place and the seeds may be tended after the long wait for the darkness and cold of winter to pass; that we must consider the work that needs to be done in eliciting progressive change. Consider this volta, allow the warmth of the April showers to give life to the fresh seeds of knowledge we sow and may Ēostre assist us in the efficient reaping of the new knowledge we need to answer the most pressing questions in this world. At least before the data is stuck in a biblical excel spreadsheet and used to inform global anti-tsunami foot drills, or some such!
————————–
This blog was written by Cabot Institute member, Thomas O’Shea, a 2nd year Ph.D. Researcher at the School of Geographical Sciences, University of Bristol. His interests span Complex Systems, Hydrodynamics, Risk and Resilience and Machine Learning.  Please direct any desired correspondence regarding the above to his university email at: t.oshea@bristol.ac.uk.
Thomas O’Shea

Evacuating a nuclear disaster area is (usually) a waste of time and money, says study

Asahi Shimmbun/EPA

More than 110,000 people were moved from their homes following the Fukushima nuclear disaster in Japan in March 2011. Another 50,000 left of their own will, and 85,000 had still not returned four-and-a-half years later.

While this might seem like an obvious way of keeping people safe, my colleagues and I have just completed research that shows this kind of mass evacuation is unnecessary, and can even do more harm than good. We calculated that the Fukushima evacuation extended the population’s average life expectancy by less than three months.

To do this, we had to estimate how such a nuclear meltdown could affect the average remaining life expectancy of a population from the date of the event. The radiation would cause some people to get cancer and so die younger than they otherwise would have (other health effects are very unlikely because the radiation exposure is so limited). This brings down the average life expectancy of the whole group.

But the average radiation cancer victim will still live into their 60s or 70s. The loss of life expectancy from a radiation cancer will always be less than from an immediately fatal accident such as a train or car crash. These victims have their lives cut short by an average of 40 years, double the 20 years that the average sufferer of cancer caused by radiation exposure. So if you could choose your way of dying from the two, radiation exposure and cancer would on average leave you with a much longer lifespan.

How do you know if evacuation is worthwhile?

To work out how much a specific nuclear accident will affect life expectancy, we can use something called the CLEARE (Change of life expectancy from averting a radiation exposure) Programme). This tells us how much a specific dose of radiation will shorten your remaining lifespan by on average.

Yet knowing how a nuclear meltdown will affect average life expectancy isn’t enough to work out whether it is worth evacuating people. You also need to measure it against the costs of the evacuation. To do this, we have developed a method known as the judgement or J-value. This can effectively tell us how much quality of life people are willing to sacrifice to increase their remaining life expectancy, and at what point they are no longer willing to pay.

You can work out the J-value for a specific country using a measure of the average amount of money people in that country have (GDP per head) and a measure of how averse to risk they are, based on data about their work-life balance. When you put this data through the J-value model, you can effectively find the maximum amount people will on average be willing to pay for longer life expectancy.

After applying the J-value to the Fukushima scenario, we found that the amount of life expectancy preserved by moving people away was too low to justify it. If no one had been evacuated, the local population’s average life expectancy would have fallen by less than three months. The J-value data tells us that three months isn’t enough of a gain for people to be willing to sacrifice the quality of life lost through paying their share of the cost of an evacuation, which can run into billions of dollars (although the bill would actually be settled by the power company or government).

Japanese evacuation centre. Dai Kurokawa/EPA

The three month average loss suggests the number of people who will actually die from radiation-induced cancer is very small. Compare it to the average of 20 years lost when you look at all radiation cancer sufferers. In another comparison, the average inhabitant of London loses 4.5 months of life expectancy because of the city’s air pollution. Yet no one has suggested evacuating that city.
We also used the J-value to examine the decisions made after the world’s worst nuclear accident, which occurred 25 years before Fukushima at the Chernobyl nuclear power plant in Ukraine. In that case, 116,000 people were moved out in 1986, never to return, and a further 220,000 followed in 1990.

By calculating the J-value using data on people in Ukraine and Belarus in the late 1980s and early 1990s, we can work out the minimum amount of life expectancy people would have been willing to evacuate for. In this instance, people should only have been moved if their lifetime radiation exposure would have reduced their life expectancy by nine months or more.

This applied to just 31,000 people. If we took a more cautious approach and said that if one in 20 of a town’s inhabitants lost this much life expectancy, then the whole settlement should be moved, it would still only mean the evacuation of 72,500 people. The 220,000 people in the second relocation lost at most three months’ life expectancy and so none of them should have been moved. In total, only between 10% and 20% of the number relocated needed to move away.

To support our research, colleagues at the University of Manchester analysed hundreds of possible large nuclear reactor accidents across the world. They found relocation was not a sensible policy in any of the expected case scenarios they examined.

More harm than good

Some might argue that people have the right to be evacuated if their life expectancy is threatened at all. But overspending on extremely expensive evacuation can actually harm the people it is supposed to help. For example, the World Heath Organisation has documented the psychological damage done to the Chernobyl evacuees, including their conviction that they are doomed to die young.

From their perspective, this belief is entirely logical. Nuclear refugees can’t be expected to understand exactly how radiation works, but they know when huge amounts of money are being spent. These payments can come to be seen as compensation, suggesting the radiation must have left them in an awful state of health. Their governments have never lavished such amounts of money on them before, so they believe their situation must be dire.

The ConversationBut the reality is that, in most cases, the risk from radiation exposure if they stay in their homes is minimal. It is important that the precedents of Chernobyl and Fukushima do not establish mass relocation as the prime policy choice in the future, because this will benefit nobody.

————————————-
This blog has been written by Cabot Institute member Philip Thomas, Professor of Risk Management, University of Bristol.

Professor Philip Thomas

This article was originally published on The Conversation. Read the original article.

Scaling up probabilities in space

Suppose you have some location or small area, call it location A, and you have decided for this location the 1-in-100 year event for some magnitude in that area is ‘x’. That is to say, the probability of an event with magnitude exceeding ‘x’ in the next year at location A is 1/100. For clarity, I would rather state the exact definition, rather than say ‘1-in-100 year event’.

Now suppose you have a second location, call it location B, and you are worried about an event exceeding ‘x’ in the next year at either location A or location B. For simplicity suppose that ‘x’ is the 1-in-100 year event at location B as well, and suppose also that the magnitude of events at the two locations are probabilistically independent. In this case “an event exceeding ‘x’ in the next year at either A or B” is the logical complement of “no event exceeding ‘x’ in the next year at A, AND no event exceeding ‘x’ in the next year at B”; in logic this is known as De Morgan’s Law. This gives us the result:

Pr(an event exceeding ‘x’ in the next year at either A or B) = 1 – (1 – 1/100) * (1 – 1/100).

This argument generalises to any number of locations. Suppose our locations are numbered from 1 up to n, and let ‘p_i’ be the probability that the magnitude exceeds some threshold ‘x’ in the next year at location i. I will write ‘somewhere’ for ‘somewhere in the union of the n locations’. Then, assuming probabilistic independence as before,

Pr(an event exceeding ‘x’ in the next year somewhere) = 1 – (1 – p_1) * … * (1 – p_n).

If the sum of all of the p_i’s is less than about 0.1, then there is a good approximation to this value, namely

Pr(an event exceeding ‘x’ in the next year somewhere) = p_1 + … + p_n, approximately.

But don’t use this approximation if the result is more than about 0.1, use the proper formula instead.

One thing to remember is that if ‘x’ is the 1-in-100 year event for a single location, it is NOT the 1-in-100 year event for two or more locations.  Suppose that you have ten locations, and x is the 1-in-100 year event for each location, and assume probabilistic independence as before.  Then the probability of an event exceeding ‘x’ in the next year somewhere is 1/10. In other words, ‘x’ is the 1-in-10 year event over the union of the ten locations. Conversely, if you want the 1-in-100 year event over the union of the ten locations then you need to find the 1-in-1000 year event at an individual location.

These calculations all assumed that the magnitudes were probabilistically independent across locations. This was for simplicity: the probability calculus tells us exactly how to compute the probability of an event exceeding ‘x’ in the next year somewhere, for any joint distribution of the magnitudes at the locations. This is more complicated: ask your friendly statistician (who will tell you about the awesome inclusion/exclusion formula). The basic message doesn’t change, though. The probability of exceeding ‘x’ somewhere depends on the number of locations you are considering. Or, in terms of areas, the probability of exceeding ‘x’ somewhere depends on the size of the region you are considering.

Blog post by Prof. Jonathan Rougier, Professor of Statistical Science.

First blog in series here.

Second blog in series here.

Third blog in series here.

Fourth blog in series here.

What is Probability?

The paradox of probability

Probability is a quantification of uncertainty. We use probability words in our everyday discourse: impossible, very unlikely, 50:50, likely, 95% certain, almost certain, certain. This suggests a shared understanding of what probability is, and yet it has proved very hard to operationalise probability in a way that is widely accepted.

Uncertainty is subjective

Uncertainty is a property of the mind, and varies between people, according to their learning and experiences, way of thinking, disposition, and mood. Were we being scrupulous we would always say “my probability” or “your probability” but never “the probability”. When we use “the”, it is sometimes justified by convention, in situations of symmetry: tossing a coin, rolling a dice, drawing cards from a pack, balls from a lottery machine. This convention is wrong, but useful — were we to inspect a coin, a dice, a pack of cards, or a lottery machine, we would discover asymmetry.

Agreement about symmetry is an example of a wider phenomenon, namely consensus. If well-informed people agree on a probability, then we might say “the probability”. Probabilities in public discourse are often of this form, for example the IPCC’s “extremely likely” (at least 95% certain) that human activities are the main cause of global warming since the 1950s. Stated probabilities can never be defended as ‘objective’, because they are not. They are defensible when they represent a consensus of well-informed people. People wanting to disparage this type of stated probability will attack the notion of consensus amongst well-informed people, often by setting absurdly high standards for what we mean by ‘consensus’, closer to ‘unanimity’.

Abstraction in mathematics

Probability is a very good example of the development of abstraction in mathematics. Early writers on probability in the 17th century based their calculations strongly on their intuition. By the 19th century mathematicians were discovering that intuition was not good guide to the further development of their subject. Into the 20th century mathematics was increasingly defined by mathematicians as ‘the manipulation of symbols according to rules’, which is the modern definition. What was surprising and gratifying is that mathematical abstraction continued (and continues) to be useful in reasoning about the world. This is known as “the unreasonable effectiveness of mathematics”.

The abstract theory of probability was finally defined by the great 20th century mathematician Andrey Kolmogorov, in 1933: the recency of this date showing how difficult this was. Kolmogorov’s definition paid no heed at all to what ‘probability’ meant; only the rules for how probabilities behaved were important. Stripped to their essentials, these rules are:

1. If A is a proposition, then Pr(A) >= 0.
2. If A is certainly true, then Pr(A) = 1.
3. If A and B are mutually exclusive (i.e. they cannot both be true), then Pr(A or B) = Pr(A) + Pr(B).

The formal definition is based on advanced mathematical concepts that you might learn in the final year of a maths degree at a top university.

‘Probability theory’ is the study of functions ‘Pr’ which have the three properties listed above. Probability theorists are under no obligations to provide a meaning for ‘Pr’. This obligation falls in particular to applied statisticians (also physicists, computer scientists, and philosophers), who would like to use probability to make useful statements about the world.

Probability and betting

There are several interpretations of probability. Out of these, one interpretation has emerged to be both subjective and generic: probability is your fair price for a bet. If A is a proposition, then Pr(A) is the amount you would pay, in £, for a bet which pays £0 if A turns out to be false, and £1 if A turns out to be true. Under this interpretation rules 1 and 2 are implied by the reasonable preference for not losing money. Rule 3 is also implied by the same preference, although the proof is arcane, compared to simple betting. The overall theorem is called the Dutch Book Theorem: if probabilities are your fair prices for bets, then your bookmaker cannot make you a sure loser if and only if your probabilities obey the three rules.

This interpretation is at once liberating and threatening. It is liberating because it avoids the difficulties of other interpretations, and emphasises what we know to be true, that uncertainty is a property of the mind, and varies from person to person. It is threatening because it does not seem very scientific — betting being rather trivial — and because it does not conform to the way that scientists often use probabilities, although it does conform quite closely to the vernacular use of probabilities. Many scientists will deny that their probability is their fair price for a bet, although they will be hard-pressed to explain what it is, if not.

Blog post by Prof. Jonathan Rougier, Professor of Statistical Science.

First blog in series here.


Second blog in series here

Third blog in series here.