**Article re-posted from EURACTIV **
Forest mitigation should be measured using a scientifically-objective approach, not allowing countries to hide the impacts of policies that increase net emissions, writes a group of environmental scientists led by Dr Joanna I House.
Dr Joanna I House is a reader in environmental science and policy at the Cabot Institute, University of Bristol, UK. She co-signed this op-ed with other environmental scientists listed at the bottom of the article.
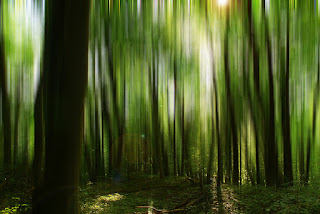 |
| From an atmospheric perspective, a reduction in the forest sink leads to more CO2 remaining in the atmosphere and is thus effectively equivalent to a net increase in emissions. [Yannik S/Flickr] |
When President Trump withdrew from the Paris Agreement, the EU’s Climate Commissioner, Miguel Arias Cañete spoke for all EU Member States when he said that, “This has galvanised us rather than weakened us, and this vacuum will be filled by new broad committed leadership.” The French President, Emmanuel Macron, echoed him by tweeting, “Make our planet great again”.
But as the old saying goes, ‘If you talk the talk, you must walk the walk,’ and what better place to start than the very laws the EU is currently drafting to implement its 2030 climate target under the Paris Agreement. This includes a particularly contentious issue that EU environment leaders will discuss on 19 June, relating to the rules on accounting for the climate impact of forests.
Forests are crucial to limiting global warming to 2 degrees Celsius. Deforestation is responsible for almost one tenth of anthropogenic carbon dioxide (CO2) emissions, while forests remove almost a third of CO2 emissions from the atmosphere.
In the EU, forests currently grow more than they are harvested. As a result, they act as a net ‘sink’ of CO2 removing more than 400 Mt CO2 from the atmosphere annually, equivalent to 10% of total EU greenhouse gas (GHG) emissions.
New policies adopted or intended by Member States will likely drive them to harvest more trees (e.g. for the bioeconomy and bioenergy), reducing the sink. The controversy is, in simple terms, if forests are taking up less CO2 due to policies, should this be counted?
Based on lessons learnt from the Kyoto Protocol, the European Commission proposed that accounting for the impacts of forests on the atmosphere should be based on a scientifically robust baseline. This baseline (known as the ‘Forest Reference Level’) should take into account historical data on forest management activities and forest dynamics (age-related changes). If countries change forest management activities going forward, the atmospheric impact of these changes would be fully accounted based on the resulting changes in GHG emissions and sinks relative to the baseline. This approach is consistent with the GHG accounting of all other sectors.
Subsequently, some EU member states have proposed that any increase in harvesting, potentially up to the full forest growth increment, should not be penalised. This would be achieved by including this increase in harvesting, and the related change in the net carbon sink, in the baseline.
As land-sector experts involved in scientific and methodological reports (including for the Intergovernmental Panel on Climate Change, IPCC), in the implementation of GHG inventory reports, and in science advice to Governments, we have several scientific concerns with this approach.
From an atmospheric perspective, a reduction in the forest sink leads to more CO2 remaining in the atmosphere and is thus effectively equivalent to a net increase in emissions. This is true even if forests are managed “sustainably”, i.e. even if harvest does not exceed forest growth.
This is further complicated as the issues are cross-sectoral. Higher harvest rates may reduce the uptake of CO2 by forests, but use of the harvested wood may lead to emissions reductions in other sectors e.g. through the substitution of wood for other more emissions-intensive materials (e.g. cement) or fossil energy. These emission reductions will be implicitly counted in the non-LULUCF sectors. Therefore, to avoid bias through incomplete accounting, the full impact of increased harvesting must be also accounted for.
Including policy-related harvest increases in the baseline could effectively hide up to 400 MtCO2/yr from EU forest biomass accounting compared to the “sink service” that EU forests provide today, or up to 300 MtCO2/yr relative to a baseline based on a scientific approach (up to two thirds of France’s annual emissions).
If policy-related impacts on net land carbon sinks are ignored or discounted, this would:
- Hamper the credibility of the EU’s bioenergy accounting: Current IPCC guidance on reporting emissions from bioenergy is not to assume that it is carbon neutral, but rather any carbon losses should to be reported under the ‘Land Use, Land-Use Change and Forestry’ (LULUCF) sector rather than under the energy sector (to avoid double counting). EU legislation on bioenergy similarly relies on the assumption that carbon emissions are fully accounted under LULUCF.
- Compromise the consistency between the EU climate target and the IPCC trajectories. The EU objective of reducing GHG emissions of -40% by 2030 (-80/95% by 2050) compared to 1990 is based on the IPCC 2°C GHG trajectory for developed countries. This trajectory is based not just on emissions, but also on land-sinks. Hiding a decrease in the land sink risks failure to reach temperature targets and would require further emission reductions in other sectors to remain consistent with IPCC trajectories.
- Contradict the spirit of the Paris Agreement, i.e., that “Parties should take action to conserve and enhance sinks”, and that Parties should ensure transparency in accounting providing confidence that the nationally-determined contribution of each country (its chosen level of ambition in mitigation) is met without hiding impacts of national policies.
- Set a dangerous precedent internationally, potentially leading other countries to do the same (e.g. in setting deforestation reference levels). This would compromise the credibility of the large expected forest contribution to the Paris Agreement.
The Paris Agreement needs credible and transparent forest accounting and EU leaders are about to make a decision that could set the standard. Including policy-driven increases in harvest in baselines means the atmospheric impacts of forest policies will be effectively hidden from the accounts (while generating GHG savings in other sectors). Basing forest accounting on a scientifically-objective approach would ensure the credibility of bioenergy accounting, consistency between EU targets and the IPCC 2°C trajectory, and compliance with the spirit of Paris Agreement. The wrong decision would increase the risks of climate change and undermine our ability to “make the planet great again”.
Disclaimer: the authors express their view in their personal capacities, not representing their countries or any of the institutions they work for.
***
Signatories:
Joanna I House, Reader in Environmental Science and Policy, Co-Chair Global Environmental Change, Cabot Institute, University of Bristol, UK
Jaana K Bäck, Professor in Forest – atmosphere interactions, Chair of the EASAC Forest multifunctionality report, University of Helsinki, Finland
Valentin Bellassen, Researcher in Agricultural and Environmental Economics, INRA, France
Hannes Böttcher, Senior Researcher at Oeko-Institut.
Eric Chivian M.D., Founder and Former Director, Center for Health and the Global Environment Harvard Medical School
Pep Canadell, Executive Director of the Global Carbon Project
Philippe Ciais, scientist at Laboratoire des Sciences du Climat et de l’Environnement, Gif sur Yvette, France
Philip B. Duffy, President and Executive Director Woods Hole Research Center, USA
Sandro Federici, Consultant on MRV and accounting for mitigation in the Agriculture and land use sector
Pierre Friedlingstein, Chair, Mathematical Modelling of Climate Systems, University of Exeter, UK.
Scott Goetz, Professor, Northern Arizona University
Nancy Harris, Research Manager, Forests Program, World resources Institute.
Martin Herold, Professor for Geoinformation Science and Remote Sensing and co-chair of Global Observations of Forest Cover and Land Dynamics (GOFC-GOLD), Wageningen University and Research, The Netherlands
Mikael Hildén, Professor, Climate Change Programme and the Resource Efficient and Carbon Neutral Finland Programme, Finnish Environment Institute and the Strategic Research Council, Finland
Richard A. Houghton, Woods Hole Research Centre USA
Tuomo Kalliokoski University of Helsinki, Finland
Janne S. Kotiaho, Professor of Ecology, University of Jyväskylä, Finland
Donna Lee, Climate and Land Use Alliance
Anders Lindroth, Lund University, Sweden
Jari Liski, Research Professor, Finnish Meteorological Institute, Finland
Brendan Mackey, Director, Griffith Climate Change Response Program, Griffith University, Australia
James J. McCarthy, Harvard University, USA
William R. Moomaw, Co-director Global Development and Environment Institute, Tufts University, USA
Teemu Tahvanainen, University of Eastern Finland
Olli Tahvonen, Professor forest economics and policy, University of Helsinki, Finland
Keith Pausitan, University Distinguished Professor, Colorado State University, USA
Colin Prentice, AXA Chair in Biosphere and Climate Impacts, Imperial College London, UK
N H Ravindranath, Centre for Sustainable Technologies (CST), Indian Institute of Science, India
Laura Saikku, Senior Scientist, Finnish Environment Institute
Maria J Sanchez, Scientific Director of BC3 (Basque Center for Climate Change), Spain
Sampo Soimakallio, Senior Scientist, Finnish Environment Institute
Zoltan Somogyi, Hungarian Forest Research Institute, Budapest, Hungary
Benjamin Smith, Professor of Ecosystem Science, Lund University, Sweden
Pete Smith, Professor of Soils & Global Change, University of Aberdeen, UK
Francesco N. Tubiello, Te Leader, Agri-Environmental Statistics, FAO
Timo Vesala, Professor of Meteorology, University of Helsinki, Finland
Robert Waterworth
Jeremy Woods, Imperial College London, UK
Dan Zarin, Climate and Land Use Alliance


