Participating and coaching at a risk communication ‘pressure cooker’ event

Anna Hicks (British Geological Survey) and BUFI Student (University of Bristol) Jim Whiteley reflect on their experiences as a coach and participant of a NERC-supported risk communication ‘pressure cooker’, held in Mexico City in May.

Jim’s experience….

When the email came around advertising “the Interdisciplinary Pressure Cooker on Risk Communication that will take place during the Global Facility for Disaster Reduction and Recovery (GFDRR; World Bank) Understanding Risk Forum in May 2018, Mexico City, Mexico” my thoughts went straight to the less studious aspects of the description:

‘Mexico City in May?’ Sounds great!
‘Interdisciplinary risk communication?’ Very à la mode! 
‘The World Bank?’ How prestigious! 
‘Pressure Cooker?’ Curious. Ah well, I thought, I’ll worry about that one later…

As a PhD student using geophysics to monitor landslides at risk of failure, communicating that risk to non-scientists isn’t something I am forced to think about too often. This is paradoxical, as the risk posed by these devastating natural hazards is the raison d’être for my research. As a geologist and geophysicist, I collect numerical data from soil and rocks, and try to work out what this tells us about how, or when, a landslide might move. Making sense of those numbers is difficult enough as it is (three and a half years’ worth of difficult to be precise) but the idea of having to take responsibility for, and explain how my research might actually benefit real people in the real world? Now that’s a daunting prospect to confront.

However, confront that prospect is exactly what I found myself doing at the Interdisciplinary Pressure Cooker on Risk Communication in May this year. The forty-odd group of attendees to the pressure cooker were divided in to teams; our team was made up of people working or studying in a staggeringly wide range of areas: overseas development in Africa, government policy in the US, town and city planning in Mexico and Argentina, disaster risk reduction (DRR) in Colombia, and of course, yours truly, the geophysicist looking at landslides in Yorkshire.

Interdisciplinary? Check.

One hour before the 4am deadline.

The possible issues to be discussed were as broad as overfishing, seasonal storms, population relocation and flooding. My fears were alleviated slightly, when I found that our team was going to be looking at hazards related to ground subsidence and cracking. Easy! I thought smugly. Rocks and cracks, the geologists’ proverbial bread and butter! We’ll have this wrapped up by lunchtime! But what was the task? Develop a risk communication strategy, and devise an effective approach to implementing this strategy, which should be aimed at a vulnerable target group living in the district of Iztapalapa in Mexico City, a district of 1.8 million people. Right.

Risk communication? Check.

It was around this time I realised that I glossed over the most imperative part of the email that had been sent around so many months before: ‘Pressure Cooker’. It meant exactly what it said on the tin; a high-pressure environment in which something, in this case a ‘risk communication strategy’ needed to be cooked-up quickly. Twenty-four hours quickly in fact. There would be a brief break circa 4am when our reports would be submitted, and then presentations were to be made to the judges at 9am the following morning. I checked the time. Ten past nine in the morning. The clock was ticking.

Pressure cooker? Very much check.

Anna’s experience….

What Jim failed to mention up front is it was a BIG DEAL to win a place in this event. 440 people from all over the world applied for one of 35 places. So, great job Jim! I was also really grateful to be invited to be a coach for one of the groups, having only just ‘graduated’ out of the age bracket to be a participant myself! And like Jim, I too had some early thoughts pre-pressure cooker, but mine were a mixture of excitement and apprehension in equal measures:

‘Mexico City in May?’ Here’s yet another opportunity to show up my lack of Spanish-speaking skills…
‘Interdisciplinary risk communication?’ I know how hard this is to do well…
‘The World Bank?’ This isn’t going to be your normal academic conference! 
‘Pressure Cooker?’ How on earth am I going to stay awake, let alone maintain good ‘coaching skills’?!

As an interdisciplinary researcher working mainly in risk communication and disaster risk reduction, I was extremely conscious of the challenges of generating risk communication products – and doing it in 24 hours? Whoa. There is a significant lack of evidence-based research about ‘what works’ in risk communication for DRR, and I knew from my own research that it was important to include the intended audience in the process of generating risk communication ‘products’. I need not have worried though. We had support from in-country experts that knew every inch of the context, so we felt confident we could make our process and product relevant and salient for the intended audience. This in part was also down to the good relationships we quickly formed in our team, crafted from patience, desire and ability to listen to each other, and for an unwavering enthusiasm for the task!

The morning after the night before.

So we worked through the day and night on our ‘product’ – a community based risk communication strategy aimed at women in Iztapalapa with the aim of fostering a community of practice through ‘train the trainer’ workshops and the integration of art and science to identify and monitor ground cracking in the area.

The following morning, after only a few hours’ sleep, the team delivered their presentation to fellow pressure-cooker participants, conference attendees, and importantly, representatives of the community groups and emergency management teams in the geographical areas in which our task was focused. The team did so well and presented their work with confidence, clarity and – bags of the one thing that got us through the whole pressure cooker – good humour.

It was such a pleasure to be part of this fantastic event and meet such inspiring people, but the icing on the cake was being awarded ‘Best Interdisciplinary Team’ at the awards ceremony that evening. ‘Ding’! Dinner served.

—————
This blog has been reposted with kind permission from James Whiteley.  View the original blog on BGS Geoblogy.   This blog was written by James Whiteley, a geophysicist and geologist at University of Bristol, hosted by British Geological Survey and Anna Hicks from the British Geologial Survey.

Will July’s heat become the new normal?

Saddleworth Moor fire near Stalybridge, England, 2018.  Image credit: NASA

For the past month, Europe has experienced a significant heatwave, with both high temperatures and low levels of rainfall, especially in the North. Over this period, we’ve seen a rise in heat-related deaths in major cities, wildfires in Greece, Spain and Portugal, and a distinct ‘browning’ of the European landscape visible from space.

As we sit sweltering in our offices, the question on everyone’s lips seems to be “are we going to keep experiencing heatwaves like this as the climate changes?” or, to put it another way, “Is this heat the new norm?”

Leo Hickman, Ed Hawkins, and others, have spurred a great deal of social media interest with posts highlighting how climate events that are currently considered ‘extreme’, will at some point be called ‘typical’ as the climate evolves.

As part of a two-year project on how future climate impacts different sectors (www.happimip.org), my colleagues and I have been developing complex computer simulations to explore our current climate as well as possible future climates. Specifically, we’re comparing what the world will look like if we meet the targets set out in the Paris agreement: to limit the global average temperature rise to a maximum of 2.0 degrees warming above pre-industrial levels but with the ambition of limiting warming to 1.5 degrees.

The world is already around 1 degree warmer on average than pre-industrial levels, and the evidence to date shows that every 0.5 degree of additional warming will make a significant difference to the weather we experience in the future.

So, we’ve been able to take those simulations and ask the question: What’s the probability of us experiencing European temperatures like July 2018 again if:

  1. We don’t emit any further greenhouse gases and things stay as they are (1 degree above pre-industrial levels).
  2. Greenhouse gas emissions are aggressively reduced, restricting global average temperature rise to 1.5 degrees above pre-industrial levels.
  3. Greenhouse gas emissions are reduced to a lesser extent, restricting global average temperature rise by 2 degrees above pre-industrial levels.

What we’ve found is that European heat of at least the temperatures we have experienced this July are likely to re-occur about once every 5-6 years, on average, in our current climate. While this seems often, remember we have already experienced 1C of global increase in temperature. We’ve also considered the temperature over the whole of Europe, not just focusing on the more extreme parts of the heatwave. If we considered only the hottest regions, this would push our current temperature re-occurrence times closer to 10-20 years. However, using this Europe-wide definition of the current heat event, we find that in the 1.5C future world, temperatures at least this high would occur every other year, and in a 2C world, four out of five summers would likely have heat events that are at least as hot as our current one. Worryingly, our current greenhouse gas emission trajectory is leading us closer to 3C, so urgent and coordinated action is still needed from our politicians around the world.

Our climate models are not perfect, and they cannot capture all aspects of the current heatwave, especially concerning the large-scale weather pattern that ‘blocked’ the cooler air from ending our current heatwave. These deficiencies increase the uncertainty in our future projections, but we still trust the ball-park figures.

Whilst these results are not peer-reviewed, and should be considered as preliminary findings, it is clear that the current increased heat experienced over Europe has a significant impact on society, and that there will be even more significant impacts if we were to begin experiencing these conditions as much as our analysis suggests.

Cutting our emissions now will save us a hell of a headache later.

—————————–
This blog is written by Dr Dann Mitchell (@ClimateDann) and Peter Uhe from the University of Bristol Geographical Sciences department and the Cabot Institute for the Environment.

Dann Mitchell

Coconuts and climate change

Before pursuing an MSc in Climate Change Science and Policy at the University of Bristol, I completed my undergraduate studies in Environmental Science at the University of Colombo, Sri Lanka. During my final year I carried out a research project that explored the impact of extreme weather events on coconut productivity across the three climatic zones of Sri Lanka. A few months ago, I managed to get a paper published and I thought it would be a good idea to share my findings on this platform.

Climate change and crop productivity

There has been a growing concern about the impact of extreme weather events on crop production across the globe, Sri Lanka being no exception. Coconut is becoming a rare commodity in the country, due to several reasons including the changing climate. The price hike in coconuts over the last few years is a good indication of how climate change is affecting coconut productivity across the country. Most coconut trees are no longer bearing fruits and those that do, have nuts which are relatively very small in size.

Coconut production in Sri Lanka

Sri Lanka is among the top 5 largest producers of coconut, alongside Indonesia, Philippines, India and Brazil (FAOSTAT, 2014). Coconut is one of the major plantation crops in Sri Lanka and is second only to rice in providing nutrition (Samita & Lanka, 2000). Coconut cultivation represents 1/5th of the agricultural land of the country and significantly contributes to Sri Lanka’s Gross Domestic Product, export earnings and employment (Fernando et al., 2007).

Mature coconuts develop approximately eleven months after inflorescence opening (Figure 1). Of this, the first three months after inflorescence opening is said to be the most critical period as the young nuts are susceptible to climatic variation (Ranasinghe et al., 2015).

Figure 1: Development stages of a coconut bunch (Source: Coconut Research Institute, Sri Lanka)

The coconut yield is influenced by climatic variables such as rainfall, temperature and relative humidity in addition to other external factors such as pest attacks, diseases, crop management, land suitability and nutrient availability (Peiris et al., 2008). Optimum weather conditions for the growth of coconut include a well distributed annual rainfall of about 1500 mm, a mean air temperature of 27°C and relative humidity of about 80-90% (Peiris et al., 1995).

Impact of extreme weather on coconut productivity

Our study analysed the impact of extreme weather events considering daily temperature and rainfall over a 21-year period (between 1995 and 2015) at selected coconut estates in the wet, dry and intermediate zones of Sri Lanka. The study revealed drought conditions during the first four months after inflorescence opening, had a negative impact on the coconut harvest in the dry and intermediate zones (as revealed by the statistical analyses and the model relationships developed in this study). Possible reasons for this include reduced pollen production due to the exposure of male flowers to elevated temperature (Burke, Velten, & Oliver, 2004) and flower and fruit abortions caused by high temperatures and absence of rainfall over an extended period of time (Nainanayake et al., 2008).

Drought conditions not only disrupt the physiological functions of the coconut palm, but also
contribute to incidences of pest attacks. At present, the Coconut Black Beetle and the Coconut Red
Weevil pose the greatest threat to coconut plantations in Sri Lanka. Drought conditions are very
conducive for Coconut Black Beetles to pupate deep in the soil (Nirula, 1955).

Implications of the findings

This study reinforces the importance of raising awareness on the implications of climate change on crop productivity. During my visits to the coconut plantations, the superintendents of the estates as well as the labourers appeared to be aware of the warming trend of the climate. They had adopted soil moisture conservation methods such as mulching, burying coconut husks and growing cover crops to prevent extreme evapotranspiration. These are short term solutions. If we are to think about sustaining the coconut cultivation in the long-term, it is important to focus our efforts on developing drought tolerant hybrids. Global climate is projected to change continuously due to various natural and anthropogenic reasons. Policy makers and market decision makers can utilize the knowledge on how coconuts respond to drought conditions to formulate better policies and prices. This information can enable us to be better prepared and minimize loss and damage caused by a drought resulting from climate change.

References

Burke, J. J., Velten, J., & Oliver, M. J. (2004). In vitro analysis of cotton pollen germination. Agronomy Journal, 96(2), 359–368.

FAOSTAT. (2014). Retrieved January 7, 2017, from http://www.fao.org/faostat/en/#data/QC/visualize

Fernando, M. T. N., Zubair, L., Peiris, T. S. G., Ranasinghe, C. S., & Ratnasiri, J. (2007). Economic Value of Climate Variability Impacts on Coconut Production in Sri Lanka.

Nainanayake, A., Ranasinghe, C. S., & Tennakoon, N. A. (2008). Effects of drip irrigation on canopy and soil temperature, leaf gas exchange, flowering and nut setting of mature coconut (Cocos nucifera L.). Journal of the National Science Foundation of Sri Lanka, 36(1), 33–40.

Nirula, K. K. (1955). Investigations on the pests of coconut palm. Part II Oryctes rhinoceros L. Indian Coconut Journal, 8(4), 30–79.

Peiris, T. S. G., Hansen, J. W., & Zubair, L. (2008). Use of seasonal climate information to predict coconut
production in Sri Lanka. International Journal of Climatology, 28, 103–110. http://doi.org/10.1002/joc

Peiris, T. S. G., Thattil, R. O., & Mahindapala, R. (1995). An analysis of the effect of climate and weather on coconut (Cocos nucifera). Journal of Experimental Agriculture, 31, 451–460.

Ranasinghe, C. S., Silva, L. R. S., & Premasiri, R. D. N. (2015). Major determinants of fruit set and yield fluctuation in coconut (Cocos nucifera L .). Journal of National Science Foundation of Sri Lanka, 43(3), 253–264.

Samita, S., & Lanka, S. (2000). Arrival Dates of Southwest Monsoon Rains – A Modeling Approach. Tropical Agricultural Research, 12, 265–275.

Acknowledgements: This post is based on a paper published with the support and guidance from my supervisors/ co-authors Dr Erandi Lokupitiya (University of Colombo, Sri Lanka), Dr Pramuditha Waidyarathne (Coconut Research Institute, Sri Lanka) and Dr Ravi Lokupitiya (University of Sri Jayewardenepura, Sri Lanka). 

———————————-
This blog is written by Cabot Institute member Charuni Pathmeswaran.
Charuni Pathmeswaran

Dadaism in Disaster Risk Reduction: Reflections against method

Much like Romulus and Remus, we the academic community must take the gift bestowed unto us by the Lupa Capitolina of knowledge and enact progressive change in these uncertain and complex times.

Reflections and introductions: A volta

The volta is a poetic device, closely but not solely, associated with the Shakespearean sonnet, used to enact a dramatic change in thought or emotion. Concomitant with this theme is that March is a month with symbolic links to change and new life. The Romans famously preferred to initiate the most significant socio-political manoeuvres of the empire during the first month of their calendar, mensis Martius. A month that marked the oncoming of spring, the weakening of winter’s grip on the land and a time for new life.

The need for change

Having very recently attended the March UKADR conference, organised by the Cabot Institute here in Bristol, I did so with some hope and anticipation. Hope and anticipation for displays and discussions that conscientiously touched upon this volta, this need for change in how we study the dynamics of natural hazards. The conference itself was very agreeable, it had great sandwiches, with much stimulating discussion taking place and many displays of great skill and ingenuity having been demonstrated. Yet, despite a few instances where this need for change was indirectly touched upon by a handful of speakers and displays, I managed to go the entirety of the conference without getting what I really wanted, an explicit discussion, mention, susurration of the role of emergence in natural disaster and resilience.

Understanding the problem

My interest in this kind of science is essentially motivated by merit of my Ph.D. research, here at the School of Geographical Sciences in Bristol, broadly concentrating on modelling social influence on, and response to, natural perturbations in the physical environment, i.e. urban flooding scenarios. From the moment I began the preliminary work for this project, it has steadily transformed into a much more complex mise-en-abyme of human inter-social dynamics, of understanding how these dynamics determine the systems within which we exist, both social and physical, and then the broader dynamics of these systems when change is enacted from within and upon them externally. A discipline known broadly as Complex Physical and Adaptive Systems, of which a very close theoretical by-product is the concept of emergence.
An enormous preoccupation throughout my research to this point has been in developing ways to communicate the links between these outlying concepts and those that are ad unicum subsidium. Emergence itself is considered a rather left-field concept, essentially because you can’t physically observe it happening around you. Defined, broadly, as a descriptive term whereby “the whole is greater than the sum of the parts”, it can be used to describe a system which is characterised by traits beyond those of the individual parts that comprise that system, some examples include a market economy, termite mounds, a rainforest ecosystem, a city and the internet. Applying this concept to human systems affected by natural disasters, to interpret the dynamics therein, is quite simple but due to the vast inter-disciplinary nature of doing so is seen as being a bit of an academic taboo.
A schematic representing the nature of a complex system. Vulnerability, Risk and hazards would co-exist as a supervenient, complex hierarchy.
So then, I remind myself that I shouldn’t feel downhearted, I saw clear evidence that we, the academic community, are certainly asking the right questions now and more often than ever before;
  • “How do we translate new methods for vulnerability and risk assessment into practice?”
  • “Are huge bunches of data, fed through rigid equations and tried and tested methods, really all we need to reduce the impacts of vulnerability and exposure, or do we need to be more dynamic in our methods?”
  • “Are the methods employed in our research producing an output with which the affected communities in vulnerable areas can engage with? If not, then why not and how can this be improved?”

Moving forward

Upon reflection, this pleased me. These questions are an acknowledgement of the complex hazard systems which exist and indicate that we are clearly thinking about the links between ourselves, our personal environment and the natural environment at large. Furthermore, it is clear, from the themes within these questions, that academia is crawling its way towards accepted and mainstream interdisciplinary method and practice. I am pleased, though not satiated, as I witnessed a discussion in the penultimate conference session where “more data and community training” was suggested as a solution to ever-increasing annual losses attributable to natural disasters globally. I am inherently pessimistic, but I am as unconvinced by the idea of Huxleyesque, neo-Pavlovian disaster training for the global masses as I am unmotivated by the value of my research being placed in the amount of data it produces to inform such exercises!
“Don’t judge each day by the harvest you reap but by the seeds that you plant.” – Robert Louis Stevenson (image is of The Sower, from The Wheat Fields series by Vincent Van Gough, June 1888 – source: Wikipedia.)
Thus, it is as we now enter the month of April, mensis Aprilis, a month that is truly symbolic of Spring and one which embodies a time where new seeds are sewn carefully in the fields, where thorough work can take place and the seeds may be tended after the long wait for the darkness and cold of winter to pass; that we must consider the work that needs to be done in eliciting progressive change. Consider this volta, allow the warmth of the April showers to give life to the fresh seeds of knowledge we sow and may Ēostre assist us in the efficient reaping of the new knowledge we need to answer the most pressing questions in this world. At least before the data is stuck in a biblical excel spreadsheet and used to inform global anti-tsunami foot drills, or some such!
————————–
This blog was written by Cabot Institute member, Thomas O’Shea, a 2nd year Ph.D. Researcher at the School of Geographical Sciences, University of Bristol. His interests span Complex Systems, Hydrodynamics, Risk and Resilience and Machine Learning.  Please direct any desired correspondence regarding the above to his university email at: t.oshea@bristol.ac.uk.
Thomas O’Shea

New research by Cabot Institute members reveals super eruptions more frequent than previously thought

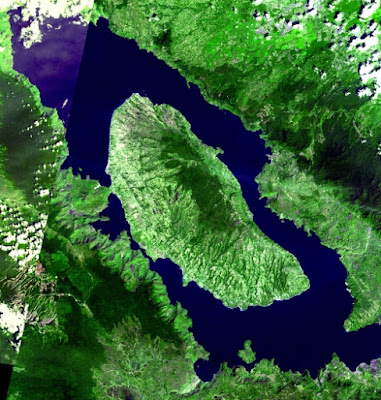
Toba supervolcano – image credit NASA METI AIST Japan Space Systems, and U.S. Japan ASTER Science Team

I’m sat in my office in the Earth Sciences department reading a research paper entitled ‘The global magnitude-frequency relationship for large explosive volcanic eruptions’. Two lines in and I can already picture the headlines: ‘APOCOLYPTIC VOLCANIC ERUPTION DUE ANY DAY’ or perhaps ‘MANAGED TO GET OFF BALI? YOU’RE STILL NOT SAFE FROM THE VOLCANOES. The temptation is to laugh but I suppose it’s not actually very funny.

The paper in question, produced by four Bristol scientists and published in Earth and Planetary Science Letters on Wednesday, uses a database of recorded volcanic eruptions to make estimates about the timing of large world-changing eruptions. It is the first estimate of its kind to use such a comprehensive database and the results are a little surprising.

In case you’re in a rush, the key take-home message is this…

When it comes to rare volcanic eruptions, the past is the key to the future. Volcanoes have erupted in the past. A lot. These past eruptions establish a pattern, which, assuming nothing has changed, can give us clues about the future. This can be done for a range of eruption sizes, but this paper focusses on the biggest of the lot. It turns out they have happened more frequently than previously thought. Yes, it’s surprising. No, you don’t need to worry.

Here’s how they did it:

In reality, supplying the kind of information needed for a study like this is an enormous task. Generations of volcanologists have found evidence of volcanic material from thousands of past eruptions scattered all over the world. Key bits of information on these eruptions has been collected across many years by hundreds of geologists and collated in one place called the LaMEVE database 
The database essentially turns each volcanic eruption into a statistic based on when it erupted and the eruption size. These statistics are the fuel for the study by statistician Prof Jonty Rougier and three volcanologists (and Cabot Institute members), Prof. Steve Sparks, Prof. Katharine Cashman and Dr Sarah Brown.  
The paper highlights that overwhelming majority of these eruptions have been fairly small (think Eyjafjallajökull*, think Stromboli), a smaller proportion have been a bit more lively (heard of Krakatau? Mount St. Helens?) and a really very tiny proportion are so big they might be described as ‘civilisation ending’ if they occurred today. I can’t give a well-known example of one of these as we, fairly obviously, haven’t had one in human timescales. 
Mount St Helens. Credit: Keri McNamara.
To give you a flavour, here are some statistics from the Toba super-eruption that occurred about 75 thousand years ago. The eruption produced a minimum of 2800kmof material.That is equivalent to covering the entire area of the UK in a 12-meter-thick layer of volcanic material, or filling the O2 arena a million times. It is thought the corresponding ash and aerosols that circled the earth cooled the surface temperature by between 3 and 10oC. The reduction in the sun’s radiation would see the death of the majority of plant species, and consequently human’s primary food source.  
 
It paints a rather grim picture. The alarming part of the new study is that eruptions such as Toba might not be as rare as previously thought. Earlier reports have suggested that these eruptions occur every 45-714 thousand years. The new paper revises this range down to 5.2 -48 thousand years with a best guess of one every 17 thousand years. According to geological records, the most recent super eruptions were between 20 and 30 thousand years ago (Taupo 25 ka, Aira 27 ka).
 
Given that humans started to use agriculture around 12 thousand years ago, it seems as though our modern civilization has flourished in the gap between super eruptions. As Prof.Rougier commented: “on balance, we have been slightly lucky not to experience any super-eruptions in the last 20 thousand years.” A little scary perhaps? 

Here’s why you shouldn’t worry:

The really important part of all this is uncertainty.There is a huge amount of statistical leeway either side of these estimates.
Trying to put an exact number on the recurrence interval of something so naturally complex is a bit like trying to estimate the final score of a football match without knowing exactly who the players are. You know how well the team has performed in the past, but you don’t know who will play in the future, or if the same player will behave the same way in every game. There are
also a whole range of things that could happen but probably won’t – perhaps the whole match will get rained off? 
 
 
Volcanoes aren’t much different. Just because a volcano has exhibited one pattern in the past, doesn’t necessarily mean it will do the same in the future. Volcanic systems are infinitely complicated and affected by a huge range of different variables. Assuming perfect cyclicity in eruption recurrence intervals just isn’t realistic. As Prof. Rougier said ‘It is important to appreciate that the absence of super-eruptions in the last 20 ,000 years does not imply that one is overdue.  Nature is not that regular.’ 
On top of that, our records of volcanic eruptions in the past are far from perfect. Sizes of prehistoric eruptions are easily under or overestimated, and some are simply missing from the record. Generally, the further you go back in time, the hazier it gets. While Rougier and his co-authors have done their best to account for these uncertainties, it is impossible to do so completely.  
If that wasn’t enough to put your mind at rest, it is important to remember that geological timescales are a lot bigger than human ones. Whether a volcano erupts every 200 thousand years or 202 thousand years is a very small difference in the context of a volcano’s period of dormancy.
But the extra few
thousand years encompasses the last two millennia and the
hundreds of human generations that have lived within it. 
 
When it comes down to it, the real risks from volcanoes come not from the super-eruptions, but from the smaller, frequent, more locally devastating eruptions. Ultimately, when volcanoes like Agung in Bali erupt, it isn’t us who will suffer. It is those who depend on the volcano for their homes and livelihood who will have to uproot and leave. The real value in this research is not in scare mongering, or in a dramatic headline, it’s developing new techniques that further our understanding of these unpredictable natural phenomena.  


(*Remember
in 2010 when a volcano in Iceland erupted and shut European airspace?
Eyjafjallajökull: Pronounced ‘eye-
yafiyat-la-yerkitle in case anyone’s interested) 
 

Read the original press release Time between world-changing volcanic super-eruptions less than previously thought


—————————————–
This blog is written by Keri McNamara: Cabot Institute writer and geologist in the School of Earth Sciences at the University of Bristol. Keri’s current research looks at using ash layers to improve records of volcanism in the central Main Ethiopian Rift.

Keri McNamara

To read more about the Cabot Institute’s Research, you can subscribe to this blog, or subscribe to our weekly newsletter

Scaling up probabilities in space

Suppose you have some location or small area, call it location A, and you have decided for this location the 1-in-100 year event for some magnitude in that area is ‘x’. That is to say, the probability of an event with magnitude exceeding ‘x’ in the next year at location A is 1/100. For clarity, I would rather state the exact definition, rather than say ‘1-in-100 year event’.

Now suppose you have a second location, call it location B, and you are worried about an event exceeding ‘x’ in the next year at either location A or location B. For simplicity suppose that ‘x’ is the 1-in-100 year event at location B as well, and suppose also that the magnitude of events at the two locations are probabilistically independent. In this case “an event exceeding ‘x’ in the next year at either A or B” is the logical complement of “no event exceeding ‘x’ in the next year at A, AND no event exceeding ‘x’ in the next year at B”; in logic this is known as De Morgan’s Law. This gives us the result:

Pr(an event exceeding ‘x’ in the next year at either A or B) = 1 – (1 – 1/100) * (1 – 1/100).

This argument generalises to any number of locations. Suppose our locations are numbered from 1 up to n, and let ‘p_i’ be the probability that the magnitude exceeds some threshold ‘x’ in the next year at location i. I will write ‘somewhere’ for ‘somewhere in the union of the n locations’. Then, assuming probabilistic independence as before,

Pr(an event exceeding ‘x’ in the next year somewhere) = 1 – (1 – p_1) * … * (1 – p_n).

If the sum of all of the p_i’s is less than about 0.1, then there is a good approximation to this value, namely

Pr(an event exceeding ‘x’ in the next year somewhere) = p_1 + … + p_n, approximately.

But don’t use this approximation if the result is more than about 0.1, use the proper formula instead.

One thing to remember is that if ‘x’ is the 1-in-100 year event for a single location, it is NOT the 1-in-100 year event for two or more locations.  Suppose that you have ten locations, and x is the 1-in-100 year event for each location, and assume probabilistic independence as before.  Then the probability of an event exceeding ‘x’ in the next year somewhere is 1/10. In other words, ‘x’ is the 1-in-10 year event over the union of the ten locations. Conversely, if you want the 1-in-100 year event over the union of the ten locations then you need to find the 1-in-1000 year event at an individual location.

These calculations all assumed that the magnitudes were probabilistically independent across locations. This was for simplicity: the probability calculus tells us exactly how to compute the probability of an event exceeding ‘x’ in the next year somewhere, for any joint distribution of the magnitudes at the locations. This is more complicated: ask your friendly statistician (who will tell you about the awesome inclusion/exclusion formula). The basic message doesn’t change, though. The probability of exceeding ‘x’ somewhere depends on the number of locations you are considering. Or, in terms of areas, the probability of exceeding ‘x’ somewhere depends on the size of the region you are considering.

Blog post by Prof. Jonathan Rougier, Professor of Statistical Science.

First blog in series here.

Second blog in series here.

Third blog in series here.

Fourth blog in series here.

1-in-200 year events

You often read or hear references to the ‘1-in-200 year event’, or ‘200-year event’, or ‘event with a return period of 200 years’. Other popular horizons are 1-in-30 years and 1-in-10,000 years. This term applies to hazards which can occur over a range of magnitudes, like volcanic eruptions, earthquakes, tsunamis, space weather, and various hydro-meteorological hazards like floods, storms, hot or cold spells, and droughts.

‘1-in-200 years’ refers to a particular magnitude. In floods this might be represented as a contour on a map, showing an area that is inundated. If this contour is labelled as ‘1-in-200 years’ this means that the current rate of floods at least as large as this is 1/200 /yr, or 0.005 /yr. So if your house is inside the contour, there is currently a 0.005 (0.5%) chance of being flooded in the next year, and a 0.025 (2.5%) chance of being flooded in the next five years. The general definition is this:

‘1-in-200 year magnitude is x’ = ‘the current rate for events with magnitude at least x is 1/200 /yr’.

Statisticians and risk communicators strongly deprecate the use of ‘1-in-200’ and its ilk.First, it gives the impression, wrongly, that the forecast is expected to hold for the next 200 years, but it is not: 0.005 /yr is our assessment of the current rate, and this could change next year, in response to more observations or modelling, or a change in the environment.

Second, even if the rate is unchanged for several hundred years, 200 yr is the not the average waiting time until the next large-magnitude event. It is the mathematical expectation of the waiting time, which is a different thing. The average is better represented by the median, which is 30% lower, i.e. about 140 yr. This difference between the expectation and the median arises because the waiting-time distribution has a strong positive skew, so that lots of short waiting-times are balanced out a few long ones. In 25% of all outcomes, the waiting time is less than 60 yr, and in 10% of outcomes it is less than 20 yr.

So to use ‘1-in-200 year’ in public discourse is very misleading. It gives people the impression that the event will not happen even to their children’s children, but in fact it could easily happen to them. If it does happen to them, people will understandably feel that they have been very misled, and science and policy will suffer reputational loss, which degrades its future effectiveness.

So what to use instead? ‘Annual rate of 0.005 /yr’ is much less graspable than its reciprocal, ‘200 yr’. But ‘1-in-200 year’ gives people the misleading impression that they have understood something. As Mark Twain said “It ain’t what you don’t know
that gets you into trouble. It’s what you know for sure that just ain’t so.” To demystify ‘annual rate of 0.005 /yr’, it can be associated with a much larger probability, such as 0.1 (or 10%). So I suggest ‘event with a 10% chance of happening in the next 20 yr’.

Blog post by Prof. Jonathan Rougier, Professor of Statistical Science.


First blog in series here.


Third blog in series here.

Deploying and Servicing a Seismic Network in Central Italy

From a scientific point of view, the seismicity that is hitting Central Italy presents itself as an unmissable opportunity for seismologists to analyse the triggering and the evolution of an earthquake sequence. From the tens of instruments installed in the affected area, a huge amount of data is being collected. Such a well-recorded sequence will allow us to produce a comprehensive seismic catalogue of events. On this big quantity of data, new algorithms will be developed and tested for the characterisation of even the smallest earthquakes. Moreover, they will enable the validation of more accurate and testable statistical and physics-based forecast models, which is the core objective of my Ph.D. project.
Seismicity map of the Amatrice-Norcia sequence updated 5 November 2016.
The Central Apennines are one of the most seismically hazardous areas in Italy and in Europe. Many destructive earthquakes have occurred throughout this region in the past, most recently the 2009 MW = 6.4 L’Aquila event. On August 24th, just 43 km North of the 2009 epicentre, an earthquake of magnitude 6.0 occurred and devastated the villages of Amatrice and Accumuli, leading to 298 fatalities, hundreds of injured and tens of thousands people affected. The mainshock was followed, in under an hour, by a MW = 5.4 aftershock. Two months later, on October 26th, the northern sector of the affected area was struck by two earthquakes of magnitude 5.4 and 5.9, respectively, with epicentres near the village of Visso. To make things even worse, on October 30th the city of Norcia was hit by a magnitude 6.5 mainshock, which has been the biggest event of the sequence to date and the strongest earthquake in Italy in the last 36 years. Building collapses and damages were very heavy for many villages and many historical heritage buildings have reported irreparable damages, such as the 14th century St. Benedict cathedral. Luckily, the has been no further fatalities since the very first event of August 24.
St. Benedict cathedral (Norcia), erected in the late 14th century and completely destroyed after the Mw 6.5 earthquake of October 30th.
Immediately after the first big event, an emergency scientific response team was formed by the British Geological Survey (BGS) and the School of GeoSciences at the University of Edinburgh, to support the rapid deployment of high-accuracy seismometers in collaboration with the Istituto Nazionale di Geofisica e Vulcanologia (INGV). The high detection capabilities, made possible by such a dense network, will let us derive a seismic catalogue with a great regional coverage and improved magnitude sensitivity. This new, accurate, catalogue will be crucial in developing operational forecast models. The ultimate aim is to understand the potential migration of seismic activity to neighbouring faults as well as the anatomy of the seismogenic structure and to shed light into the underlying physical processes that produce the hazard.
Thanks to the quick response of the National Environmental Research Council (NERC) and SEIS-UK, 30 broadband stations have been promptly dispatched from Leicester and arrived in less than 48 hours in Rome. There, a group of 9 people composed by INGV and BGS seismologists, technicians and Ph.D. students (including myself) from University of Bristol, Dublin Institute for Advanced Study (DIAS) and University of Ulster were ready to travel across the Apennines to deploy this equipment. The first days in Rome were all about planning; the location of each station was carefully decided so as to integrate the existing Italian permanent and temporary networks in the most appropriate way. After having performed the ‘huddle test’ in the INGV, which involves parallel checking of all the field instrumentation in order to ensure its correct functioning, we packed all the equipment and headed to the village of Leonessa, a location considered safe enough to be used as our base camp (despite the village being damaged and evacuated after the 30th October event).
Preparing instrumentation for the huddle test in one of INGV’s storage rooms.
In order to optimise time and resources, and to start recording data as soon as possible, we decided to split in 3 groups so that we could finish our work between the end of August and the first week of September. Each seismic station is composed of a buried sensor, a GPS antenna, a car battery, a regulator and two solar panels. The current deployment will stay for 1 year and will be collecting data continually. Each sensor had to be carefully buried and levelled to guarantee the highest quality of recording, which was a strenuous challenge when the ground was quite rocky!
Typical setting of our deployed stations. On the left, the buried sensor. Its cables, buried as well, connect it to the instrumentation inside the black box (a car battery, and a regulator). On the right, the solar panel (a second one was added in October service) and the white GPS antenna.
Aside from the scientific value of the expedition, the deployment week was a great opportunity to get to know each other, share opinions, ideas and, of course, get some training in seismology! At the end, we managed to install 24 stations around an area of approximately 2700 km2.
As this type of seismic station didn’t have telemetry, each needed to be revisited to retrieve data. For this purpose, from October 17th, David Hawthorn (BGS) and I flew to Italy again and stayed there for the following ten days to service the seismometers and to do the first data dump. Our goals were also  to check the quality of the first month of recordings, to add a second solar panel where needed, and to prepare the stations for the forthcoming winter. To do that, a lot of hammering and woodworking was needed. We serviced all the sites, raising the solar panels and GPS antennas on posts, which were securely anchored to the ground, to prevent snow from covering them. The stations were all in good conditions, with just minor damages due to some very snoopy cows.
David Hawthorn (BGS) servicing the stations – A second solar panel was added. Panels and GPS antennas were raised on posts anchored to the ground through timbers.
Dumping data from the stations using a netbook and specific hard drive.
On October 26, just the night before leaving for Rome, we experienced first-hand the frightening feeling of a mainshock just below our feet. Both the quakes of that evening surprised us while we were inside a building; the rumble just few seconds before the quake was shocking and the shaking was very strong. Fortunately, there were no severe damages in Leonessa but many people in the village refused to spend the night in their own houses. Also, it was impressive to see the local emergency services response: only a few minutes after the first quake, policemen were already out to patrol the inner village checking for any people experiencing difficulties.
The small village of Pescara del Tronto suffered many collapses and severe damages after the 24 August earthquakes. View from the motorway above.
Throughout our car transfers from one site to another we frequently found roads interrupted by a building collapse or by a landslide, but we could also admire the mountains with a mantle of beautiful autumnal colours and the spectacular landscapes offered by the Apennines, like the Monte Vettore, the Gran Sasso (the highest peak in the Apennines) and the breath-taking Castelluccio plain near Norcia.
View of the Norcia plain, near to the 24th August magnitude 5.4 and the 30th October magnitude 6.5 epicentres.
View of the Castelluccio plain. This picture was taken from the village of Castelluccio, just 5 days before it was totally destroyed by the magnitude 6.5 mainshock.
From my point of view, I learned a lot and really enjoyed this experience. I feel privileged to have started my Ph.D. in leading institutions like the University of Bristol and the BGS and, at the same time, to be able to spend time in my home country (yes, I am Italian…) with such interesting scientific questions. What I know for sure is that we will be back there again.

Blog written by Simone Mancini, 1st year Ph.D. student, University of Bristol and British Geological Survey.

The Bristol Volcanology Group: Managing Britain’s volcanic crises

When Professor Steve Sparks moved to Bristol from Cambridge in 1989 to take up the Chair of Geology in the School of Earth Sciences little did he know what was in store for him. His time at Bristol would see him advise the government and become one of the most cited scientists of all time.

Sparks’s extraordinary journey as head of the volcanology group has lead it to study volcanism on every continent and has allowed it to grow from one man to a thriving collective of staff, researchers and students. The world-class science produced by the group has resulted in it receiving the Queen’s Anniversary Prize; the highest accolade in higher education.

 
Professor Kathy Cashman accepting the Queen’s Anniversary Prize for Higher Education

Naturally, this evolution has been heavily influenced by volcanoes.  Unlike many sciences, the progress of volcanology can be episodic- driven by key eruptions and crises. For the Bristol group, two events have defined their work which has, in turn, altered the course of the science:

The eruption on the Island of Montserrat lasted from 1995 to 1997, killed 23 people and displaced several thousand.  As Montserrat is a British dependant territory, the British government was closely engaged in managing the crisis and wasted little time roping in Bristol’s volcanic expertise as Sparks explains: “Bristol was a key partner in establishing the Volcano Observatory on the island and several Bristol staff and PhD students were involved in the monitoring effort in the first few years.” This partnership has continued for the past two decades with Professors Sparks and Aspinall acting as directors of the observatory and heading up the advisory committee ever since. In addition, the research resulting from the eruption has contributed invaluable information to the science of volcanology including causes of volcanic cyclicity and eruptions.

More recently in 2010, the Eyjafjallajokull ash crisis cost the European economy $5 billion through the closure of airspace. In the midst of the decision-making surrounding this closure was a SAGE (Scientific Advisory Group for Emergencies) meeting attended by six volcanologists, of which three were from Bristol. Bristol’s Professor Willy Aspinall, was one of the three called to advise, alongside Dr Matt Watson and Professor Sparks. He described the meeting as a ‘spectrum of people working in many areas from civil aviation to defence’.

 
Eruption column above Eyjafjallajokull

The role Bristol played was pivotal in the national response and was a turning point for the group as a whole as Watson explains ‘Eyja changed how we operated. Volcanology had previously comprised mostly of research produced for other researchers, but this was the first time we could use it practically in a crisis’.

Indeed, not only did it highlight the need for more applied approach to volcanology, it also prompted whole new field of research on volcanic ash involving analysis of ash deposits and advances in remote sensing techniques.  Such challenges were met head on by the group that has a huge breadth of research capabilities, from geophysics to geochemistry to petrology.

Looking to the future, the group’s challenge is to be prepared for new eruptions, wherever they may be.  The researchers are working in regions all over the world including countries such as Guatemala and Ethiopia. Bristol volcanologists hope to expand this aspect of their research through opportunities such as the Global Challenges Research Fund which will draw together expertise from all corners of the group to address volcanic challenges in less developed nations.

 
Keri McNamara looking at a volcanic air fall deposit in Ethiopia, alongside some of the locals 

In recent years, Sparks has stepped down as the head of the group allowing for the appointment of Professor Kathy Cashman as AXA professor of volcanology and the group’s new lead.  Now, 27 years after it began, the group is not showing any signs of slowing down. The question is, when will next episode in the group’s history erupt?


This blog is written by Cabot Institute member Keri McNamara, a PhD student in the School of Earth Sciences at the University of Bristol.


Thank you to Alison Rust, Kathy Cashman, Matt Watson, Willy Aspinall and Steve Sparks for providing information for this blog. 

Measuring greenhouse gases during India’s monsoon

NERC’s BAe-146 research aircraft at the Facility for Airborne Atmospheric Measurements (FAAM). Image credit: FAAM
This summer, researchers across the UK and India are teaming up to study the Indian monsoon as part of a £8 million observational campaign using the NERC research aircraftBAe-146

India receives 80% of its annual rainfall in three months – between June and September. There are large year-to-year differences in the strength of the monsoon, which is heavily impacted by drivers such as aerosols and large-scale weather patterns, and this has significant impact on the livelihoods of over a billion people. For example, due to the strong El Nino last year, the 2015 monsoon experienced a 14% lower precipitation than average with some regions of India facing up to 50% shortfall.  Forecasting the timing and strength of the monsoon is critical for the region and particularly for India’s farmers, who must manage water resources to avoid failing crops.


Roadside mural of the BAe-146 in Bangalore, India. Original artist unknown.  Image credit: Guy Gratton

The observational campaign, which is part of NERC’s Drivers of Variability in the South Asian Monsoon programme, is led jointly by UK researchers: Professor Hugh Coe (University of Manchester), Dr Andy Turner (University of Reading) and Dr Adrian Matthews (University of East Anglia) and Indian scientists from the Indian Space Research Organization and Indian Institute of Science.

Bristol PhD student Dan Say installing sample containers on the BAe- 146. Image credit: Angelina Wenger

To complement this project to study physical and chemical drivers of the monsoon, I am measuring greenhouse gas from the aircraft with PhD student Dan Say (School of Chemistry, University of Bristol). Dan is gaining valuable field experience by operating several instruments aboard the BAe-146 through the intense heat and rain of the Indian monsoon.

Two of the greenhouse gases that we are studying, methane and nitrous oxide, are primarily produced during the monsoon season from India’s intensive agriculture. Methane is emitted from rice paddies, in which flooded soils create prime conditions for “anaerobic” methane production. Nitrous oxide is also emitted from these flooded soils due the large quantity of fertilizers that are applied, again through anaerobic pathways. 


Rice fields near Bangalore, India. Image credit: Guy Gratton.

Our previous understanding of the large-scale emissions of these greenhouse gases from India’s agricultural soils has been limited and we aim to further our knowledge of what controls their production. In addition to the methane concentrations measured on the aircraft, with collaborators at the Royal Holloway, University of London’s isotope facility, we are also measuring the main isotope of methane (the 13-carbon isotope), which will provide us with a valuable tool for differentiating between agricultural and other sources of methane in the region. By combining this information with other measurements from the aircraft (for example, of moisture and of other atmospheric pollutants), we aim to gain new insights on how we may reduce these emissions in the future.

In addition, many synthetic “man-made” greenhouse gases are being measured for the first time in South Asia, giving us the first look at emissions from this region of some of the most potent warming agents. These include the suite of halocarbons such as hydrofluorocarbons (HFCs) and their predecessors the hydrochlorofluorocarbons (HCFCs) and chlorofluorocarbons (CFCs). These gases will be measured on the University of Bristol School of Chemistry’s ‘Medusa’ gaschromatography-mass spectrometer (GC-MS) facility run by Professor Simon O’Doherty.


Sample canisters for collecting air that will be measured on the School of Chemistry’s ‘Medusa’ GC-MS facility. Image credit: Angelina Wenger

————————————-

This blog is written by University of Bristol Cabot Institute member Dr Anita Ganesan, a NERC Research Fellow, School of Geographical Sciences, who looks at greenhouse gas emissions estimation.
Anita Ganesan