 |
| J.G Ballard’s The Drowned World taken from fantasticalandrewfox.com |
Over the next 18 months, in collaboration with Bristol Green Capital 2015 artists, civic leaders and innovative thinkers, the Cabot Institute will be participating in a series of activities in which we examine how human actions are making our planet a much more uncertain place to live.
Fifty years ago, between 1962 and 1966, J. G. Ballard wrote a trio of seminal environmental disaster novels: The Drowned World, The Burning World and The Crystal World. These novels remain signposts to our future, the challenges we might face and the way people respond to rapid and unexpected change to their environment. In that spirit and coinciding with the Bristol Green Capital 2015, we introduce The Uncertain World, a world in which profound uncertainty becomes as much of a challenge to society as warming and rising sea levels.
For the past twenty years, the University of Bristol has been exploring how to better understand, mitigate and live with environmental uncertainty, with the Cabot Institute serving as the focus for that effort since its founding in 2010. Uncertainty is the oft-forgotten but arguably most challenging aspect of mankind’s centuries-long impact on the environment. We live our lives informed by the power of experience: our own as well as the collective experience of our families, communities and wider society. When my father started dairy farming he sought advice from my mother’s grandfather, our neighbours, and the grizzled veterans at the Middlefield auction house. Experience helps us make intelligent decisions, plan strategically and anticipate challenges.
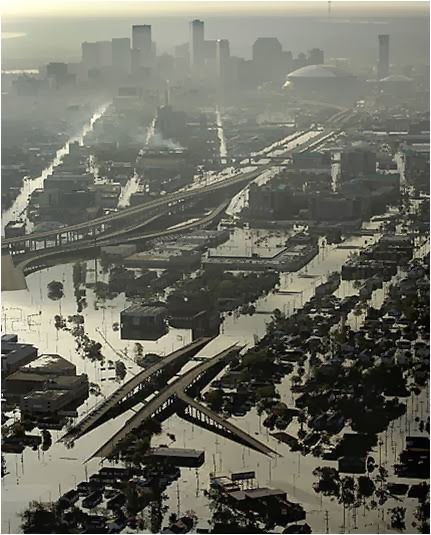 Similarly, our weather projections, water management and hazard planning are also based on experience: tens to hundreds of years of observation inform our predictions of future floods, drought, hurricanes and heat waves. These records – this experience – can help us make sensible decisions about where to live, build and farm.
Now, however, we are changing our environment and our climate, such that the lessons of the past have less relevance to the planning of our future. In fact, many aspects of environmental change are unprecedented not only in human experience but in Earth history. As we change our climate, the great wealth of knowledge generated from human experience is losing capital every day.
The Uncertain World is not one of which we have no knowledge – we have high confidence that temperatures and sea level will rise, although there is uncertainty in the magnitude and speed of change. Nor should we view The Uncertain World with existential fear – we know that warm worlds have existed in the past. These were not inhospitable and most evidence from the past suggests that a climate ‘apocalypse’ resulting in an uninhabitable planet is unlikely.
Nonetheless, increasing uncertainty arising from human-induced changes to our global environment should cause deep concern. Crucial details of our climate remain difficult to predict, and it undermines our ability to plan for our future. We do not know whether many regions of the world will become wetter or dryer. This uncertainty propagates and multiplies through complex systems: how do we make sensible predictions of coastal flood risk when there is uncertainty in sea level rise estimates, rainfall patterns and the global warming that will impact both? We can make predictions even in such complex systems, but the predictions will inevitably come with a degree of uncertainty, a probabilistic prediction. How do we apply such predictions to decision making? Where can we build new homes, where do we build flood defences to protect existing ones, and where do we abandon land to the sea?
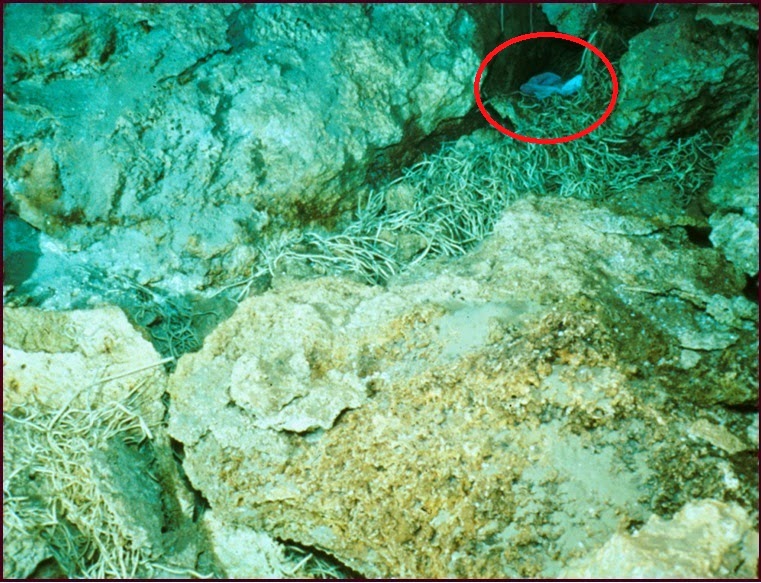
Perhaps most worrying, the consequences of these rapid changes on biological and chemical systems, and the people dependent upon them, are very poorly understood. For example, the synergistic impact of warmer temperatures, more acidic waters, and more silt-choked coastal waters on coral reefs and other marine ecosystems is very difficult to predict. This is particularly concerning given that more than 2.6 billion people depend on the oceans as their primary source of protein. Similarly, warming of Arctic permafrost could promote the growth of CO2-sequestering plants or the release of warming-accelerating methane – or both. Warm worlds with very high levels of carbon dioxide did exist in the past and these do provide some insight into the response of the Earth system, but we are accelerating into this new world at a rate that is unprecedented in Earth history, creating additional layers of uncertainty.
During late 2014 and 2015, the Cabot Institute will host a variety of events and collaborate with a variety of partners across Bristol and beyond to explore this Uncertain World and how we can live in it. How do we better explain uncertainty and what are the ‘logical’ decisions to make when faced with uncertainty? One of our first events will explore how uncertainty in climate change predictions should motivate us to action: the more uncertain our predictions the more we should employ mitigation rather than adaptation strategies. Future events will explore how past lessons from Earth history help us better understand potential future scenarios; how future scenario planning can inform the decisions we make today; and most importantly, how we build the necessary flexibility into social structures to thrive in this Uncertain World.
This blog is by Prof Rich Pancost, Director of the Cabot Institute at the University of Bristol.
 |
| Prof Rich Pancost |
.jpg)


.jpg/800px-Ice_Core_Vitals_(5433412179).jpg)


