We built an AI model that analysed millions of images of retreating glaciers – what it found is alarming

BEST-BACKGROUNDS / shutterstock / NASA

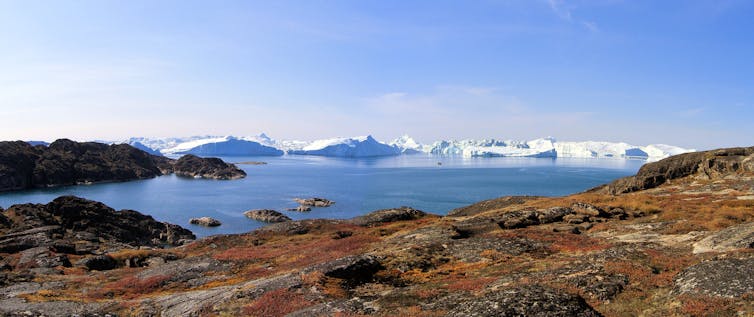
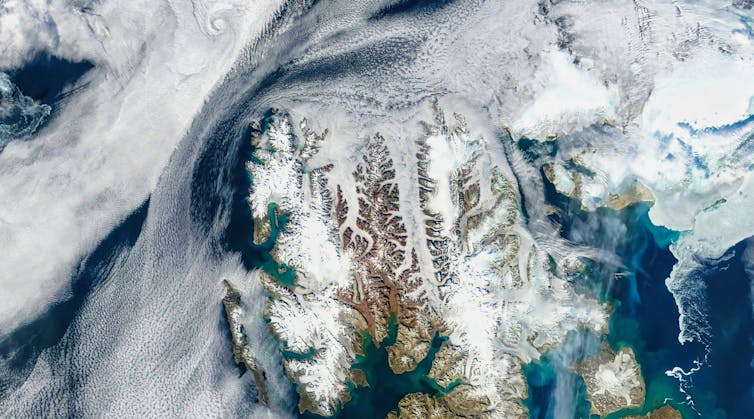
The Arctic has warmed nearly four times faster than the global average since 1979. Svalbard, an archipelago near the northeast coast of Greenland, is at the frontline of this climate change, warming up to seven times faster than the rest of the world.

More than half of Svalbard is covered by glaciers. If they were to completely melt tomorrow, the global sea level would rise by 1.7cm. Although this won’t happen overnight, glaciers in the Arctic are highly sensitive to even slight temperature increases.

To better understand glaciers in Svalbard and beyond, we used an AI model to analyse millions of satellite images from Svalbard over the past four decades. Our research is now published in Nature Communications, and shows these glaciers are shrinking faster than ever, in line with global warming.

Specifically, we looked at glaciers that drain directly into the ocean, what are known as “marine-terminating glaciers”. Most of Svalbard’s glaciers fit this category. They act as an ecological pump in the fjords they flow into by transferring nutrient-rich seawater to the ocean surface and can even change patterns of ocean circulation.

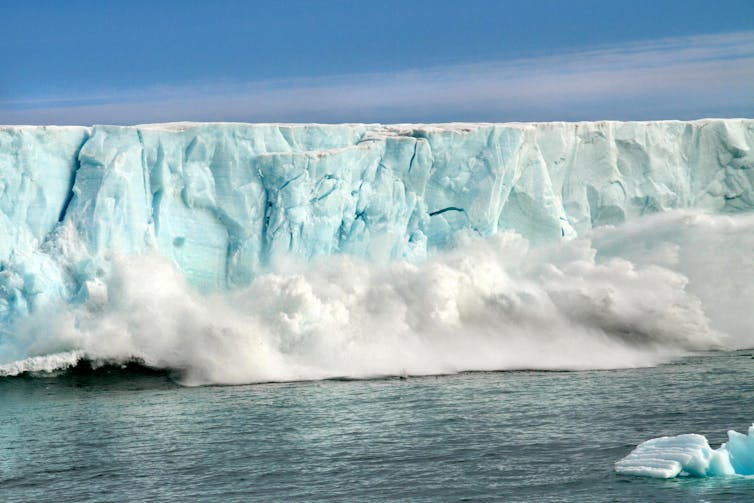
Where these glaciers meet the sea, they mainly lose mass through iceberg calving, a process in which large chunks of ice detach from the glacier and fall into the ocean. Understanding this process is key to accurately predicting future glacier mass loss, because calving can result in faster ice flow within the glacier and ultimately into the sea.
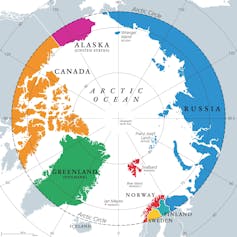
Map of Arctic
Svalbard (in red) belongs to Norway and is one of the northernmost places int he world.
Peter Hermes Furian / shutterstock

Despite its importance, understanding the glacier calving process has been a longstanding challenge in glaciology, as this process is difficult to observe, let alone accurately model. However, we can use the past to help us understand the future.

AI replaces painstaking human labour

When mapping the glacier calving front – the boundary between ice and ocean – traditionally human researchers painstakingly look through satellite imagery and make digital records. This process is highly labour-intensive, inefficient and particularly unreproducible as different people can spot different things even in the same satellite image. Given the number of satellite images available nowadays, we may not have the human resources to map every region for every year.

A novel way to tackle this problem is by using automated methods like artificial intelligence (AI), which can quickly identify glacier patterns across large areas. This is what we did in our new study, using AI to analyse millions of satellite images of 149 marine-terminating glaciers taken between 1985 and 2023. This meant we could examine the glacier retreats at unprecedented scale and scope.
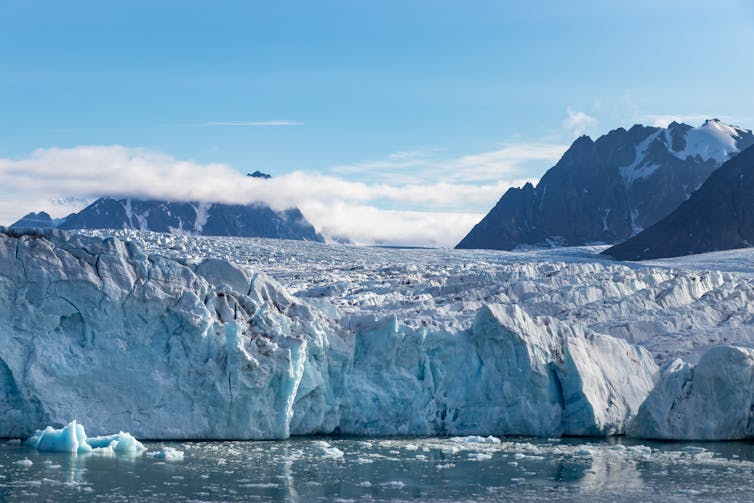
Glacier flows into sea
Svalbard is slightly smaller than Scotland yet has more than 2,000 glaciers.
RUBEN M RAMOS / shutterstock

Insights from 1985 to today

We found that the vast majority (91%) of marine-terminating glaciers across Svalbard have been shrinking significantly. We discovered a loss of more than 800km² of glacier since 1985, larger than the area of New York City, and equivalent to an annual loss of 24km² a year, almost twice the size of Heathrow airport in London.

The biggest spike was detected in 2016, when the calving rates doubled in response to periods of extreme warming. That year, Svalbard also had its wettest summer and autumn since 1955, including a record 42mm of rain in a single day in October. This was accompanied by unusually warm and ice-free seas.

How ocean warming triggers glacier calving

In addition to the long-term retreat, these glaciers also retreat in the summer and advance again in winter, often by several hundred metres. This can be greater than the changes from year to year.

We found that 62% of the glaciers in Svalbard experience these seasonal cycles. While this phenomenon is well documented across Greenland, it had previously only been observed for a handful of glaciers in Svalbard, primarily through manual digitisation.
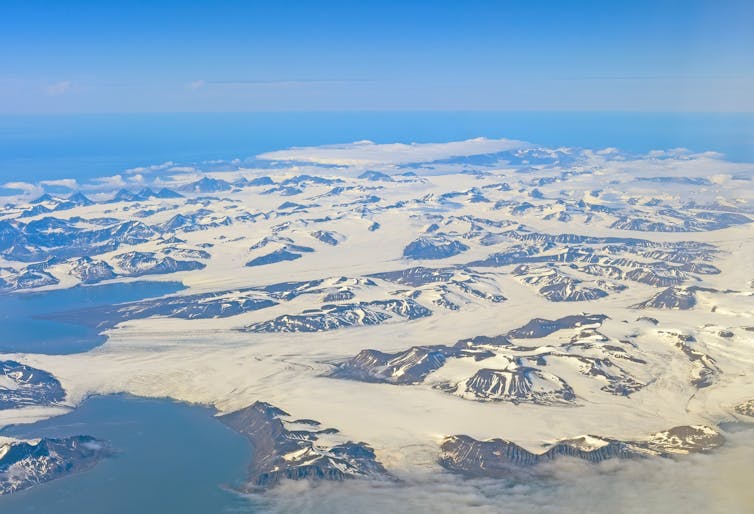
Aerial view of island of mountains and glaciers
Svalbard’s many glaciers grow and shrink with the seasons.
Wildnerdpix / shutterstock

We then compared these seasonal changes with seasonal variations in air and ocean temperature. We found that as the ocean warmed up in spring, the glacier retreated almost immediately. This was a nice demonstration of something scientists had long suspected: the seasonal ebbs and flows of these glaciers are caused by changes in ocean temperatures.

A global threat

Svalbard experiences frequent climate extremes due to its unique location in the Arctic yet close to the warm Atlantic water. Our findings indicate that marine-terminating glaciers are highly sensitive to climate extremes and the biggest retreat rates have occurred in recent years.

This same type of glaciers can be found across the Arctic and, in particular, around Greenland, the largest ice mass in the northern hemisphere. What happens to glaciers in Svalbard is likely to be repeated elsewhere.

If the current climate warming trend continues, these glaciers will retreat more rapidly, the sea level will rise, and millions of people in coastal areas worldwide will be endangered.

———————


This blog is written by Tian Li, Senior Research Associate, Bristol Glaciology Centre, University of Bristol; Jonathan Bamber, Professor of Glaciology and Earth Observation, University of Bristol, and Konrad Heidler, Chair of Data Science in Earth Observation, Technical University of MunichThis article is republished from The Conversation under a Creative Commons license. Read the original article.

Tian Li
Jonathan Bamber
Konrad Heidler

Arctic is warming nearly four times faster than the rest of the world – new research

New research estimates that the Arctic may be warming four times faster than the rest of the world.
Netta Arobas/Shutterstock

The Earth is approximately 1.1℃ warmer than it was at the start of the industrial revolution. That warming has not been uniform, with some regions warming at a far greater pace. One such region is the Arctic.

A new study shows that the Arctic has warmed nearly four times faster than the rest of the world over the past 43 years. This means the Arctic is on average around 3℃ warmer than it was in 1980.

This is alarming, because the Arctic contains sensitive and delicately balanced climate components that, if pushed too hard, will respond with global consequences.

Why is the Arctic warming so much faster?

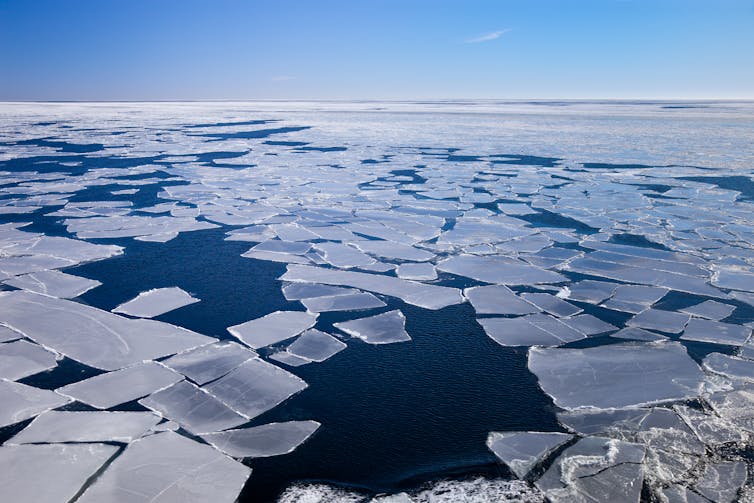
A large part of the explanation relates to sea ice. This is a thin layer (typically one metre to five metres thick) of sea water that freezes in winter and partially melts in the summer.

The sea ice is covered in a bright layer of snow which reflects around 85% of incoming solar radiation back out to space. The opposite occurs in the open ocean. As the darkest natural surface on the planet, the ocean absorbs 90% of solar radiation.

When covered with sea ice, the Arctic Ocean acts like a large reflective blanket, reducing the absorption of solar radiation. As the sea ice melts, absorption rates increase, resulting in a positive feedback loop where the rapid pace of ocean warming further amplifies sea ice melt, contributing to even faster ocean warming.

This feedback loop is largely responsible for what is known as Arctic amplification, and is the explanation for why the Arctic is warming so much more than the rest of the planet.

Blocks of melting sea ice revealing a deep blue sea.
Melting sea ice in the Arctic Ocean.
Nightman1965/Shutterstock

Is Arctic amplification underestimated?

Numerical climate models have been used to quantify the magnitude of Arctic amplification. They typically estimate the amplification ratio to be about 2.5, meaning the Arctic is warming 2.5 times faster than the global average. Based on the observational record of surface temperatures over the last 43 years, the new study estimates the Arctic amplification rate to be about four.

Rarely do the climate models obtain values as high that. This suggests the models may not fully capture the complete feedback loops responsible for Arctic amplification and may, as a consequence, underestimate future Arctic warming and the potential consequences that accompany that.

How concerned should we be?

Besides sea ice, the Arctic contains other climate components that are extremely sensitive to warming. If pushed too hard, they will also have global consequences.

One of those elements is permafrost, a (now not so) permanently frozen layer of the Earth’s surface. As temperatures rise across the Arctic, the active layer, the topmost layer of soil that thaws each summer, deepens. This, in turn, increases biological activity in the active layer resulting in the release of carbon into the atmosphere.

Arctic permafrost contains enough carbon to raise global mean temperatures by more than 3℃. Should permafrost thawing accelerate, there is the potential for a runaway positive feedback process, often referred to as the permafrost carbon time bomb. The release of previously stored carbon dioxide and methane will contribute to further Arctic warming, subsequently accelerating future permafrost thaw.

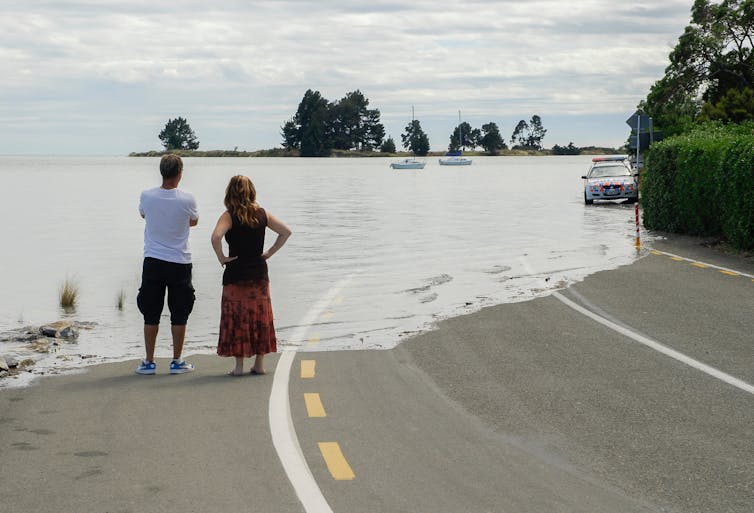
A second Arctic component vulnerable to temperature rise is the Greenland ice sheet. As the largest ice mass in the northern hemisphere, it contains enough frozen ice to raise global sea levels by 7.4 metres if melted completely.

A man and woman standing on the edge of a flooded coastal road.
The Greenland ice sheet contains enough frozen ice to raise global sea levels by 7.4 metres if completely melted.
MainlanderNZ/Shutterstock

When the amount of melting at the surface of an ice cap exceeds the rate of winter snow accumulation, it will lose mass faster than it gains any. When this threshold is exceeded, its surface lowers. This will quicken the pace of melting, because temperatures are higher at lower elevations.

This feedback loop is often called the small ice cap instability. Prior research puts the required temperature rise around Greenland for this threshold to be be passed at around 4.5℃ above pre-industrial levels. Given the exceptional pace of Arctic warming, passing this critical threshold is rapidly becoming likely.

Although there are some regional differences in the magnitude of Arctic amplification, the observed pace of Arctic warming is far higher than the models implied. This brings us perilously close to key climate thresholds that if passed will have global consequences. As anyone who works on these problems knows, what happens in the Arctic doesn’t stay in the Arctic.The Conversation

——————————

This blog is written by Cabot Institute for the Environment member, Jonathan Bamber, Professor of Physical Geography, University of Bristol.

This article is republished from The Conversation under a Creative Commons license. Read the original article.

Siberia heatwave: why the Arctic is warming so much faster than the rest of the world

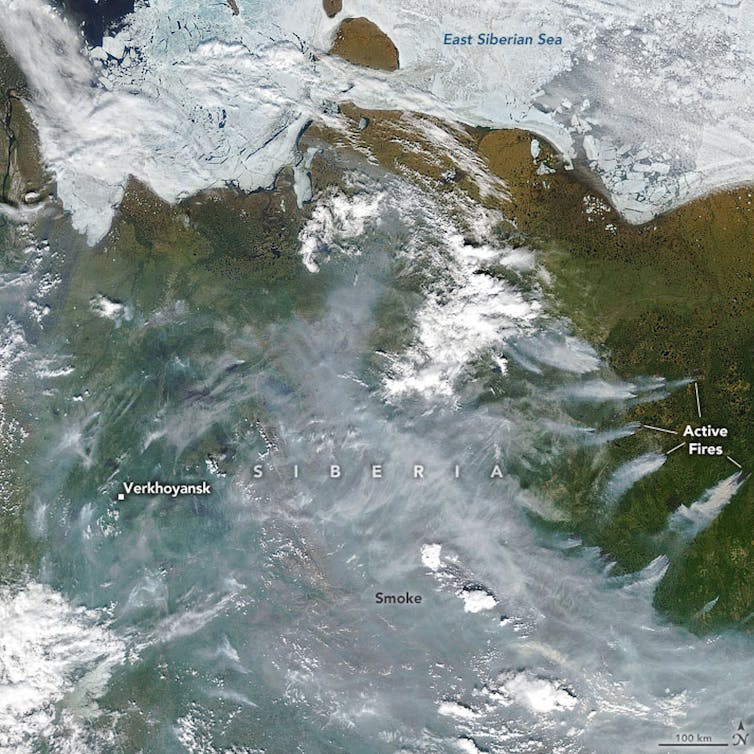
Smoke from wildfires cloaks the skies over Siberia, June 23 2020.
EPA-EFE/NASA

On the eve of the summer solstice, something very worrying happened in the Arctic Circle. For the first time in recorded history, temperatures reached 38°C (101°F) in a remote Siberian town – 18°C warmer than the maximum daily average for June in this part of the world, and the all-time temperature record for the region.

New records are being set every year, and not just for maximum temperatures, but for melting ice and wildfires too. That’s because air temperatures across the Arctic have been increasing at a rate that is about twice the global average.

All that heat has consequences. Siberia’s recent heatwave, and high summer temperatures in previous years, have been accelerating the melting of Arctic permafrost. This is the permanently frozen ground which has a thin surface layer that melts and refreezes each year. As temperatures rise, the surface layer gets deeper and structures embedded in it start to fail as the ground beneath them expands and contracts. This is what is partly to blame for the catastrophic oil spill that occurred in Siberia in June 2020, when a fuel reservoir collapsed and released more than 21,000 tonnes of fuel – the largest ever spill in the Arctic.

So what is wrong with the Arctic, and why does climate change here seem so much more severe compared to the rest of the world?

The warming models predicted

Scientists have developed models of the global climate system, called general circulation models, or GCMs for short, that reproduce the major patterns seen in weather observations. This helps us track and predict the behaviour of climate phenomena such as the Indian monsoon, El Niño, Southern Oscillations and ocean circulation such as the gulf stream.

GCMs have been used to project changes to the climate in a world with more atmospheric CO₂ since the 1990s. A common feature of these models is an effect called polar amplification. This is where warming is intensified in the polar regions and especially in the Arctic. The amplification can be between two and two and a half, meaning that for every degree of global warming, the Arctic will see double or more. This is a robust feature of our climate models, but why does it happen?

Fresh snow is the brightest natural surface on the planet. It has an albedo of about 0.85, which means that 85% of solar radiation falling on it is reflected back out to space. The ocean is the opposite – it’s the darkest natural surface on the planet and reflects just 10% of radiation (it has an albedo of 0.1). In winter, the Arctic Ocean, which covers the North Pole, is covered in sea ice and that sea ice has an insulating layer of snow on it. It’s like a huge, bright thermal blanket protecting the dark ocean underneath. As temperatures rise in spring, sea ice melts, exposing the dark ocean underneath, which absorbs even more solar radiation, increasing warming of the region, which melts even more ice. This is a positive feedback loop which is often referred to as the ice-albedo feedback mechanism.

Melting Arctic sea ice is increasing warming in the region.
Jonathan Bamber, Author provided

This ice-albedo (really snow-albedo) feedback is particular potent in the Arctic because the Arctic Ocean is almost landlocked by Eurasia and North America, and it’s less easy (compared to the Antarctic) for ocean currents to move the sea ice around and out of the region. As a result, sea ice that stays in the Arctic for longer than a year has been declining at a rate of about 13% per decade since satellite records began in the late 1970s.

In fact, there is evidence to indicate that sea ice extent has not been this low for at least the last 1,500 years. Extreme melt events over the Greenland Ice Sheet, that used to occur once in every 150 years, have been seen in 2012 and now 2019. Ice core data shows that the enhanced surface melting on the ice sheet over the past decade is unprecedented over the past three and a half centuries and potentially over the past 7,000 years.

In other words, the record-breaking temperatures seen this summer in the Arctic are not a “one-off”. They are part of a long-term trend that was predicted by climate models decades ago. Today, we’re seeing the results, with permafrost thaw and sea ice and ice sheet melting. The Arctic has sometimes been described as the canary in the coal mine for climate breakdown. Well it’s singing pretty loudly right now and it will get louder and louder in years to come.The Conversation

——————————-
This blog is written by Cabot Institute member Jonathan Bamber, Professor of Physical Geography, University of BristolThis article is republished from The Conversation under a Creative Commons license. Read the original article.

Professor Jonathan Bamber