Are you a journalist looking for climate experts for COP28? We’ve got you covered

COP28 logo

We’ve got lots of media trained climate change experts. If you need an expert for an interview, here is a list of our experts you can approach. All media enquiries should be made via Victoria Tagg, our dedicated Media and PR Manager at the University of Bristol. 

Email victoria.tagg@bristol.ac.uk or call +44 (0)117 428 2489.

Climate change / climate emergency / climate science / climate-induced disasters

Dr Eunice Lo – expert in changes in extreme weather events such as heatwaves and cold spells, and how these changes translate to negative health outcomes including illnesses and deaths. Follow on Twitter/X @EuniceLoClimate.

Professor Daniela Schmidt – expert in the causes and effects of climate change on marine systems. Dani is also a Lead Author on the IPCC reports.

Dr Katerina Michalides – expert in drylands, drought and desertification and helping East African rural communities to adapt to droughts and future climate change. Follow on Twitter/X @_kmichaelides.

Professor Dann Mitchell – expert in how climate change alters the atmospheric circulation, extreme events, and impacts on human health. Dann is also a Met Office Chair. Follow on Twitter/X @ClimateDann.

Professor Dan Lunt – expert on past climate change, with a focus on understanding how and why climate has changed in the past and what we can learn about the future from the past. Dan is also a Lead Author on IPCC AR6. Follow on Twitter/X @ClimateSamwell.

Professor Jonathan Bamber – expert on the impact of melting land ice on sea level rise (SLR) and the response of the ocean to changes in freshwater forcing. Follow on Twitter/X @jlbamber

Professor Paul Bates CBE – expert in the science of flooding, risk and reducing threats to life and economic losses worldwide. Follow on Twitter/X @paul_d_bates

Dr Matt Palmer – expert in sea level and ocean heat content at the Met Office Hadley Centre and University of Bristol. Follow on Twitter/X @mpclimate.

Professor Guy Howard – expertise in building resilience and supporting adaptation in water systems, sanitation, health care facilities, and housing. Expert in wider infrastructure resilience assessment.

Net Zero / Energy / Renewables

Dr Caitlin Robinson – expert on energy poverty and energy justice and also in mapping ambient vulnerabilities in UK cities. Caitlin will be virtually attending COP28. Follow on Twitter/X @CaitHRobin.

Professor Philip Taylor – Expert in net zero, energy systems, energy storage, utilities, electric power distribution. Also Pro-Vice Chancellor at the University of Bristol. Follow on Twitter/X @rolyatlihp.

Dr Colin Nolden – expert in sustainable energy policyregulation and business models and interactions with secondary markets such as carbon markets and other sectors such as mobility. Colin will be in attendance in the Blue Zone at COP28 during week 2.

Professor Charl Faul – expert in novel functional materials for sustainable energy applications e.g. in CO2 capture and conversion and energy storage devices.  Follow on Twitter/X @Charl_FJ_Faul.

Climate finance / Loss and damage

Dr Rachel James – Expert in climate finance, damage, loss and decision making. Also has expertise in African climate systems and contemporary and future climate change. Follow on Twitter/X @_RachelJames.

Dr Katharina Richter – expert in decolonial environmental politics and equitable development in times of climate crises. Also an expert on degrowth and Buen Vivir, two alternatives to growth-based development from the Global North and South. Katarina will be virtually attending COP28. @DrKatRichter.

Climate justice

Dr Alix Dietzel – climate justice and climate policy expert. Focusing on the global and local scale and interested in how just the response to climate change is and how we can ensure a just transition. Alix will be in attendance in the Blue Zone at COP28 during week 1. Follow on Twitter/X @alixdietzel.

Dr Ed Atkins – expert on environmental and energy policy, politics and governance and how they must be equitable and inclusive. Also interested in local politics of climate change policies and energy generation and consumption. Follow on Twitter/X @edatkins_.

Dr Karen Tucker – expert on colonial politics of knowledge that shape encounters with indigenous knowledges, bodies and natures, and the decolonial practices that can reveal and remake them. Karen will be in attending the Blue Zone of COP28 in week 2.

Climate change and health

Dr Dan O’Hare – expert in climate anxiety and educational psychologist. Follow on Twitter/X @edpsydan.

Professor Dann Mitchell – expert in how climate change alters the atmospheric circulation, extreme events, and impacts on human health. Dann is also a Met Office Chair. Follow on Twitter/X @ClimateDann.

Dr Eunice Lo – expert in changes in extreme weather events such as heatwaves and cold spells, and how these changes translate to negative health outcomes including illnesses and deaths. Follow on Twitter/X @EuniceLoClimate.

Professor Guy Howard – expert in influence of climate change on infectious water-related disease, including waterborne disease and vector-borne disease.

Professor Rachael Gooberman-Hill – expert in health research, including long-term health conditions and design of ways to support and improve health. @EBIBristol (this account is only monitored in office hours).

Youth, children, education and skills

Dr Dan O’Hare – expert in climate anxiety in children and educational psychologist. Follow on Twitter/X @edpsydan.

Dr Camilla Morelli – expert in how children and young people imagine the future, asking what are the key challenges they face towards the adulthoods they desire and implementing impact strategies to make these desires attainable. Follow on Twitter/X @DrCamiMorelli.

Dr Helen Thomas-Hughes – expert in engaging, empowering, and inspiring diverse student bodies as collaborative environmental change makers. Also Lead of the Cabot Institute’s MScR in Global Environmental Challenges. Follow on Twitter/X @Researchhelen.

Professor Daniela Schmidt – expert in the causes and effects of climate change on marine systems. Dani is also a Lead Author on the IPCC reports. Also part of the Waves of Change project with Dr Camilla Morelli, looking at the intersection of social, economic and climatic impacts on young people’s lives and futures around the world.

Climate activism / Extinction Rebellion

Dr Oscar Berglund – expert on climate change activism and particularly Extinction Rebellion (XR) and the use of civil disobedience. Follow on Twitter @berglund_oscar.

Land / Nature / Food

Dr Jo House – expert on land and climate interactions, including emissions of carbon dioxide from land use change (e.g. deforestation), climate mitigation potential from the land (e.g. afforestationbioenergy), and implications of science for policy. Previously Government Office for Science’s Head of Climate Advice. Follow on Twitter @Drjohouse.

Professor Steve Simpson – expert marine biology and fish ecology, with particular interests in the behaviour of coral reef fishes, bioacoustics, effects of climate change on marine ecosystems, conservation and management. Follow on Twitter/X @DrSteveSimpson.

Dr Taro Takahashi – expert on farminglivestock production systems as well as programme evaluation and general equilibrium modelling of pasture and livestock-based economies.

Dr Maria Paula Escobar-Tello – expert on tensions and intersections between livestock farming and the environment.

Air pollution / Greenhouse gases

Dr Aoife Grant – expert in greenhouse gases and methane. Set up a monitoring station at Glasgow for COP26 to record emissions.

Professor Matt Rigby – expert on sources and sinks of greenhouse gases and ozone depleting substances. Follow on Twitter @TheOtherMRigby.

Professor Guy Howard – expert in contribution of waste and wastewater systems to methane emissions in low- and middle-income countries

Plastic and the environment

Dr Charlotte Lloyd – expert on the fate of chemicals in the terrestrial environment, including plasticsbioplastics and agricultural wastes. Follow on Twitter @DrCharlLloyd.

Cabot Institute for the Environment at COP28

We will have three media trained academics in attendance at the Blue Zone at COP28. These are: Dr Alix Dietzel (week 1), Dr Colin Nolden (week 2) and Dr Karen Tucker (week 2). We will also have two academics attending virtually: Dr Caitlin Robinson and Dr Katharina Richter.

Read more about COP on our website at https://bristol.ac.uk/cabot/what-we-do/projects/cop/
——————————
This blog was written by Amanda Woodman-Hardy, Communications and Engagement Officer at the Cabot Institute for the Environment. Follow on Twitter @Enviro_Mand and @cabotinstitute.

Watch our Cabot Conversations – 10 conversations between 2 experts on a climate change issue, all whilst an artist listens in the background and interprets the conversation into a beautiful piece of art in real time. Find out more at bristol.ac.uk/cabot/conversations.

Why the aviation industry must look beyond carbon to get serious about climate change


Flying is responsible for around 5% of human-induced climate change.
Wichudapa/Shutterstock

Commercial aviation has become a cornerstone of our economy and society. It allows us to rapidly transport goods and people across the globe, facilitates over a third of all global trade by value, and supports 87.7 million jobs worldwide. However, the 80-tonne flying machines we see hurtling through our skies at near supersonic speeds also carry some serious environmental baggage.

My team’s recent review paper highlights some promising solutions the aviation industry could put in place now to reduce the harm flying does to our planet. Simply changing the routes we fly could hold the key to drastic reductions in climate impact.

Modern aeroplanes burn kerosene to generate the forward propulsion needed to overcome drag and produce lift. Kerosene is a fossil fuel with excellent energy density, providing lots of energy per kilogram burnt. But when it is burnt, harmful chemicals are released: mainly carbon dioxide (CO₂), nitrogen oxides (NOₓ), water vapour and particulate matter (tiny particles of soot, dirt and liquids).

Aviation is widely known for its carbon footprint, with the industry contributing 2.5% to the global CO₂ burden. While some may argue that this pales in comparison with other sectors, carbon is only responsible for a third of aviation’s full climate impact. Non-CO₂ emissions (mainly NOₓ and ice trails made from aircraft water vapour) make up the remaining two-thirds.

Taking all aircraft emissions into account, flying is responsible for around 5% of human-induced climate change. Given that 89% of the population has never flown, passenger demand is doubling every 20 years, and other sectors are decarbonising much faster, this number is predicted to skyrocket.

Aircraft contrails don’t last long but have a huge impact.
Daniel Ciucci/Unsplash

It’s not just carbon

Aircraft spend most of their time flying at cruise altitude (33,000 to 42,000 ft) where the air is thin, to minimise drag.

At these altitudes, aircraft NOₓ reacts with chemicals in the atmosphere to produce ozone and destroy methane, two very potent greenhouse gases. This aviation-induced ozone is not to be confused with the natural ozone layer, which occurs much higher up and protects the Earth from harmful UV rays. Unfortunately, aircraft NOₓ emissions cause more warming due to ozone production than they do cooling due to methane reduction. This leads to a net warming effect that makes up 16% of aviation’s total climate impact.

Also, when temperatures dip below -40℃ and the air is humid, aircraft water vapour condenses on particles in the exhaust and freezes. This forms an ice cloud known as a contrail. Contrails may be made of ice, but they warm the climate as they trap heat emitted from the Earth’s surface. Despite only lasting a few hours, contrails are responsible for 51% of the aviation industry’s climate warming. This means they warm the planet more than all aircraft carbon emissions that have accumulated since the dawn of powered flight.

Unlike carbon, non-CO₂ emissions cause warming through interactions with the surrounding air. Their climate impact changes depending on atmospheric conditions at the time and location of release.

Cutting non-CO₂ climate impact

Two of the most promising short-term options are climate-optimal routing and formation flight.

Left: Climate optimal routing. Right: Formation flight concept.

Climate-optimal routing involves re-routing aircraft to avoid regions of the atmosphere that are particularly climate-sensitive – for example, where particularly humid air causes long-lived and damaging contrails to form. Research shows that for a small increase in flight distance (usually no more than 1-2% of the journey), the net climate impact of a flight can be reduced by around 20%.

Flight operators can also reduce the impact of their aircraft by flying in formation, with one aircraft flying 1-2 km behind the other. The follower aircraft “surfs” the lead aircraft’s wake, leading to a 5% reduction in both CO₂ and other harmful emissions.

But flying in formation can reduce non-CO₂ warming too. When aircraft exhaust plumes overlap, the emissions within them accumulate. When NOₓ reaches a certain concentration, the rate of ozone production decreases and the warming effect slows.

And when contrails form, they grow by absorbing the surrounding water vapour. In formation flight, the aircraft’s contrails compete for water vapour, making them smaller. Summing all three reductions, formation flight could slash climate impact by up to 24%.

Decarbonising aviation will take time

The aviation industry has fixated on tackling carbon emissions. However, current plans for the industry to reach net zero by 2050 rely on an ambitious 3,000-4,000 times increase in sustainable aviation fuel (SAF) production, problematic carbon offsetting schemes, and the introduction of hydrogen- and electric-powered aircraft. All of these could take several decades to make a difference, so it’s crucial the industry cuts its environmental footprint in the meantime.

Climate-optimal routing and formation flight are two key examples of how we could make change happen faster, compared with a purely carbon-focused approach. But there is currently no political or financial incentive to change tack. It is time governments and the aviation industry start listening to the science, and take aircraft non-CO₂ emissions seriously.The Conversation

———————–

This blog is written by Cabot Institute for the Environment member Kieran Tait, PhD Candidate in Aerospace Engineering, University of BristolThis article is republished from The Conversation under a Creative Commons license. Read the original article.

Kieran Tait


Five satellite images that show how fast our planet is changing


Stocktrek Images, Inc. / Alamy

You have probably seen satellite images of the planet through applications like Google Earth. These provide a fascinating view of the surface of the planet from a unique vantage point and can be both beautiful to look at and useful aids for planning. But satellite observations can provide far more insights than that. In fact, they are essential for understanding how our planet is changing and responding to global heating and can do so much more than just “taking pictures”.

It really is rocket science and the kind of information we can now obtain from what are called Earth observation satellites is revolutionising our ability to carry out a comprehensive and timely health check on the planetary systems we rely on for our survival. We can measure changes in sea level down to a single millimetre, changes in how much water is stored in underground rocks, the temperature of the land and ocean and the spread of atmospheric pollutants and greenhouse gases, all from space.

Here I have selected five striking images that illustrate how Earth observation data is informing climate scientists about the changing characteristics of the planet we call home.

1. The sea level is rising – but where?

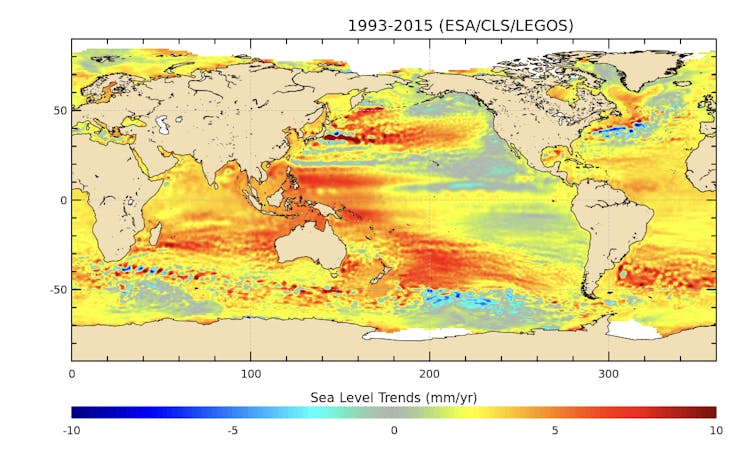
Map showing global sea level rise
The sea is rising quickly – but not evenly.
ESA/CLS/LEGOS, CC BY-SA

Sea level rise is predicted to be one of the most serious consequences of global heating: under the more extreme “business-as-usual” scenario, a two-metre rise would flood 600 million people by the end of this century. The pattern of sea surface height change, however, is not uniform across the oceans.

This image shows mean sea level trends over 13 years in which the global average rise was about 3.2mm a year. But the rate was three or four times faster in some places, like the south western Pacific to the east of Indonesia and New Zealand, where there are numerous small islands and atolls that are already very vulnerable to sea level rise. Meanwhile in other parts of the ocean the sea level has barely changed, such as in the Pacific to the west of North America.

2. Permafrost is thawing

Source: ESA

Permafrost is permanently frozen ground and the vast majority of it lies in the Arctic. It stores huge quantities of carbon but when it thaws, that carbon is released as CO₂ and an even more potent greenhouse gas: methane. Permafrost stores about 1,500 billion tonnes of carbon – twice as much as in the whole of the atmosphere – and it is incredibly important that carbon stays in the ground.

This animation combines satellite, ground-based measurements of soil temperature and computer modelling to map the permafrost temperature at depth across the Arctic and how it is changing with time, giving an indication of where it is thawing.

3. Lockdown cleans Europe’s skies

Source: ESA

Nitrogen dioxide is an atmospheric pollutant that can have serious health impacts, especially for those who are asthmatic or have weakened lung function, and it can increase the acidity of rainfall with damaging effects on sensitive ecosystems and plant health. A major source is from internal combustion engines found in cars and other vehicles.

This animation shows the difference in NO₂ concentrations over Europe before national pandemic-related lockdowns began in March 2020 and just after. The latter shows a dramatic reduction in concentration over major conurbations such as Madrid, Milan and Paris.

4. Deforestation in the Amazon

Credits: ESA/USGS/Deimos Imaging

Tropical forests have been described as the lungs of the planet, breathing in CO₂ and storing it in woody biomass while exhaling oxygen. Deforestation in Amazonia has been in the news recently because of deregulation and increased forest clearing in Brazil but it had been taking place, perhaps not so rapidly, for decades. This animation shows dramatic loss of rainforest in the western Brazilian state of Rondonia between 1986 and 2010, as observed by satellites.

5. A megacity-sized iceberg

Source: ESA

The Antarctic Ice Sheet contains enough frozen water to raise global sea level by 58 metres if it all ended up in the ocean. The floating ice shelves that fringe the continent act as a buffer and barrier between the warm ocean and inland ice but they are vulnerable to both oceanic and atmospheric warming.

This animation shows the break-off of a huge iceberg dubbed A-74, captured by satellite radar images that have the advantage they can “see” through clouds and operate day or night and are thus unaffected by the 24 hours of darkness that occurs during the Antarctic winter. The iceberg that forms is 1,270 km² in area which is about the same size as Greater London.

These examples illustrate just a few ways in which satellite data are providing unique, global observations of key components of the climate system and biosphere that are essential for our understanding of how the planet is changing. We can use this data to monitor those changes and improve models used to predict future change. In the run up to the vitally important UN climate conference, COP26 in Glasgow this November, colleagues and I have produced a briefing paper to highlight the role Earth observation satellites will play in safeguarding the climate and other systems that we rely on to make this beautiful, fragile planet habitable.The Conversation

————————–

This blog is written by Cabot Institute for the Environment member Jonathan Bamber, Professor of Physical Geography, University of Bristol.

This article is republished from The Conversation under a Creative Commons license. Read the original article.

Jonathan Bamber

Indoor air pollution: The ‘killer in the kitchen’

Image credit Clean Cooking Alliance.

Approximately 3 billion people around the world rely on biomass fuels such as wood, charcoal and animal dung which they burn on open fires and using inefficient stoves to meet their daily cooking needs.

Relying on these types of fuels and cooking technologies is a major contributor to indoor air pollution and has serious negative health impacts, including acute respiratory illnesses, pneumonia, strokes, cataracts, heart disease and cancer.

The World Health Organization estimates that indoor air pollution causes nearly 4 million premature deaths annually worldwide – more than the deaths caused by malaria and tuberculosis combined. This led the World Health Organization to label household air pollution “The Killer in the Kitchen”.

As illustrated on the map below, most deaths from indoor air pollution occur in low- and middle-income countries across Africa and Asia. Women and children are disproportionately exposed to the risks of indoor air pollution as they typically spend the most time cooking.

Number of deaths attributable to indoor air pollution in 2017. Image credit Our World in Data.
Replacing open fires and inefficient stoves with modern, cleaner solutions is essential to reduce indoor air pollution and personal exposure to emissions. However, research suggests that only significant reductions in exposure can tangibly reduce negative health impacts.
The Clean Cooking Alliance, established in 2010, has focused mainly on the dissemination of improved cookstoves (ICS) – wood-burning or charcoal stoves designed to be much more efficient than more traditional models – with some success.
Randomised control trials of sole use of ICS have shown reductions in pneumonia and the duration of respiratory infections in children. However, other studies, including some funded by the Alliance, have shown that ICS have not performed well enough in the field to sufficiently reduce indoor air pollution to lessen health risks such as pneumonia and heart disease.
Alternative fuels such as liquid petroleum gas (LPG), biogas and ethanol present other options for cooking with LPG already prevalent in many countries across the world.
LPG is clean-burning and produces much less carbon dioxide than burning biomass but is still a fossil fuel.
Biogas is a clean, renewable fuel made from organic waste, and ethanol is a clean biofuel made from a variety of feedstocks.
Image credit PEEDA

Electric cooking, once seen as a pipe dream for developing countries, is becoming more feasible and affordable due to improvements and reductions in costs of technologies like solar panels and batteries.

Improved cookstoves, alternative fuels and electric cooking have been gaining traction but there is still a long way to go to solving the deadly problem of indoor air pollution.
———————-
This blog is written by Cabot Institute member Peter Thomas, Faculty of Engineering, University of Bristol. Peter’s research focusses on access to energy in humanitarian relief. This blog is co-written by Will Clements, Faculty of Engineering.

Science in action: Air pollution in Bangkok

Bangkok haze 2019 March. Wikimedia Commons.

I was given the opportunity to spend a significant part of 2018 in Bangkok, Thailand, to work with the Chulabhorn Research Institute (CRI) Laboratory of Environmental Toxicology working on a project funded by the Newton Fund on air-quality. Bangkok is a large city with over 14 million inhabitants, which suffer high levels of traffic and congestion resulting in consequent high exposure to traffic-related pollution. It is a UN Sustainable development goal to reduce the number of deaths caused by pollution by 2030. Air pollution is a global problem – a major threat to health throughout the world – but particularly so in low and medium income countries, which account for 92% of pollution related deaths (1). The poor and the marginalised often live in areas of high pollution, and children have a disproportionate exposure to pollutants at a vulnerable stage of development.

The Chulabhorn Research Institute is an independent research institute in Bangkok whose mission includes the application of science and technology to improve the Thai people’s quality of life. The Laboratory of Toxicology, under Professor Mathuros Ruchirawat, have a very strong record in using their results to inform policy and make a real impact on the lives of people in South East Asia affected by environmental toxins. For example, a previous study undertaken by the CRI found that people living and working near busy roads were exposed to Benzene from traffic exhaust, and they demonstrated increased DNA damage. Once this was known, the Thai government was persuaded to alter fuel mixtures in cars to protect the population (2).

I was in Bangkok from January to June, then returned in September till December 2018. I brought with me particle measurement and sampling equipment to count particles and sample particulate matter (PM) in Bangkok to supplement the toxicology work of the Research institute. PM can be described by its size fractions; usually reported are PM10 (aerosol diameter 10 micrometres and lower) and PM2.5 (2.5 micrometres and lower). Less often measured, is the sum-micron range (sometimes referred to as PM1) and the ultrafine range (less than 100 nm).

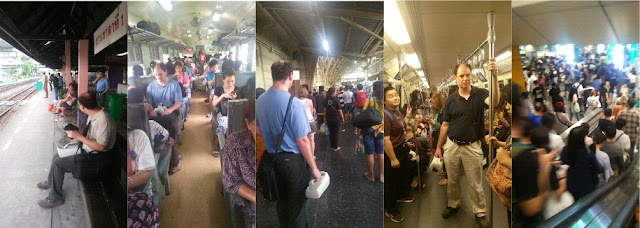
James Matthews with his particle measurement and sampling equipment on public transport in Bangkok.

Below 1 μm, it becomes more difficult to measure particle numbers as optical techniques fail on particles around 200 nm and smaller.  To count them, the particles require a solvent to grow them to a countable size. The requirement for regular solvents, and the high price of aerosol instrumentation to measure the smallest sizes, mean that particle number concentration is not always measured as a matter of course, but new research is indicating that they may be a significant health concern. The smaller particles can penetrate further into the lung and there is some evidence that this may cause them to pass further into the body, possibly even making its way into the brain. While much more research is needed – in both the toxicological and epidemiological domains – to understand the effects of these smaller particles I would not be surprised if the narrative on air quality moves further toward the ultrafine size range in the very near future.

While in Bangkok, I added my aerosol science expertise and experience in aerosol field measurements to the team in the CRI, taking measurements of particle number count using a handheld particle counter, and collecting samples of PM using both PM10 samplers, and a cascade impactor (the Dekati Electrical Low Pressure Impactor) that allowed samples to be separated by aerodynamic size, then collected for further analysis on ICP-MS (inductively coupled plasma mass spectrometry). Thus, metal concentrations within all the different size fractions of aerosol could be found. Within the first few months of the project, I was able to train the staff at the CRI to use this equipment, and so measurements could continue when I returned to the UK.

As well as taking measurements at the CRI in the Lak Si district, north of Bangkok, we chose three sites in the wider Bangkok area that represented different exposure conditions. We were given access to the Thai governmental Pollution Control Department (PCD) air quality measurements sites, where our instrumentation was set up next to their other pollutant measurements.

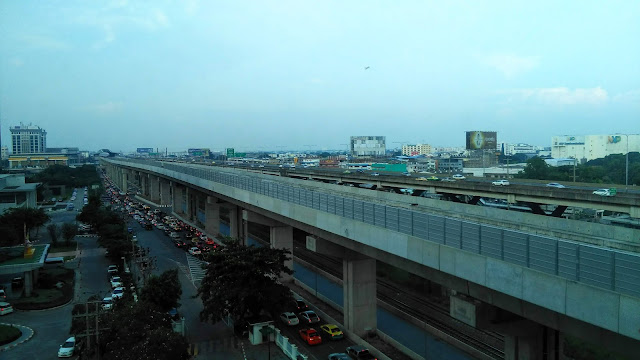
A toll road and railway in Lak Si – from Bangkok toward the Don Mueang airport. Image credit James Matthews.

The three sites included Ayutthaya, a UNESCO world heritage site north of Bangkok. Ayutthaya, while a busy tourist destination, has considerably less traffic, and therefore less traffic emission related pollutants, than the other sites. The second site, Bang Phli, was an area to the South of Bangkok where there is a lot of industry.  The third, Chok Chai, was a roadside site in central Bangkok.

Survey measurements of particle count were taken in several locations using a hand-held particle counter. The particle numbers were highest in measurements on the state railway and on the roads in Bangkok. The state railway through Bangkok is slow moving, where diesel engines repetitively start and brake, all of which contribute to particulates. Conversely the newer sky train and underground railways had low particle counts (the underground had the lowest counts I measured anywhere). At the CRI site, long term measurements near a toll road showed that the particle number count was highest at rush hours, indicating traffic as the dominant contributor. Walking routes in both Bangkok and Ayutthaya showed high concentrations near roads, and in markets and street stalls, where street vendors produce food.

Within our measurements in Bangkok, we were able to measure the mass fraction, and the metal (and some non-metals such as arsenic) content over 12 size fractions from 10 um down to 10 nm. Metals that are known to be deleterious to human health include Cadmium, Chromium, Nickel and Lead, which are class 2 (possible or probable) or class 1 (known) carcinogens. Comparing the reference site (Ayutthaya) with the roadside site (Chok Chai) over several 3-day sampling periods showed that these toxic metals were present in higher concentrations in the area with higher traffic. They were also present in higher concentration in the lower size ranges, which may result in these metals penetrating deeper into the lung.

One episode demonstrated the need for local knowledge when measurements are taken. Normally, we would expect measurements during weekdays to be higher in working areas than at weekends, due to increased work traffic, and in most cases this was the case (Ayutthaya was often an exception, likely due to weekend traffic from tourists). However, one weekend saw a notable peak in aerosol concentrations at a site one Saturday evening, which was difficult to explain. It was pointed out to me by colleagues at the institute that over this weekend was a festival during which the Chinese community in Bangkok traditionally burned items, including fake money, as a long standing tradition. The peak in particles fitted this explanation.

Knowing more about the nature and level of pollutants in a city is an important first step, but challenges persist for the people in Bangkok and other polluted cities as to how to reduce these exposures. The problem of rural crop burning is one that frustrates many in Thailand, as it is well known that the particulates from burnt crops are harmful to the population. While there are strong restrictions on the deliberate burning of crops, it is still common see fields burning in January to March in areas of northern Thailand. Similarly, Bangkok remains the city of the car, with residents accepting that they may have to sit in traffic for long periods to get anywhere.

Burning mountains in Thailand. Wikimedia Commons.

Researchers from Bristol were able to discuss our results alongside measurements from the PCD and the CRI in Bangkok in a seminar held in 2019. It was apparent that there is great awareness of the dangers of air pollution, but it still seems that more needs to be done to address these problems. In January 2019, Bangkok made the headlines for PM2.5 exposures that were at dangerously high levels. January in Thailand is during the ‘cool’ season, where both temperatures and rainfall are low. This weather results in a trapping of pollutants within the city, thus increasing exposure levels. On discussing this with the pollution experts in Thailand, it was argued that the levels this year were typical levels for January, but the reporting of those levels had changed. The Thai PCD advocate communication of pollutant levels though their website and their app, and until recently the PCD sites did not measure PM2.5 in a sufficient number of stations to use it in their air quality index calculations. This year, they changed the calculation to include PM2.5, and as a consequence, the high pollutant levels discussed above were reported. The reporting of these pollutant levels can be attributed to the greater awareness of the population to the problem of pollution, which in turn is leading to a greater urgency in finding solutions.

So there is a role for the direct engagement with the population, which may lead to pressure on governments to respond. There is also a role for science to provide leaders with tangible solutions, such as the suggestion to change fuel mixtures. But the huge challenge of reducing sources of pollutants in a growing city like Bangkok remains.

1 Landringham, P. J. et al 2017. Lancet 391, 462-512
2 Davies R., 2018. Lancet 391, 421.

————————–
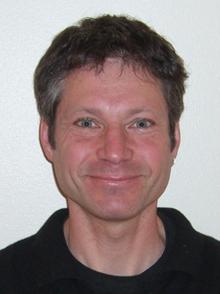
This blog is written by Cabot Institute member Dr James Matthews, School of Chemistry, University of Bristol. James’ research looks at the flow of gases in urban environments, and the use of perfluorocarbon trace gas releases to map the passage of air in urban cities.
James Matthews

How we traced ‘mystery emissions’ of CFCs back to eastern China

Since being universally ratified in the 1980s, the Montreal Protocol – the treaty charged with healing the ozone layer – has been wildly successful in causing large reductions in emissions of ozone depleting substances. Along the way, it has also averted a sizeable amount of global warming, as those same substances are also potent greenhouse gases. No wonder the ozone process is often held up as a model of how the international community could work together to tackle climate change.

However, new research we have published with colleagues in Nature shows that global emissions of the second most abundant ozone-depleting gas, CFC-11, have increased globally since 2013, primarily because of increases in emissions from eastern China. Our results strongly suggest a violation of the Montreal Protocol.

A global ban on the production of CFCs has been in force since 2010, due to their central role in depleting the stratospheric ozone layer, which protects us from the sun’s ultraviolet radiation. Since global restrictions on CFC production and use began to bite, atmospheric scientists had become used to seeing steady or accelerating year-on-year declines in their concentration.

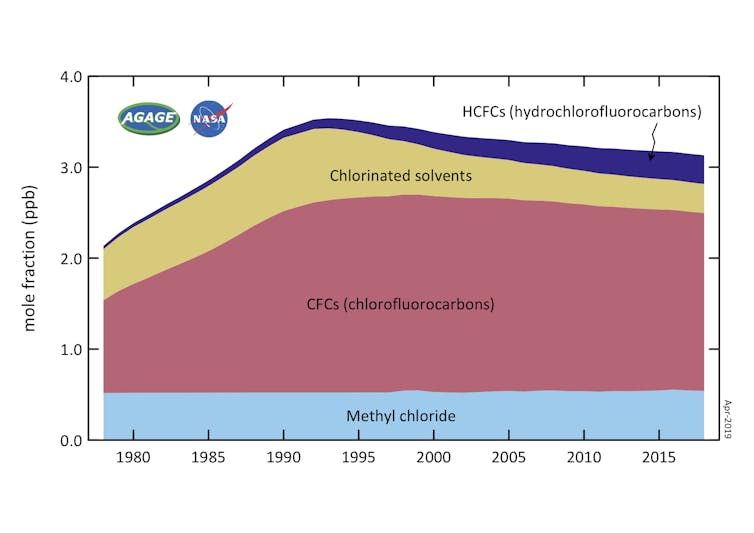
Ozone-depleting gases, measured in the lower atmosphere. Decline since the early 1990s is primarily due to the controls on production under the Montreal Protocol. AGAGE / CSIRO

But bucking the long-term trend, a strange signal began to emerge in 2013: the rate of decline of the second most abundant CFC was slowing. Before it was banned, the gas, CFC-11, was used primarily to make insulating foams. This meant that any remaining emissions should be due to leakage from “banks” of old foams in buildings and refrigerators, which should gradually decline with time.

But in that study published last year, measurements from remote monitoring stations suggested that someone was producing and using CFC-11 again, leading to thousands of tonnes of new emissions to the atmosphere each year. Hints in the data available at the time suggested that eastern Asia accounted for some unknown fraction of the global increase, but it was not clear where exactly these emissions came from.

Growing ‘plumes’ over Korea and Japan

Scientists, including ourselves, immediately began to look for clues from other measurements around the world. Most monitoring stations, primarily in North America and Europe, were consistent with gradually declining emissions in the nearby surrounding regions, as expected.
But all was not quite right at two stations: one on Jeju Island, South Korea, and the other on Hateruma Island, Japan.

These sites showed “spikes” in concentration when plumes of CFC-11 from nearby industrialised regions passed by, and these spikes had got bigger since 2013. The implication was clear: emissions had increased from somewhere nearby.

To further narrow things down, we ran computer models that could use weather data to simulate how pollution plumes travel through the atmosphere.

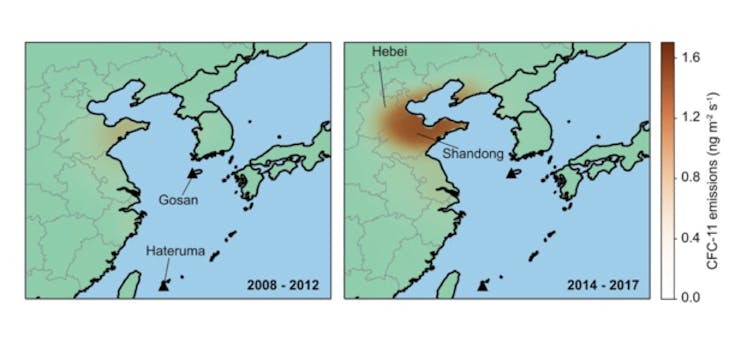
Atmospheric observations at Gosan and Hateruma monitoring stations showed an increase in CFC-11 emissions from China, primarily from Shandong, Hebei and surrounding provinces. Rigby et al, Author provided

From the simulations and the measured concentrations of CFC-11, it became apparent that a major change had occurred over eastern China. Emissions between 2014 and 2017 were around 7,000 tonnes per year higher than during 2008 to 2012. This represents more than a doubling of emissions from the region, and accounts for at least 40% to 60% of the global increase. In terms of the impact on climate, the new emissions are roughly equivalent to the annual CO₂ emissions of London.

The most plausible explanation for such an increase is that CFC-11 was still being produced, even after the global ban, and on-the-ground investigations by the Environmental Investigations Agency and the New York Times seemed to confirm continued production and use of CFC-11 even in 2018, although they weren’t able to determine how significant it was.

While it’s not known exactly why production and use of CFC-11 apparently restarted in China after the 2010 ban, these reports noted that it may be that some foam producers were not willing to transition to using second generation substitutes (HFCs and other gases, which are not harmful to the ozone layer) as the supply of the first generation substitutes (HCFCs) was becoming restricted for the first time in 2013.

Bigger than the ozone hole

Chinese authorities have said they will “crack-down” on any illegal production. We hope that the new data in our study will help. Ultimately, if China successfully eliminates the new emissions sources, then the long-term negative impact on the ozone layer and climate could be modest, and a megacity-sized amount of CO₂-equivalent emissions would be avoided. But if emissions continue at their current rate, it could undo part of the success of the Montreal Protocol.


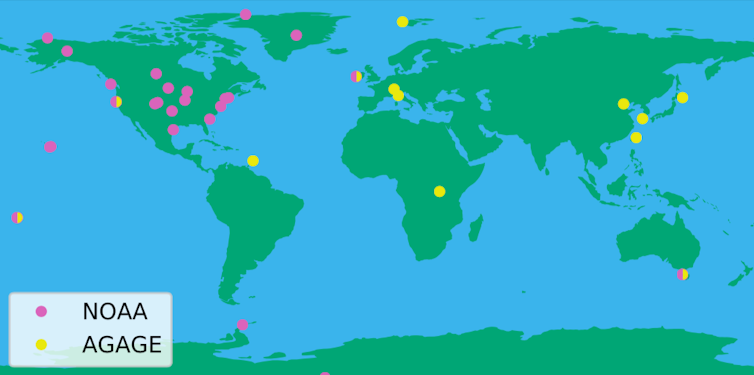
The network of global (AGAGE) and US-run (NOAA) monitoring stations. Luke Western, Author provided

While this story demonstrates the critical value of atmospheric monitoring networks, it also highlights a weakness of the current system. As pollutants quickly disperse in the atmosphere, and as there are only so many measurement stations, we were only able to get detailed information on emissions from certain parts of the world.

Therefore, if the major sources of CFC-11 had been a few hundred kilometres further to the west or south in China, or in unmonitored parts of the world, such as India, Russia, South America or most of Africa, the puzzle would remain unsolved. Indeed, there are still parts of the recent global emissions rise that remain unattributed to any specific region.

When governments and policy makers are armed with this atmospheric data, they will be in a much better position to consider effective measures. Without it, detective work is severely hampered.


—————————
This blog is written by Cabot Institute member Dr Matt Rigby, Reader in Atmospheric Chemistry, University of Bristol; Luke Western, Research Associate in Atmospheric Science, University of Bristol, and Steve Montzka, Research Chemist, NOAA ESRL Global Monitoring Division, University of ColoradoThis article is republished from The Conversation under a Creative Commons license. Read the original article.

Listen to Matt Rigby talk about CFC emissions on BBC Radio 4’s Inside Science programme.

MetroLabs visit: Sharing experiences of implementing smart cities

Image credit: CarriAyne Jone, (Head of Science and Innovation, British Consulate-General, Atlanta)

In December 2017 I was invited to take part in the Metro Lab Annual Summit, taking place in Georgia Tech in the United States. I thought it worthwhile to share a few of my own thoughts about the meeting and what can be drawn from the experience.

The MetroLab Network includes 41 cities and 55 universities within the United States that have formed city-university partnerships that focus on research, development and deployment projects to offer solutions to many of the challenges facing urban areas. These allow decision makers and researchers to work together within their cities to achieve better urban living, while being able to share best practice from each other’s experiences.

The visit was facilitated by the UK Science and Innovation Network, part of the Foreign and Commonwealth Office who provide opportunities for international collaboration. As well as delegates from the University of Bristol and Bristol City Council, we shared the visit with delegates from Glasgow and Strathclyde and from Innovate UK. Bristol has been designated as the UKs ‘smartest city’ according the smart city index commissioned by Huawei UK. A number of current innovations at Bristol are helping to develop the smart city capability including Bristol is Open, a joint venture between the city and university providing a digital infrastructure; and the Digital Health strategy (including IRC SPHERE ) that utilises sensing technology to facilitate healthier living. My own future work plans fit into this agenda, as I am trialling air quality and meteorological sensors that will help inform when and where I can run my gas tracer and aerosol measurement experimental campaigns.

In the morning of the day before the Summit, our delegation was introduced to the Consulate General and staff in their Atlanta office. Afterwards, we visited Southface, a company that promotes sustainable development and green building. Their offices included buildings designed to be exemplars of the type of technologies that they promote. I look forward to finding out more on some of the work they are doing in the monitoring of pollutants indoors from outdoors. After this visit we attended the launch of the Smart city and data-driven energy policy program, within which presentations were given on how a city could increase energy efficiencies, and the net gains that could be achieved.

The first day of the summit was held in the Georgia Institute of Technology Historic Academy of Medicine. The sessions included round table discussions from civic leaders, including mayors and chief technology/data/information officers (or similar variations of that title) about the challenges facing cities in the future, and how technologies can be used to address them, particularly in the gathering of data. Hearing civil leaders emphasising their commitment to action on climate change and public health independently of national policy was an encouragement to me.

Throughout both days, a number of research and development projects were highlighted that showed the benefit of smart technologies. One such technology was Numina, demonstrated in Jacksonville, which tracked traffic, bike and pedestrian movements so that cities have a better idea of what is happening on their streets. An 18 mile stretch of highway near Georgia has been turned into a living lab known as the Ray C Anderson memorial highway (The Ray) incorporating a driveable solar road surface, EV charge points and tyre safety checks. Another presentation described an ambitious attempt to link Portland, Seattle and Vancouver in the larger ‘megapolitan’ region of Cascadia, which would provide better management of transport over the area.

James Matthews (second from left) participated in a panel discussion on Air Quality Sensing in Smart Cities.  Image credit: Melissa Wooten (Vice Consul for Prosperity and Economic Policy, British Consulate-General, Chicago).

On the second day, there were, among other things, discussions on data privacy and an update on the Array of Things. The Array of Things is a project by Argonne Labs and Chicago University that is building a platform by which an instrumented ‘node’ can be connected to an urban network, collecting environmental sensing data which could include air quality, traffic and meteorology. These are currently being trialled in Chicago and will soon be sent to participating partner cities, including Bristol.

In the afternoon it was my privilege to participate in a panel discussion on Air Quality Sensing in Smart Cities, where I provided the perspective of a researcher in urban meteorology and pollution dynamics who is attempting to use the Bristol is Open smart city technology to assist with my research. The other panel members were Vincent McInally from Glasgow City Council who provided his experiences addressing air quality in Glasgow, including maintaining air quality measurement networks in the city, and Don DuRousseau from DWU, Washington DC who has many years experience in real-time systems, cybersecurity and informatics and has worked to set up high speed connectivity in many MetroLab partners.

The discussion included concerns about low-cost, (or low-accuracy as Vincent suggested we  call them) sensors in reflecting true values of pollution in the city, and whether we can use the higher specification instrumentation to validate their usage and the related discussion on sensor placement and temporal variability or their output. The dangers of false positives, in particular from citizen sensing initiatives, was brought up in relation to these reliability concerns, and how these limitations can be communicated with the public such that the information can be better interpreted. There is certainly value in giving real time air quality information to the public, and it is something I have discussed with many project partners within Bristol, but this leads to the dilemma of whether the data needs to be filtered in some way so as to account for the errors, or whether the public have a right to all the data as a matter of course. The discussion also included some examples of how sensor measurements, and other initiatives, have been used to make a positive difference in city life.

Overall, the experience was a positive one for our delegation and shows the value of both using new technologies to affect positive change in city life, it underlined the merits in strong communication and collaboration between city leadership and the universities, and furthermore, showed the value of civic leaders and university academics from different cities coming together to share each other’s experiences of implementing smart cities. It may be time to consider how those cities in the UK could also bring together our own experiences.

——————————–
This blog is written by Cabot Institute member Dr James Matthews, a Senior Research Associate at the University of Bristol.  James is interested in the flow of gases in urban environments, and use perfluorocarbon trace gas releases to map the passage of air in urban cities.  He is currently running an extended field campaign measuring air quality for four months in Bangkok.
James Matthews

MSc Environmental Policy and Management Course Trip to Warsaw, Poland

Each year, students on the MSc Environmental Policy and Management program receive funding to plan an educational trip in Europe. Previous cohorts have chosen to visit Berlin, Copenhagen, Riga, and Amsterdam. This year, we democratically decided to visit Warsaw. We chose to do so not because the city and Poland are exemplary in environmental management, but rather because they have real challenges facing them in the transition to a low-carbon future.

The energy sector represents the biggest environmental challenge in Poland and government leaders are reported to actively oppose European Union climate change targets (Kowalski, 2016). After its most recent election (2015), the country announced that energy policy would prioritise the exploitation of domestic coal deposits. Indeed, there is a historical and cultural attachment to coal in Poland, as the coal industry was influential in the country’s socio-economic development in the period between World War I and World War II, and during the post-World War II Communist era (Kowalski, 2016). More recently, coal has been promoted as a path to increase Poland’s energy independence, particularly from Russia, by reducing the need for imported fuel.

Poland has consistently been one of the biggest coal producers in the EU (Lukaszewska, 2011). A large majority of the country’s electricity generation (80 – 94%) comes from coal-fired power plants fuelled by domestic hard coal and lignite (Kozlowska, 2017; Lukaszewska, 2011). The dominant position of these fossil fuels in Poland’s energy mix presents a significant challenge in the fight against global climate change. We arranged meetings with the Polish Climate Coalition, the Heinrich Böll Foundation, and Greenpeace Poland to learn more.

Our first meeting was with the Polish Climate Coalition. As our large cohort climbed the stairs to their office, it soon became clear that we would not all fit in and so we turned back and headed for a local café just around the corner. Walking with Krzysztof and Urszula, they seemed apologetic, but they need not have been. We found the experience to be an honest representation of how a grassroots organisation may operate when fighting for causes arguably more important than having a fancy corporate office. The Coalition is an association of 22 NGOs engaged in climate protection and includes Friends of the Earth, Greenpeace, and ClientEarth. It was established under the outright belief that humans are responsible for climate change.

Over the next 90 minutes, Krzysztof and Urszula provided us with an in-depth overview of the energy sector in Poland. We learned that the dominant driving force for current practice is a flawed interpretation of energy security which focuses on supply in lieu of other considerations, such as tackling fuel poverty and environmental pollution or ensuring stable, long-term access to energy.

The Polish energy sector is seemingly outdated and inadequate in the face of 21st century challenges. It was particularly concerning to hear that the combination of both a dry winter in 2014 and a hot summer in 2015 significantly reduced the water levels in Poland’s rivers. These rivers are the primary source of water for cooling the country’s coal-fired power plants, and in August 2015, power restrictions were imposed on 1,600 of the biggest companies in Poland as a result (Olszwski, 2015). The population face an ever-increasing risk of power blackouts due to the vulnerability of the energy sector from over-reliance on coal. If hot summers persist (temperatures exceeded 24C on the day of our visit in May!), then such vulnerability will surely continue.

One thing became clear in that, despite the major challenges which Poland faces, there are good people like Krzysztof and Urszula who are willing to fight the uphill battle, within a context where motivation must surely be difficult to find.

Upon arrival at the Heinrich Böll Foundation, for our second meeting, we were welcomed into a light, air-conditioned conference room where water and nibbles were laid out for us. While our physical environment was starkly different to our first meeting, we soon realised an overarching theme in Poland.

The Heinrich Böll Foundation is a politically independent ‘green visions’ think tank with 30 offices worldwide. Their work is divided into three programmes and we met with Katarzyna from the Energy and Climate programme in Warsaw, whose work aims to intensify the discourse about the challenges presented by energy transformation and climate change.

Much of Katarzyna’s message reinforced what we had learned in our first meeting. However, it was particularly interesting to enter into a discussion about air pollution toward the end of her presentation. We learned that coal is not only the primary source of electricity production, but is also still burned, alongside rubbish and other discarded materials, to heat homes in the winter, creating an ever-worsening problem with smog in Warsaw and across Poland. We were told that in the winter of 2016 – 2017, smog was so thick that you could not see your hand in front of you. In January 2017, air pollution in Warsaw was so bad that local authorities decided to limit local emissions by making public transport free for a short period. Approximately 45,000 people in Poland die each year from air pollution (Kozlowska, 2017). The total population is around 38 million (“Population, total,” 2017).

Our final meeting was with Greenpeace, and this took us away from the city centre to their office in what was once a very large home. Many of us took advantage of Warsaw’s bike rental scheme, called Veturilo, to make the almost 6-kilometre ride from our hostel along cycle lanes, roads, and even the sidewalk.

The office culture immediately felt distinct to that of the previous two organisations. Staff dressed more casually; unmade bunk beds showed us where visiting volunteers can stay; bumper stickers and sketched environmental messages decorated some walls; and stuffed bees the size of large dogs hung from the ceiling (purportedly they have used the bees for campaigning). The efforts of Greenpeace Poland depend less on paper and pen and more on influential signage and community engagement.

Our contact, Anna, shared stories of human chains to call attention to the rivers that have dried up because of open-pit lignite mining. She taught us about the mining process, showing us on a map of the country where current mines are operating and new ones are planned. The process destroys landscapes, diverts massive volumes of water, and forces displacement of people. The low energy content of lignite means power plants must be built immediately adjacent to the mines. Since opening about 10 years ago, Greenpeace Poland has had some successes. Anna shared her involvement in advocating for the sale of excess renewable energy back to the grid, which ultimately came to pass, at least temporarily. To highlight that the battle for environmental progress is constantly uphill however, the government later reverted this policy, and at the time of writing has not reinstated it.

Despite a certain level of negativity in our meetings, Anna’s anecdote provided some optimism. The temporary success depended on using political divisions and public advertising focusing on the benefits to individuals. Though a small step, it shows that sometimes addressing the self-interest of the general public can be an effective way to combat environmental issues in a country with Poland’s political context.

Due to a lack of climate change education in Poland, environmentalism must be achieved through its benefits to the public rather than through traditional means. Indifference towards environmentalism is something that can be seen in other countries, and to us provided a good indication of how hostile public attitudes can be addressed to allow for environmental and climate protection. One of the authors, Michael, comes from Texas and found parallels between the situation in Poland and that back home. Progress cannot depend on a shared sense of responsibility to address climate change, in which many people do not even believe. Counterproductive financial interests are rampant. However, reframing the conversation to discuss savings from energy efficiency, economic opportunities in renewables, and energy security can achieve gains in the low-carbon transition. In Texas, wind power has boomed not because of political or public will to move beyond fossil fuels, but because of its economic viability.

We are truly grateful to the School of Geography for affording us the opportunity to undertake this trip. Beyond learning more about the energy system in Poland and organisations working to improve it, we became closer as a cohort and had a wonderful time.

The reader can reach out with any questions on the trip or the program to the authors of this blog post: Mark Nichols (mn16169@my.bristol.ac.uk), Allan MacLeod (am12313@my.bristol.ac.uk), or Michael Donatti (md16045@my.bristol.ac.uk).

References
Kowalski, K., 2016. In Poland, efforts to rescue coal industry will likely come up short. [online] Available: https://pl.boell.org/en/2016/09/26/poland-efforts-rescue-coal-industry-will-likely-come-short

Kozlowska, H., 2017. When it comes to air pollution, Poland is the China of Europe. [online] Available: https://qz.com/882158/with-air-pollution-skyrocketing-warsaw-is-severely-hit-by-polands-smog-problem/

Lukaszewska, H., 2011. Poland’s Energu Security Strategy. Journal of Energy Security.

Olszewski, M., 2015. The Polish Energy Drought. [online] Available: https://energytransition.org/2015/09/the-polish-energy-drought/

“Population, Total.” The World Bank, 2017. http://data.worldbank.org/indicator/SP.POP.TOTL.

Yangon’s mobility crisis: A governance problem

A mobility crisis has arisen in Yangon, Myanmar, as growth-induced congestion is slowing travel times for the city’s widely used buses, thereby incentivising car ownership and increasing traffic further. The key cause is poor governance, which manifests itself through fragmented planning, low public infrastructure investment, and a ban on motorcycles and bicycles.

Home to more than 5 million people and producing nearly a quarter of Myanmar’s gross domestic product, this metropolis is once again buzzing with activity as it reopens to the world after decades of military rule. But Yangon’s potential to serve as an engine of economic growth for the nation is being severely undermined by a mobility crisis. As the economy speeds up, the city slows down.

Journey times have skyrocketed in the city as the streets become ever more crowded. Some estimates suggest travel speeds at peak times have dropped from 38 km/h in 2007 to 10-15 km/h in 2015. This slowdown matters for several reasons. First, such high congestion places a significant drag on productivity by raising the cost of doing business and generating friction in the greater Yangon labour market. It is harder for workers to commute to the jobs they are qualified for. Second, the worst affected are the poorest. As a group, they spend the highest share of income on transport and the most time in traffic, which impedes poverty reduction efforts and adds to inequality. Third, air pollution has reached dangerous levels. The World Health Organization finds that Myanmar has some of the worst air pollution in the world, due in part to “inefficient modes of transport”.

The proximate causes: liberalisation and economic growth

Yangon’s mobility crisis is a positive indicator insofar as it reflects robust economic growth. Estimating the city’s growth rate is challenging due to a lack of economic data. However, by exploiting satellite images of night-time lights, which can be used as a rough proxy for economic activity, we can get an idea of the pace of growth. Figures 1 and 2 show images of Yangon at night in 2003 and 2013, respectively. Over this period, the level of luminosity nearly tripled, which we estimate translates into an impressive average annual growth rate in output of 8.5%. Growth appears to have been accelerating, given our estimate that the city grew at an average annual rate of 11.2% between 2008 and 2013.

Figure 1: Luminosity in Yangon Region, 2003


Figure 2: Luminosity in Yangon Region, 2013

Since 2011 this growth has been accompanied by a large expansion of personal automobile usage. It was virtually impossible to import automobiles prior to 2011 due to heavy restrictions imposed by the military. The relaxation of vehicle import restrictions, as part of a wider range of liberalisation reforms in recent years, has revealed extensive pent up vehicle demand and allowed a precipitous decline in car prices. Yangon’s burgeoning middle class has jumped at the opportunity to acquire newly imported vehicles and escape the deteriorating bus system. Official figures indicate that there was a 153% increase in registered vehicles in Yangon between 2011 and 2014 alone.

The congestion incentive spiral

The surge in automobile ownership has set in motion a “congestion incentive spiral” that has exacerbated traffic. Prior to liberalisation, buses were by far the dominant mode of transport. The bus system was run as a competitive cartel with a restricted number of private bus owners competing for passengers on similar routes. This incentivised overcrowding, reckless driving, and under-investment in bus fleet maintenance — all of which contributed to congestion and a poor passenger experience.

For those who can afford a car, abandoning the buses is rational. Cars are more comfortable and always quicker than buses. The ability to go directly from origin to destination without stops or transfers significantly reduces the overall journey time. There remains a dilemma: the more people abandon buses, the worse traffic becomes, and the greater the incentive to use private transport. It is an incentive spiral that can only be broken by dramatically increasing the costs of individual car use or by providing an attractive alternative.


Fragmented governance as a root cause

There is no ready alternative to buses and cars in Yangon due to a legacy of poor planning, low public investment, and the fact that motorcycles and bicycles are banned in the city. In fact, there has been no significant investment in public transport infrastructure since the colonial era when the city’s Circular Railway was built. The railway is running and affordable, but its slow speed and limited coverage mean it attracts only a small fraction of Yangon’s commuters.

The emergence of the dysfunctional private bus cartel was an organic response to the lack of alternatives, which in turn was a consequence of the systematic lack of public investment in transport infrastructure and services. This crisis of governance persists today despite the energetic efforts of the current Chief Minister of Yangon, who has driven an impressive reform of the bus system by breaking the cartel and introducing proper public oversight.

An improved bus system, however, will not be enough to break the congestion incentive spiral now that so many people have purchased cars. What is required is a comprehensive and financially viable transport plan developed and implemented by a public transport authority with a metropolitan remit. Currently, the delivery of city infrastructure and services is fragmented across three tiers of government and dozens of agencies and offices. This fragmentation of governance is the true underlying cause of Yangon’s mobility crisis.

A path forward: governance then infrastructure

It is important to frame the problem as a mobility crisis, not a traffic congestion crisis. People can move through cities in many ways, and all large cities have traffic congestion challenges. More prepared cities do not suffer from mobility crises because other transport options are available: bus rapid transit systems that are insulated from traffic; cycling infrastructure; rail networks; and pedestrian-friendly mixed-used developments that reduce the demand for vehicular travel.

Relatively modest public investment could help Yangon. Nonetheless, a bus rapid transit plan announced in 2014 unfortunately appears to have been shelved. The mostly flat topography of Yangon is conducive to cycling. Relaxing restrictions on the use of bicycles on key arteries and in the city centre, combined with modest investments in cycling infrastructure, could provide an affordable alternative mode of individualised transport in the city.

These initiatives require significant governance reforms to succeed. Yangon is projected to join the ranks of the world’s mega-cities (i.e. cities with 10 million or more inhabitants) by 2030. With this growth comes physical expansion, which alters commuting patterns and transport demand. Without a concerted and sustained intervention by a metropolitan-scale transport authority with a mandate to maximise urban mobility, Yangon’s transit woes will surely worsen and further undermine the city’s enormous potential to support Myanmar’s economic renaissance.

This blog is written by Dr Sean Fox (Political Economy of Development & Urban Geography) and originally hosted on the IGC blog.

Life of breath: Understanding air pollution and disease through the Arts

Media vita in morte sumus.  Image from You Tube.

I have written on the Life of Breath blog about the symmetry between breathing as life, and breathlessness as death (as it appears in the words of the haka – see ‘I will not be drowned’).  The line media vita in morte sumus (‘in the midst of life we are in death’) was supposedly composed around the end of the first millennium, but is now believed to be a much older phrase, encapsulating a still older idea: that understanding something means encountering and attempting to understand its counterpart (1).  Just as All Hallows and All Saints are separated by nothing more than midnight, life and death cannot be separated from (nor understood without) each other. The Life of Breath project is a five-year senior investigator award funded by the Wellcome Trust (PIs Prof. Havi Carel at the University of Bristol and Prof. Jane Macnaughton at Durham University), considering breathing and its ‘pathological derivative’ breathlessness as two halves of a whole.

This sense of opposing ideas, linked and hinged in the middle, can also be found in some of the causes of breathlessness, such as smoke. Smoke resists definition. It can be dirty, as in Blake’s poem ‘London’ (‘Every black’ning Church appals’) or at the beginning of ‘Paradise Lost’ (‘a pitchy cloud of locusts’); or it can be cleansing, for example when fumigating a building. It can be a tool, to give food flavour and longevity, or to stupefy bees; or it can be a silent killer in a house fire, more dangerous than the fire itself. Smoke can also be holy, as in the veils of smoke and incense that surround God in the Old Testament. Steven Connor speaks of the God encountered in the Old Testament as ‘a smoky God … His ineffability and unapproachability are signified in the cloud of smoke’ that descends on Mount Sinai, and notes the duality I just mentioned, stating that ‘Smoke can be life, spirit, meaning itself; but it is also horror, filth, chaos’(2).  It seems natural, then, that we can find smoke both comforting (smokers may enjoy the smell of cigarette smoke, church-goers the spicy smell and ritual of the thurible) and disturbing: something that causes us to cough or wheeze, or which, over time, permanently compromises our ability to sing, speak or breathe (3).

Nelson’s Column during The Great
Smog, 1952.  Image taken from
geograph.org.uk via Wikipedia

This last is our most pressing concern when we consider smoke discharged directly into the air, whether it is via an exhaust pipe or a chimney (what Connor calls ‘the sewer into the sky’). These ideas are also bound up in historical approaches to breathlessness, respiratory diseases and conditions, and their relationship with smoke and air pollution (4).  A member of the project advisory board, Mark Jackson, notes that, before chronic or seasonal respiratory conditions such as asthma were properly understood, patients were given conflicting advice. Those suffering from hay fever or ‘summer sneezing’ were often told to treat their condition with ‘fresh air’, visiting the coast to inhale the supposedly clean sea breezes (5).  Elsewhere, Jackson tells us that during the Industrial Revolution, asthma sufferers might be given the opposite advice and told to breathe sooty air for its supposedly antibacterial properties (6).  Both Connor and Jackson write about the Great Smog of 1952, which killed several thousand people in the capital through exacerbating or inducing respiratory and cardiac disease. Here we might note another pair (the heart and the lungs) that cannot be easily separated, as we discussed at the first meeting of the core project team (see ‘Taking a deep breath’). Jackson notes that the link between pollution and disease was already well established before the Great Smog, and before the 1956 Clean Air Act it led to (7).  He states that the Act focused on ‘visible’ pollution, specifically prohibiting the emission of ‘dark smoke’, but paid less attention to invisible pollutants such as sulphur oxides and carbon monoxide.

As well as ignoring or dismissing pollutants that we cannot see, perhaps it is a natural human response to look on the vastness of the sky or the ocean, and assume that their sheer size dwarfs anything discharged into those spaces, rendering it dilute and harmless. As suggested by the invisible poisonous gases wafting stealthily around our towns and cities (or, indeed, our supposedly clean countryside and coastline), very often we are oblivious to that which threatens us. However, complacency offers us no protection from the consequences of air pollution, particularly for respiratory health. For example, chronic obstructive pulmonary disease (COPD) is now the fourth most-common cause of death worldwide, but there is no comprehensive history of breathlessness in a clinical context, a lacuna that the Life of Breath project aims to fill. The project will also attempt to situate breathing and breathlessness in their proper context via an interdisciplinary approach that draws on patient experience and clinical practice, as well as other relevant disciplines, such as medical humanities, history, philosophy, literature and anthropology, using each area to inform the others.

The funeral sentences in the Book of Common Prayer include the line ‘in the midst of life we are in death’. They go on, ‘Thou knowest, Lord, the secrets of our hearts’. As the Life of Breath project indicates, our lungs have secrets, too.

References

  1. The phrase media vita in morte sumus is sometimes attributed to Notker I, also known as Notker the Stammerer, a Benedictine monk and poet. He is supposed to have coined it after observing a half-built bridge stretching shakily out over a chasm.
  2. Steven Connor, ‘Smog’, a talk broadcast on Nightwaves (Radio 3), 2nd December 2002, to mark fifty years since London’s Great Smog.
  3. See Steven Connor’s essay ‘Whisper Music’ for his (and Aristotle’s) comments on coughing.
  4. Steven Connor, ‘Unholy Smoke’, a talk given at Trailing Smoke, Art Workers Guild, London, 12 November 2008, accompanying the exhibition Smoke.
  5. See Mark Jackson, Allergy: The history of a modern malady (London: Reaktion).
  6. Mark Jackson (2004), ‘Cleansing the air and promoting health: the politics of pollution in post-war Britain’, in Medicine, the Market and Mass Media: Producing Health in the Twentieth Century, eds. Virginia Berridge and Kelly Loughlin (London: Routledge).
  7. Jackson, ‘The politics of pollution’.

———————————–
This blog is written by Jess Farr-Cox in the School of Arts at the University of Bristol, Research Secretary on the Life of Breath project.

A full description of the scope of research, including all the different research strands, can be found on the About the project page of the project website.