
What does water mean to you?


Hidden Water: Valuing water we cannot see
Join the discussion
What does water mean to you? Tag @cabotinstitute and #WorldWater #Water2me on Twitter to let us know.
 |
| Adele Hulin |
Bristol Science Film Festival 2021 – Cabot Institute for the Environment film prize

Film is a medium that so many of us connect over, whether going to the movies, watching YouTube videos with friends, or sharing clips on Instagram. With the increasing prevalence of mini-movie-making machines (smartphones), we think film is a great and accessible form of science communication! Bristol Science Film Festival runs an annual science film competition to support all those film-makers trying to tell the most interesting facts (or science fictions), no matter their resources. Shortlisted films are screened on the Big Screen in Bristol and at a special film-makers screening during the Festival.
There will be an additional prize awarded this year for a short film submitted to the competition with an environmental or climate change theme. Cash prizes will be awarded to the winner and runner up on behalf of the Cabot Institute for the Environment.
The University of Bristol-based Institute supports evidence-based and interdisciplinary solutions to environmental challenges. The Institute makes use of an academic network of 600 that collaborate to improve the way we live now and tackle the negative impacts we have on our surroundings.
The Cabot Institute wants to see your short science fiction or fact films with an environmental theme. These could explore topics from water and food security to new technology that will help us deliver a low-carbon future. You could even show us what you think our future built environment will look like.
The Cabot Institute will award £150 to the winner and £50 to the runner up. To be considered, just submit your environmental film to our Festival via FilmFreeway and you’ll automatically be considered for the Cabot Institute for the Environment film prize.
Already submitted your film? We don’t make final decisions until after the competition closing date of May 1st, 2021. If you have already submitted your film on an environment-related topic, it’ll automatically be eligible for the Cabot Institute prize.
Any questions, please get in touch. Good luck!
———————–
This blog was reposted with kind permission from the Bristol Science Film Festival. View the original blog.
“Between the Insect Hordes and Ourselves”: Imaginaries of insect declines from the 1960s onwards
 |
| A still from Bee Movie (2007), directed by Simon J. Smith and Steven Hickner |
‘According to all known laws of aviation, there is no way a bee should be able to fly. Its wings are too small to get its fat little body off the ground. The bee, of course, flies anyway because bees don’t care what humans think is impossible.’ You might recognise these words as the opening from the animated film Bee Movie (2007). The film is as known for its memes as its compulsive heteronormativity. If you are unaware: not only are there many happy nuclear bee families, the star of the film, Barry, is a male worker bee. On top of that, the human woman with whom Barry takes on the honey industry and fights for equal bee rights appears to develop some warm feelings for him. Needless to say, Bee Movie is fun but not a cinematographic masterpiece.
Jokes aside, the 2007 film is a good indicator of an influx of documentaries, memoirs, novels, and poetry collections starring the Western or European honeybee. Perhaps I’m being too critical here. This influx does excite me in a way, as it shows that insect life and decline has become part of a broader conversation. But, with this awareness of insect decline in our cultural imagination comes a sting in the tale. In this case, the sting is an almost obsessive focus on the European honeybee in an age of overall insect decline and what Elizabeth Kolbert (2014) popularised as the sixth extinction. There are thousands of known species of bees all over the world—not to mention other bugs—and yet a select group of people continue to talk, write, film, draw and campaign for the European honeybee. (Are you familiar with the concept of bee-washing?)
In response to these stories, I started thinking about the following: why is there so much creative work on the honeybee? Insects make up the most biodiverse and largest class of described (and estimated) species in the animal kingdom. And while many of these—not all—are indeed facing decline or even extinction, the European honeybee is not one of them.
What started out as a general interest, quickly evolved—metamorphosed!—into my doctoral project on insect decline. Inspired by Ursula Heise’s (2016) work on the cultural side of extinction, I started asking the following: what kind of narratives do people create when talking about insect decline, and how do they tie in with other and older insect stories, our broader cultural memory? Is there an explanation to be found for this honeybee hyperfocus when it comes to narratives of insect decline? Thinking about these questions, I kept returning to Donna Haraway, who wrote that ‘it matters what stories we tell to tell other stories with … It matters what stories make worlds, what worlds make stories.’ (12) Haraway’s keen (if not overcited) observation also applies to the case of insect decline. When looking at creative storytelling—of which there is a lot—we’re not just considering entertainment or aesthetics. Even with something as seemingly banal as Bee Movie, it does matter what stories we tell to tell the story of insect decline. So why do people contribute to this, for lack of a better word, honeybee extravaganza?
 |
| An assortment of contemporary honeybee stories |
 |
| Assorted Coleoptera in the University of Texas Insect Collection |
- Haraway, Donna J. Staying with the Trouble: Making Kin in the Chthulucene. Duke UP, 2016.
- —. When Species Meet. U of Minneapolis P, 2008.
- Heise, Ursula K. Imagining Extinctions: The Cultural Meanings of Endangered Species. U of Chicago P, 2016.
- Jørgensen, Dolly. Recovering Lost Species in the Modern Age: Histories of Longing and Belonging. MIT Press, 2019.
- Kolbert, Elizabeth. The Sixth Extinction: An Unnatural History. Bloomsbury, 2014.
- Puig de la Bellacasa, María. Matters of Care: Speculative Ethics in More Than Human Worlds. U of Minnesota P, 2017. Salazar Parreñas, Juno. Decolonizing Extinction: The Work of Care in Orangutan Rehabilitation. Duke UP, 2018
—————————–
This blog is written by Cabot Institute member Eline D. Tabak, PhD researcher in English (University of Bristol) and Environmental Humanities (BSU). This blog outlines her SWW DTP-funded project. You can follow Eline on twitter @elinetabak and see more of her writing and work at www.elinedtabak.com. This blog was reposted with kind permission from the Centre for Environmental Humanities. View the original blog.
 |
| Eline D. Tabak |
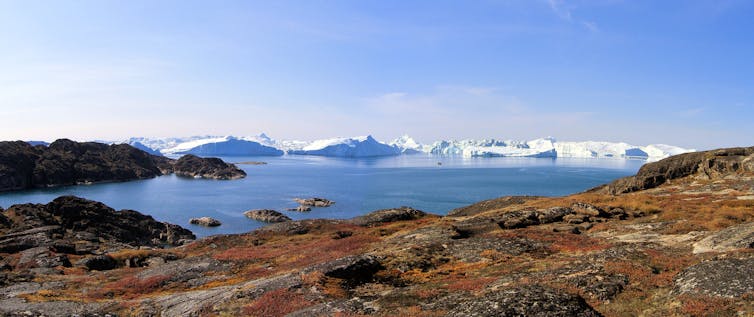
Greenland is melting: we need to worry about what’s happening on the largest island in the world
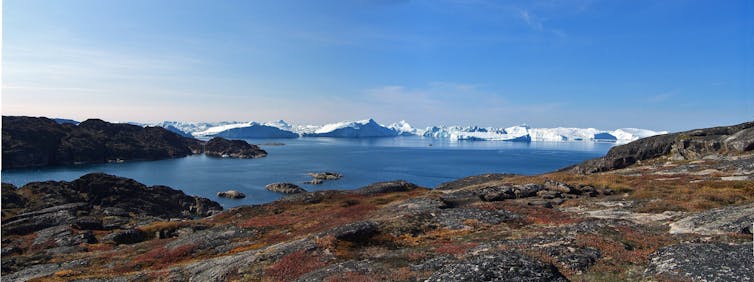
Greenland is the largest island in the world and on it rests the largest ice mass in the Northern Hemisphere. If all that ice melted, the sea would rise by more than 7 metres.
But that’s not going to happen is it? Well not any time soon, but understanding how much of the ice sheet might melt over the coming century is a critical and urgent question that scientists are trying to tackle using sophisticated numerical models of how the ice sheet interacts with the rest of the climate system. The problem is that the models aren’t that good at reproducing recent observations and are limited by our poor knowledge of the detailed topography of the subglacial terrain and fjords, which the ice flows over and in to.
One way around this problem is to see how the ice sheet responded to changes in climate in the past and compare that with model projections for the future for similar changes in temperature. That is exactly what colleagues and I did in a new study now published in the journal Nature Communications.
We looked at the three largest glaciers in Greenland and used historical aerial photographs combined with measurements scientists had taken directly over the years, to reconstruct how the volume of these glaciers had changed over the period 1880 to 2012. The approach is founded on the idea that the past can help inform the future, not just in science but in all aspects of life. But just like other “classes” of history, the climate and the Earth system in future won’t be a carbon copy of the past. Nonetheless, if we figure out exactly how sensitive the ice sheet has been to temperature changes over the past century, that can provide a useful guide to how it will respond over the next century.
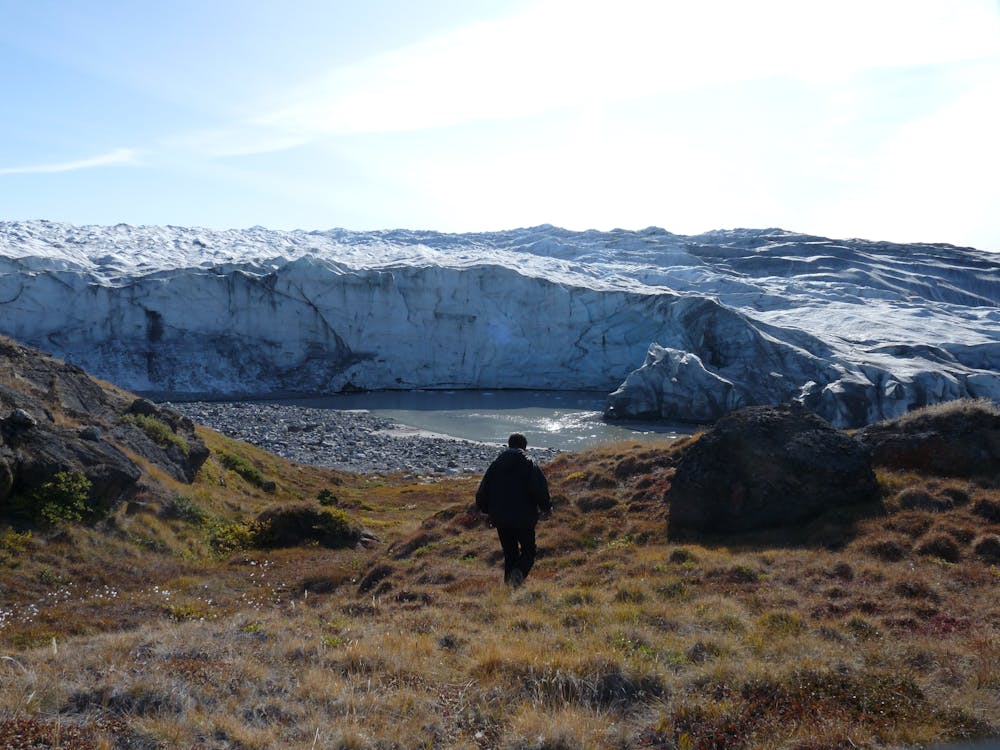
Jonathan Bamber, Author provided
We found that the three largest glaciers were responsible for 8.1mm of sea level rise, about 15% of the whole ice sheet’s contribution. Over the period of our study the sea globally has risen by around 20cm, about the height of an A5 booklet, and of that, about a finger’s width is entirely thanks to ice melting from those three Greenland glaciers.
Melting As Usual
So what does that tell us about the future behaviour of the ice sheet? In 2013, a modelling study by Faezeh Nick and colleagues also looked at the same “big three” glaciers (Jakobshavn Isbrae in the west of the island and Helheim and Kangerlussuaq in the east) and projected how they would respond in different future climate scenarios. The most extreme of these scenarios is called RCP8.5 and assumes that economic growth will continue unabated through the 21st century, resulting in a global mean warming of about 3.7˚C above today’s temperatures (about 4.8˚C above pre-industrial or since 1850).
This scenario has sometimes been referred to as Business As Usual (BAU) and there is an active debate among climate researchers regarding how plausible RCP8.5 is. It’s interesting to note, however, that, according to a recent study from a group of US scientists it may be the most appropriate scenario up to at least 2050. Because of something called polar amplification the Arctic will likely heat up by more than double the global average, with the climate models indicating around 8.3˚C warming over Greenland in the most extreme scenario, RCP8.5.
Despite this dramatic and terrifying hike in temperature Faezeh’s modelling study projected that the “big three” would contribute between 9 and 15 mm to sea level rise by 2100, only slightly more than what we obtained from a 1.5˚C warming over the 20th century. How can that be? Our conclusion is that the models are at fault, even including the latest and most sophisticated available which are being used to assess how the whole ice sheet will respond to the next century of climate change. These models appear to have a relatively weak link between climate change and ice melt, when our results suggest it is much stronger. Projections based on these models are therefore likely to under-predict how much the ice sheet will be affected. Other lines of evidence support this conclusion.
What does all of that mean? If we do continue along that very scary RCP8.5 trajectory of increasing greenhouse gas emissions, the Greenland ice sheet is very likely to start melting at rates that we haven’t seen for at least 130,000 years, with dire consequences for sea level and the many millions of people who live in low lying coastal zones.![]()
————————–
This blog is written by Cabot Institute member Jonathan Bamber, Professor of Physical Geography, University of Bristol. This article is republished from The Conversation under a Creative Commons license. Read the original article.
 |
| Professor Jonathan Bamber |
Is Europe heading for a more drought prone future?
 |
| Parched landscape of Europe during the 2018 drought. Image credit: NASA, CC0 |
In 2018, Europe was hit with one of the worst droughts so far in the 21st century in terms of its extent, severity and duration. This had large-scale effects on the vegetation, both agricultural and natural. Harvest yields were substantially reduced, by up to 40% in some regions, and widescale browning of vegetation occurred.
A consortium of international researchers, including members of the Atmospheric Chemistry Research Group (ACRG) at the University of Bristol, asked the question: given the major impacts on vegetation, which plays an essential role in removing carbon dioxide (CO2) from the air, was there an observable change in the amount of carbon uptake across Europe during this event?
There are at least two ways to quantify the impact that the drought had on the terrestrial carbon sink: a bottom-up or top-down approach. Our plans and timelines to mitigate climate change rely on using these methods to predict how much of anthropogenic greenhouse gas emissions can be taken up by the natural biosphere. Currently, the terrestrial carbon sink (i.e. vegetation and soils) takes up approximately a third of manmade emissions. The oceans take up about a similar amount. But this important carbon sink is subject to variation brought about by naturally occurring variation in the climate and manmade climate change.
To investigate the impact of the drought on the European terrestrial carbon sink, modellers can predict how individual processes that contribute to the terrestrial sink would respond to the climate during that period – a bottom-up approach. For example, a study by Bastos et al. (2019) compared the estimates of net ecosystem exchange during the drought period from 11 vegetation models. Net ecosystem exchange quantifies the amount of CO2 that is either taken up or released from the ecosystem and is usually quantified as a flux of CO2 to the atmosphere. This value is negative if the ecosystem is a sink and positive if it is a source of CO2 to the atmosphere. The consensus from previous studies was that an unusually sunny spring led to early vegetation growth, which depleted soil moisture, which intensified the drought during the summer period. Although more CO2 was taken up by the biosphere in spring, in some European regions, like Central Europe, the lack of rain during the summer months meant that the soils, already depleted in water, could not maintain the vegetation, and this led to CO2 losses from the ecosystem.
At the ACRG we use measurements of gases in the atmosphere, like CO2, to improve estimates of emissions and uptake of these gases using a top-down approach called inverse modelling. Measurements are obtained from carefully calibrated instruments that are part of global networks of measurement sites like AGAGE (Advanced Global Atmospheric Gases Experiment) and ICOS (Integrated Carbon Observation System). We also require initial estimates of the fluxes, which we obtain from several sources, including vegetation models and bottom-up inventories, and a model that describes atmospheric transport of the gas (a model that describes how a pocket of air will travel in the atmosphere). Using a statistical approach, we can then improve on those initial estimates to get better agreement between the modelled and observed concentrations at the measurement sites. With this method, we have to account for all sources of a gas, both anthropogenic and natural, as the concentration that is recorded at a measurement site is the sum of all contributions from all sources.
In a recent publication by Thompson et al. (2020), we compared the CO2 flux estimates for regions in Europe over the last ten years using the ACRG modelling method, along with four other approaches. The combined estimate from these five modelling systems indicated that the temperate region of Europe (i.e. Central Europe) was a small source of CO2 during 2018. This means that when carbon losses due to plant and soil respiration are compared with the carbon uptake by photosynthesis, then a small positive amount was emitted to the atmosphere on balance. This is described by a positive net flux of 0.09 ± 0.06 PgC y-1 (mean ± SD) to the atmosphere, compared with the mean of the last 10 years of -0.08 ± 0.17 PgC y-1, which is a net sink of carbon, meaning that over the last 10 years more carbon was taken up by photosynthesis than emitted through ecosystem respiration. Northern Europe was also found to be a small source in 2018. This publication was part of a special issue on the impacts of the 2018 drought on Europe.
So what does this tell us about how carbon uptake might change in the future? A 2018 study by Samaniego et al. considered future projections from climate models under different scenarios ranging from 1°C to 3°C global temperature rise. They concluded that soil moisture droughts were set to become 40% more likely by the end of the 21st century under the current 3°C future compared with 1.5°C set out in the Paris Climate Agreement. Droughts like the previous “Lucifer” event in 2003, where as many as 35,000 people lost their lives due to the effects of the drought, are expected to become twice as likely. Failing to reduce greenhouse gas emissions so that we mitigate the global temperature rise will impact on our ability to grow food and make killer drought events more likely. Our study shows that more frequent droughts will reduce the biosphere’s ability to take up our CO2 emissions due to the impact of a warmer climate on the soil and vegetation of key natural sinks, and lead to fundamental changes in the structure and species composition of these systems into the future. Unfortunately, this will further exacerbate the effects of climate change.
Bibliography
A. Bastos, P. Ciais, P. Friedlingstein, S. Sitch, J. Pongratz, L. Fan, J. P. Wigneron, U. Weber, M. Reichstein, Z. Fu, P. Anthoni, A. Arneth, V. Haverd, A. K. Jain, E. Joetzjer, J. Knauer, S. Lienert, T. Loughran, P. C. McGuire, H. Tian, N. Viovy, S. Zaehle. Direct and seasonal legacy effects of the 2018 heat wave and drought on European ecosystem productivity. Science Advances, 2020; 6 (24): eaba2724 DOI: 10.1126/sciadv.aba2724
M. Reuter, M. Buchwitz, M. Hilker, J. Heymann, H. Bovensmann, J.P. Burrows, S. Houweling, Y.Y. Liu, R. Nassar, F. Chevallier, P. Ciais, J. Marshall, M. Reichstein. How much CO2 is taken up by the European Terrestrial Biosphere? Bulletin of the American Meteorological Society, 2017; 98 (4): 665-671 DOI: 10.1175/BAMS-D-15-00310.1
L. Samaniego, S. Thober, R. Kumar, N. Wanders, O. Rakovec, M. Pan, M. Zink, J. Sheffield, E.F. Wood, A. Marx. Anthropogenic warming exacerbates European soil moisture droughts. Nature Climate Change, 2018; 8, 421-426 DOI: 10.1038/s41558-018-0138-5
R.L. Thompson, G. Broquet, C. Gerbig, T. Kock, M. Lang, G. Monteil, S. Munassar, A. Nickless, M. Scholze, M. Ramonet, U. Karstens, E. van Schaik, Z. Wu, C. Rödenbeck. Changes in net ecosystem exchange over Europe during the 2018 drought based on atmospheric observations. Philosophical Transactions of the Royal Society B, 2020; 375 (1810): 20190512 DOI: 10.1098/rstb.2019.0512
————————————-
This blog is written by Cabot Institute member Dr Alecia Nickless, a research associate in the School of Chemistry at the University of Bristol.
Capturing the value of community energy
Energise Sussex Coast and South East London Community Energy are set to benefit from a new business collaboration led by Colin Nolden and supported by PhD students Peter Thomas and Daniela Rossade. This is funded by the Economic and Social Research Council with match funding provided by Community Energy South from SGN. In total, £80,000 has been made available from the Economic and Social Research Council Impact Accelerator Account to launch six new Accelerating Business Collaborations involving the Universities of Bath, Exeter and Bristol. This funding aims to increase capacity and capability of early career researchers and PhD students to collaborate with the private sector. Match funding from SGN (formerly Scotia Gas Network) provided by Community Energy South for this particular project will free up time and allow Energise Sussex Coast and South East London Community Energy to provide the necessary company data and co-develop appropriate data analysis and management methodologies.
The Capturing the value of community energy project evolved out of the Bristol Poverty Institute (BPI) interdisciplinary webinar on Energy and Fuel Poverty and Sustainable Solutions on 14 May 2020. At this event Colin highlighted the difficulty of establishing self-sustaining fuel-poverty alleviation business models, despite huge savings on energy bills and invaluable support for some of the most marginalised segments of society. Peter also presented his PhD project, which investigates the energy needs and priorities of refugee communities. With the help of Ruth Welters from Research and Enterprise Development and Lauren Winch from BPI, Colin built up his team and concretised his project for this successful grant application.
The two business collaborators Energise Sussex Coast (ESC) and South East London Community Energy (SELCE) are non-profit social enterprises that seek to act co-operatively to tackle the climate crisis and energy injustice through community owned renewable energy and energy savings schemes. Both have won multiple awards for their approach to energy generation, energy saving and fuel poverty alleviation.

However, both are also highly dependent on grants from energy companies such as SGN with complicated and highly variable reporting procedures. This business collaboration will involve the analysis of their company data (eight years for ESC, ten years for SELCE) to take stock of what fuel poverty advice and energy saving action works and what does not, and to grasp any multiplier effects associated with engaging in renewable energy trading activities alongside more charitable fuel poverty alleviation work.
Benefits for ESC and SELCE include the co-production of a database to help them establish what has and has not worked in the past, and where to target their efforts moving forward. This is particularly relevant in the context of future fuel-poverty alleviation funding bids. With a better understanding of what works, they will be able to write better bids and target their advice more effectively, thus improving the efficiency of the sector more broadly.
It will also help identify new value streams, such as those resulting from lower energy bills. Rather than creating dependents, this provides the foundation for business model innovation through consortium building and economies of scale where possible, while improving targeted face-to-face advice where necessary. It will also explore socially distant approaches where face-to-face advice and engagement is no longer possible.
With a better understanding how and where value is created, ESC and SLECE, together with other non-profit enterprises, can establish a platform cooperative while creating self-renewing databases which enable more targeted energy saving and fuel poverty advice in future. Such data also facilitates application for larger pots of money such as Horizon2020, and the establishment of a fuel poverty ecosystem in partnership with local authorities and other organisations capable of empowering people instead of creating dependents. This additional reporting will capture a wider range of value and codify it to be submitted as written evidence to the Cabinet Office and Treasury at national level, while also acting as a dynamic database for inclusive economy institutions and community energy organisations at regional and local level.
People
Dr Colin Nolden is a Vice-Chancellor’s Fellow based on the Law School, University of Bristol, researching sustainable energy governance at the intersection of demand, mobility, communities, and climate change. Alongside his appointment at the University of Bristol, Colin works as a Researcher at the Environmental Change Institute, University of Oxford. He is also a non-executive director of Community Energy South and a member of the Cabot Institute for the Environment.
Peter Thomas is a University of Bristol Engineering PhD student and member of the Cabot Institute for the Environment investigating access to energy in humanitarian relief by combining insights from engineering, social sciences, and anthropology.
Daniela Rossade is a University of Bristol Engineering PhD student investigating the transition to renewable energy on the remote island of Saint Helena and the influence of renewable microgrids on electricity access and energy poverty.
Partner Companies
South East London Community Energy Ltd
Contact
For more information on the project contact: Dr Colin Nolden colin.nolden@bristol.ac.uk
——————————
This blog is written by Dr Colin Nolden, Vice-Chancellor’s Fellow, University of Bristol Law School and Cabot Institute for the Environment.
 |
| Colin Nolden |
Learning lessons from the past to inform the future
A fairly recent blog post on the EGU blog site reiterated the compelling comparison between the current COVID-19 crisis and the ongoing climate emergency, focusing on extreme events such as hurricanes, heatwaves and severe rainfall-related flooding, all of which are likely to get worse as the climate warms (Langendijk & Osman 2020). This comparison has been made by us Climate Scientists since the COVID-19 crisis began; both the virus and the disastrous impacts of anthropogenic climate change were (and indeed are) predictable but little was done in the ways of preparedness, both were (and are still being) underestimated by those in power despite warnings from science, and both are global in extent and therefore require united action. Another comparison is that both are being intensively, and urgently, researched across the world by many centres of excellence. We don’t have all the answers yet for either, but progress is being made on both.
When it comes to understanding our climate, there are several approaches; these are, of course, not mutually exclusive. We can focus on present-day climate variability, to understand the physical mechanisms behind our current climate; examples include, but are not limited to, ocean-atmosphere interactions, land-atmosphere feedbacks, or extreme events (see Williams et al. 2008, Williams & Kniveton 2012 or Williams et al. 2012, as well as work from many others).
Alternatively, we can use our current understanding of the physical mechanisms driving current climate to make projections of the future, either globally or regionally. State-of-the-art General Circulation Models (GCMs) can provide projections of future climate under various scenarios of socio-economic development, including but not limited to greenhouse gas (GHG) emissions (Williams 2017).
A third approach is to focus on climates during the deep (i.e. geological) past, using tools to determine past climate such as ice cores, tree rings and carbon dating. Unlike the historical period, which usually includes the past in which there are human observations or documents, the deep past usually refers to the prehistoric era and includes timescales ranging from thousands of years ago (ka) to millions of years ago (Ma). Understanding past climate changes and mechanisms is highly important in improving our projections of possible future climate change (e.g. Haywood et al. 2016, Otto-Bliesner et al. 2017, Kageyama et al. 2018, and many others).
One reason for looking at the deep past is that it provides an opportunity to use our GCMs to simulate climate scenarios very different to today, and compare these to scenarios based on past.
These days I am primarily focusing on the latter approach, and am involved in almost all of the palaeoclimate scenarios coming out of UK’s physical climate model, called HadGEM3-GC3.1. These focus on different times in the past, such as the mid-Holocene (MH, ~6 ka), the Last Glacial Maximum (LGM, ~26.5 ka), the Last Interglacial (LIG, ~127 ka), the mid-Pliocene Warm Period (Pliocene, ~3.3 Ma) and the Early Eocene Climate Optimum / Paleocene-Eocene Thermal Maximum (EECO / PETM, collectively referred to here as the Eocene, ~50-55 Ma). All of these have been (or are being) conducted under the auspices of the 6th phase of the Coupled Modelling Intercomparison Project (CMIP6) and 4th phase of the Palaeoclimate Modelling Intercomparison Project (PMIP4).
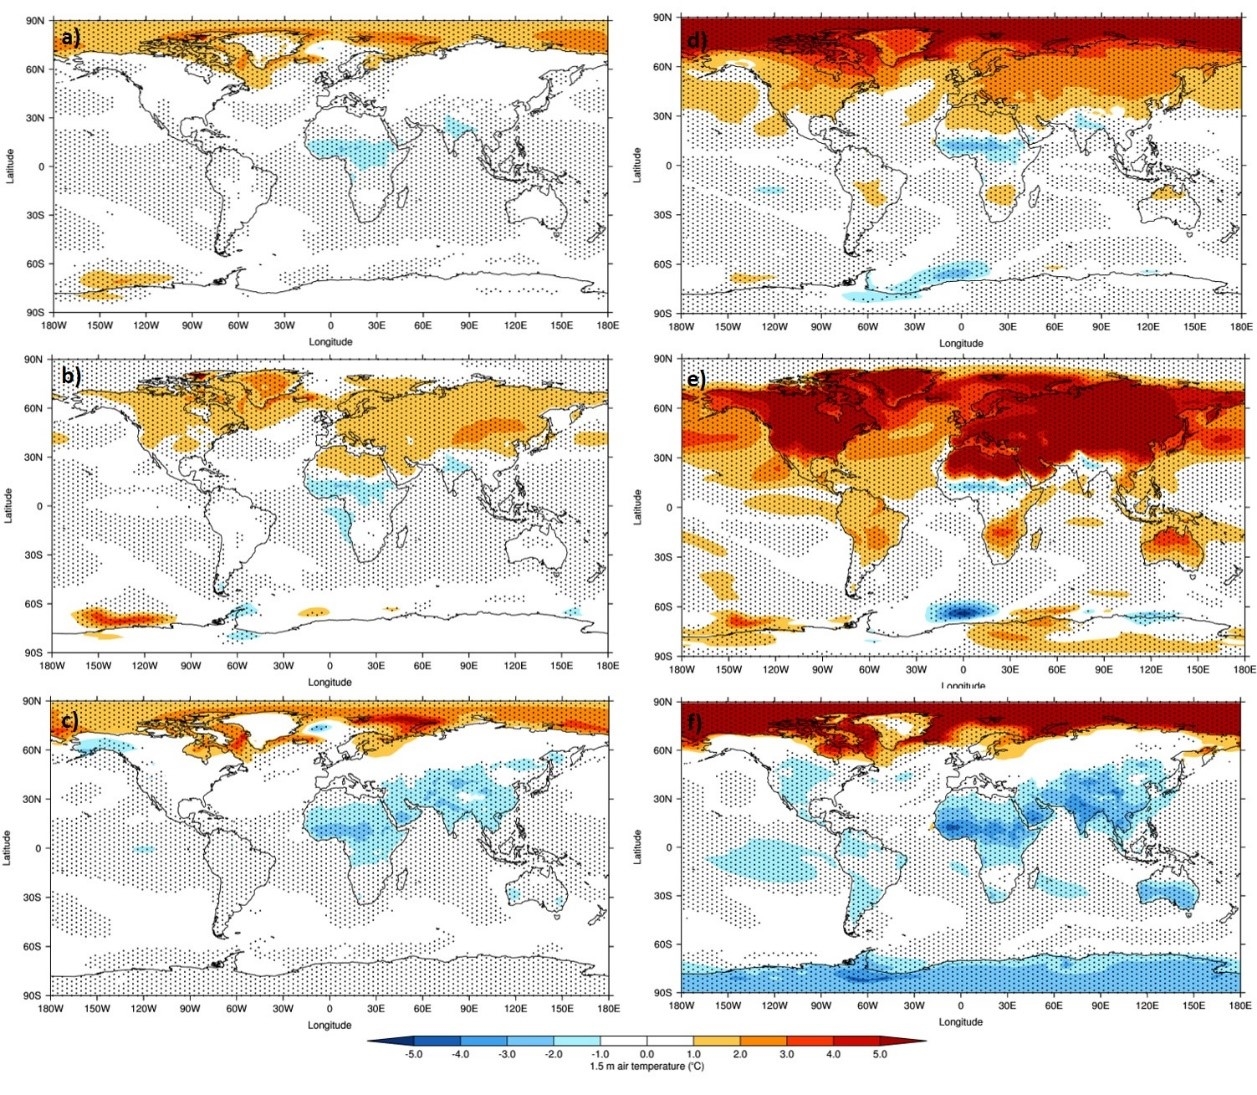 |
| Figure 1: Calendar adjusted 1.5 m air temperature climatology differences, mid-Holocene and last interglacial simulations from the UK’s physical climate model, relative to the preindustrial era: a-c) mid Holocene – preindustrial; d-f) last interglacial – preindustrial. Top row: Annual; Middle row: Northern Hemisphere summer (June-August); Bottom row: Northern Hemisphere winter (December-February). Stippling shows statistical significance (as calculated by a Student’s T-test) at the 99% level. Taken from Williams et al. (2020). |
These five periods are of particular interest to the above projects for a number of different reasons. Before these are discussed, however, the fundamentals of deep past climate change need to be briefly introduced. In short, climate changes in the geological past (i.e. without human influence) can either be internal to the planet (e.g. volcanic eruptions, oceanic CO2 release) or external to the planet (e.g. changes in the Earth’s orbit around the Sun). Arguably, it is changes to the amount of incoming solar radiation (known as insolation) that is the primary driver behind all long-term climate change. Theories for long-term climate change, such as the beginning and ending of ice ages, began to be proposed during the 1800s. However, it wasn’t until 1913 that the Serbian mathematician, Milutin Milankovitch, developed our modern day understanding of glacial cycles. In short, Milankovitch identified three interacting cycles concerning the Earth’s position relative to the Sun: a) Eccentricity, in which the Earth’s orbit around the Sun changes from being more or less circular on a period of 100-400 ka; b) Obliquity, in which the Earth’s axis changes from being more or less tilted towards the Sun on a period of ~41 ka; and c) Precession, in which the Earth’s polar regions appear to ‘wobble’ around the axis (like a spinning top coming to its end) on a period of ~19-24 ka. All of these three cycles not only change the overall amount of insolation received by the planet, and therefore its average temperature, but also where the most energy is received; this ultimately determines the strength and timing of our seasons.
With this background in mind, and returning to the paleoclimate scenarios mentioned above, the MH and the LIG collectively represent a ‘warm climate’ state. During these periods the Earth’s axis was tilted slightly more towards the Sun, resulting in an increase in Northern Hemisphere insolation (because of the larger landmasses here relative to the Southern Hemisphere). This caused much warmer Northern Hemisphere summers and enhanced African, Asian and South American monsoons (Kageyama et al. 2018). The increase in temperatures can be seen in Figure 1, where clearly the largest increases relative to the preindustrial era (PI) are in the Northern Hemisphere during June-August (Williams et al. 2020). By comparing model simulations to palaeoclimate reconstructions during these periods, the models’ ability to simulate these climates can be tested and this therefore assesses our confidence in future projections of climate change; which, as mentioned above, may result in more rainfall extremes and enhanced monsoons.
In contrast, the LGM represents a ‘cold climate’ state which, although unlikely to return as a result of increasing anthropogenic GHG emissions, nevertheless provides a well-documented climatic period during which to test the models. Going back further in time, the Pliocene is the most recent time in the geological past when CO2 levels were roughly equivalent to today, and was a time when global annual mean temperatures were 1.8-3.6°C higher than today (Haywood et al. 2016). See Figure 2 for the increases in sea surface temperature (SST) during the Pliocene, relative to today. This annual mean temperature increase is clearly much higher than the current target, as specified by the Paris Agreement, of keeping warming below 1.5°C (at most 2°C) by the end of 2100. Importantly, the CO2 increases and subsequent warming during the Pliocene occurred over timescales of thousands to millions of years, whereas anthropogenic GHG emissions have caused a similar increase in CO2 (from ~280 parts per million (ppmv) during the PI to just over 400 ppmv today) in under 300 years. The Pliocene, therefore, provides an excellent analogy for what our climate might be like in the (possibly near) future.
Finally, going back even further, the Eocene is the most recent time in the past that was characterised by very high CO2 concentrations, twice or more than that of today at >800-1000 ppmv; this resulted in temperatures ~5°C higher than today in the tropics and ~20°C higher than today at high latitudes (Lunt et al. 2012, Lunt et al. 2017). The reason the Eocene is highly relevant, and of concern, is that these CO2 concentrations are roughly equivalent to those projected to occur by the end of 2100, if the Representative Concentration Pathway (RCP) 8.5 scenario, also known as the ‘Business-as-usual’ scenario, which was used in the most recent IPCC report (IPCC 2014), becomes reality. The Eocene, therefore, provides an excellent albeit concerning analogy for what the worse-case scenario could be like in the future, if action is not taken.
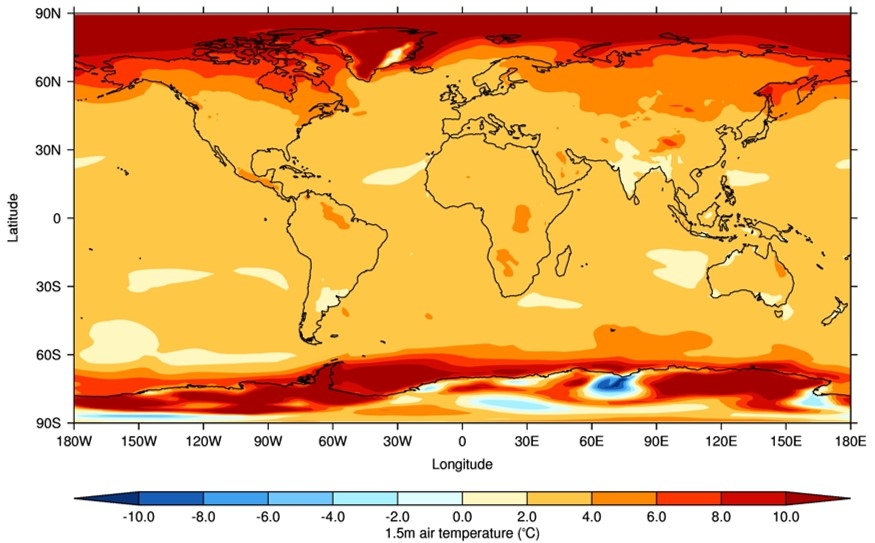 |
| Figure 2: 1.5 m air temperature climatology differences, Pliocene simulation from the UK’s physical climate model, relative to the preindustrial era. |
Understanding the climate, how it has changed in the past and how it might change in the future is a complex task and subject to various interrelated approaches. One of these approaches, the concept of using the past to inform the future (e.g. Braconnot et al. 2011), has been described here. Just like in the case of COVID-19, it is our responsibility as Climate Scientists to work together across approaches and disciplines, as well as reliably communicating the science to governments, policymakers and the general public, in order to mitigate the crisis as much as possible.
References
Braconnot, P., Harrison, S. P., Otto-Bliesner, B, et al. (2011). ‘The palaeoclimate modelling intercomparison project contribution to CMIP5’. CLIVAR Exchanges Newsletter. 56: 15-19
Haywood, A. M., Dowsett, H. J., Dolan, A. M. et al. (2016). ‘The Pliocene Model Intercomparison Project (PlioMIP) Phase 2: scientific objectives and experimental design’. Climate of the Past. 12: 663-675
IPCC (2014). ‘Climate Change 2014: Synthesis Report. Contribution of Working Groups I, II and III to the Fifth Assessment Report of the Intergovernmental Panel on Climate Change’ [Core Writing Team, R.K. Pachauri and L.A. Meyer (eds.)]. IPCC. Geneva, Switzerland, 151 pp
Kageyama, M., Braconnot, P., Harrison, S. P. et al. (2018). ‘The PMIP4 contribution to CMIP6 – Part 1: Overview and over-arching analysis plan’. Geoscientific Model Development. 11: 1033-1057
Langendijk, G. S. & Osman, M. (2020). ‘Hurricane COVID-19: What can COVID-19 tell us about tackling climate change?’. EGU Blogs: Climate. https://blogs.egu.eu/divisions/cl/2020/04/16/corona-2/. Accessed 24/7/20
Lunt, D. J., Dunkley-Jones, T., Heinemann, M. et al. (2012). ‘A model–data comparison for a multi-model ensemble of early Eocene atmosphere–ocean simulations: EoMIP’. Climate of the Past. 8: 1717-1736
Lunt, D. J., Huber, M., Anagnostou, E. et al. (2017). ‘The DeepMIP contribution to PMIP4: experimental design for model simulations of the EECO, PETM, and pre-PETM (version 1.0)’. Geoscientific Model Development. 10: 889-901
Otto-Bliesner, B. L., Braconnot, P., Harrison, S. P. et al. (2017). ‘The PMIP4 contribution to CMIP6 – Part 2: Two interglacials, scientific objective and experimental design for Holocene and Last Interglacial simulations’. Geoscientific Model Development. 10: 3979-4003
Williams, C. J. R., Kniveton, D. R. & Layberry, R. (2008). ‘Influence of South Atlantic sea surface temperatures on rainfall variability and extremes over southern Africa’. Journal of Climate. 21: 6498-6520
Williams, C. J. R., Allan, R. P. & Kniveton, D. R. (2012). ‘Diagnosing atmosphere-land feedbacks in CMIP5 climate models’. Environmental Research Letters. 7 (4)
Williams, C. J. R. & Kniveton, D. R. (2012). ‘Atmosphere-land surface interactions and their influence on extreme rainfall and potential abrupt climate change over southern Africa’. Climatic Change. 112 (3-4): 981-996
Williams, C. J. R. (2017). ‘Climate change in Chile: an analysis of state-of-the-art observations, satellite-derived estimates and climate model simulations’. Journal of Earth Science & Climatic Change. 8 (5): 1-11
Williams, C. J. R., Guarino, M-V., Capron, E. (2020). ‘CMIP6/PMIP4 simulations of the mid-Holocene and Last Interglacial using HadGEM3: comparison to the pre-industrial era, previous model versions, and proxy data’. Climate of the Past. Accepted
——————————–
This blog was written by Cabot Institute member Dr Charles Williams, a climate scientist within the School of Geographical Sciences, University of Bristol. His research focusses on deep time to understand how climate has behaved in the warmer worlds experienced during the early Eocene and mid-Pliocene (ca. 50 – 3 Mio years ago). This blog was reposted with kind permission from Charles. View the original blog on the EGU blog site.
 |
| Dr Charles Williams |
Energy use and demand in a (post) COVID-19 world

It seems the COVID-19 crisis may be a good time to evaluate our energy usage, especially since we assume that we are using less energy because we’re not all doing/consuming as much. We brought together a bunch of our researchers from different disciplines across the University of Bristol to have a group think about how we might change our energy usage and demand during and post COVID-19. Here’s a summary of what was discussed.
Has COVID-19 reduced our energy supply and demand?
John Brenton, the University of Bristol’s Sustainability Manager spoke on the University’s experience during lockdown. During this COVID-19 crisis so far, UK electricity consumption has fallen by 19% and this percentage reduction has also been seen at the University of Bristol too. Thing is, when there is reduced demand for electricity, fossil fuels become cheaper. It makes us ask the question, could this be a disincentive to investing in renewables? John also pointed out that COVID-19 has shrunk further an already shrinking energy market (which was already shrinking due to energy saving).
Even though electricity consumption has gone down by almost 20%, we are still emitting greenhouse gases, though not so much from our commute to school and work, but with the data we are using, now that a lot of us are home all day. Professor Chris Preist, Professor of Sustainability & Computer Systems, Department of Computer Science, said if we continue to embrace these new ways of working, we are going to replace the traffic jam with the data centre. Of global emissions today, 2% to 3% are made up through input of digital technology. Though the direct emissions of Information and Communications Technology (ICT) are an issue and need to be addressed, they have a different impact than aviation. Digital tech is more egalitarian and a little technology is used by more people, than the much fewer privileged people who fly for example.
The systemic changes in society to homeworking can also increase our emissions far more than the digital tech itself, for example, people tend to live further away from work if they are allowed to work from home. Who needs to live in the city when you don’t have an office any more or you don’t have to come in to work very often? You may as well live where you want. You could even live abroad, but those few times you may need to come into the office, you would be travelling further and if abroad you may still have to fly in which would mean that your emissions would be huge, even though you are no longer commuting all year.
Are there positive changes and how might these be continued post-COVID-19?
We are video conferencing so much more, in fact Netflix agreed to reduce the resolution of their programmes in order to provide more capacity for home working and the ensuing video calls. But how does videoconferencing compare to our cars? One hour of video conferencing is equivalent to driving 500 metres in your car.
COVID-19 has also shown that a dramatic change in policy can be rapidly put in place, so this can be relevant in replicating for rolling out sustainability and energy initiatives.
What are the implications for social justice?
Although many politicians are calling for a green recovery, which is positive, none of the current policies incorporate a just transition. A just transition would include job guarantee schemes and a rapid investment into green infrastructure as well as social justice and equity. A just transition would also account for the fact that not everyone can work from home, not everyone has a comfortable home to work in or the technology required to do so.
So what do we need to consider? Caroline Bird, who studies the cross-sectoral issues of environmental sustainability and energy in the Department of Computer Science, said that homeworking doesn’t work for everyone and often doesn’t work for the poorly paid. It doesn’t work well for the most vulnerable or least resilient in our society and community support is often needed here. We need to consider how we will educate everyone for a low carbon future. The government needs to take up the mantle and lead and pay for this. Policy change is possible, but we need to consider loss of interest and changing messages from the government that can lead to confusion.
We also need to consider rapid action to reduce the impact of COVID-19 and rapid action to reduce economic harm. But this is where the justice side of things is not well considered.
Can we imagine radical transformations as we emerge from lockdown?
For example, how did the fridge freezer in our kitchen become normal? Because of the fridge freezer, it changed the design of our kitchens, we changed how we shopped, moving from small and regular local shopping trips to big weekly shops at supermarkets, all because we could store more fresh food. This drove us to embrace cars much more, as we needed the boot space to transport our fresh goods home and supermarkets were placed outside of local shopping areas so cars were needed to access them. All this together moves to the ‘normality’.
So then, what radical transformations have occurred during the COVID-19 pandemic? We’ve seen more of us move to homeworking, with face to face interactions taking place via video call. Our food distribution systems have changed somewhat away from going regularly to the supermarket or dining out to buying produce online and receiving deliveries, and embracing takeaway culture much more. In a relatively short period of time we have re-imagined how to work and made it happen. However, the material infrastructure and cultural and social elements still need to evolve and change (which includes how the changes might affect our mental health, how we discipline our time at home, etc).
Caroline said that there are lots of other things we could be doing to decarbonise our energy use during and post-COVID-19, such as:
- Creating good staff with good knowledge. To do that we need to support their mental health, give them education and development opportunities, and strengthen the fragility of the supply chain they might work in.
- Educating everyone about low carbon and energy efficiency. To do this we need to consider what skills are needed, which of those are transferable, which skills will take more time to develop and what training programmes are needed for individuals.
- Developing policies which don’t allow resistance from developers, or poor workmanship of properties, which can have co-benefits to health and social justice. A better planned housing estate, home and national infrastructure will improve social justice and energy savings enormously.
Follow the speakers on Twitter:
 |
| Amanda Woodman-Hardy |
Siberia heatwave: why the Arctic is warming so much faster than the rest of the world
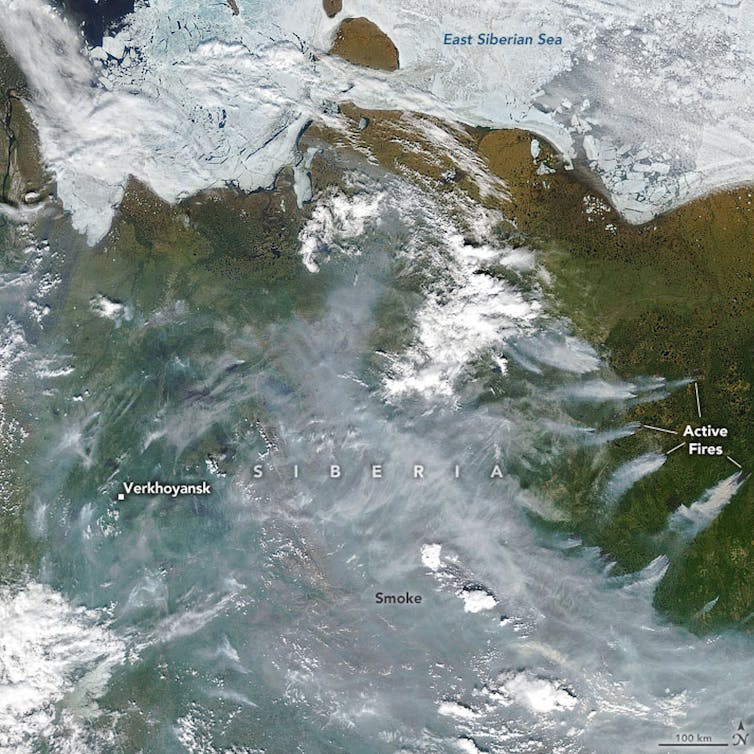
EPA-EFE/NASA
On the eve of the summer solstice, something very worrying happened in the Arctic Circle. For the first time in recorded history, temperatures reached 38°C (101°F) in a remote Siberian town – 18°C warmer than the maximum daily average for June in this part of the world, and the all-time temperature record for the region.
New records are being set every year, and not just for maximum temperatures, but for melting ice and wildfires too. That’s because air temperatures across the Arctic have been increasing at a rate that is about twice the global average.
All that heat has consequences. Siberia’s recent heatwave, and high summer temperatures in previous years, have been accelerating the melting of Arctic permafrost. This is the permanently frozen ground which has a thin surface layer that melts and refreezes each year. As temperatures rise, the surface layer gets deeper and structures embedded in it start to fail as the ground beneath them expands and contracts. This is what is partly to blame for the catastrophic oil spill that occurred in Siberia in June 2020, when a fuel reservoir collapsed and released more than 21,000 tonnes of fuel – the largest ever spill in the Arctic.
So what is wrong with the Arctic, and why does climate change here seem so much more severe compared to the rest of the world?
The warming models predicted
Scientists have developed models of the global climate system, called general circulation models, or GCMs for short, that reproduce the major patterns seen in weather observations. This helps us track and predict the behaviour of climate phenomena such as the Indian monsoon, El Niño, Southern Oscillations and ocean circulation such as the gulf stream.
GCMs have been used to project changes to the climate in a world with more atmospheric CO₂ since the 1990s. A common feature of these models is an effect called polar amplification. This is where warming is intensified in the polar regions and especially in the Arctic. The amplification can be between two and two and a half, meaning that for every degree of global warming, the Arctic will see double or more. This is a robust feature of our climate models, but why does it happen?
Fresh snow is the brightest natural surface on the planet. It has an albedo of about 0.85, which means that 85% of solar radiation falling on it is reflected back out to space. The ocean is the opposite – it’s the darkest natural surface on the planet and reflects just 10% of radiation (it has an albedo of 0.1). In winter, the Arctic Ocean, which covers the North Pole, is covered in sea ice and that sea ice has an insulating layer of snow on it. It’s like a huge, bright thermal blanket protecting the dark ocean underneath. As temperatures rise in spring, sea ice melts, exposing the dark ocean underneath, which absorbs even more solar radiation, increasing warming of the region, which melts even more ice. This is a positive feedback loop which is often referred to as the ice-albedo feedback mechanism.
Jonathan Bamber, Author provided
This ice-albedo (really snow-albedo) feedback is particular potent in the Arctic because the Arctic Ocean is almost landlocked by Eurasia and North America, and it’s less easy (compared to the Antarctic) for ocean currents to move the sea ice around and out of the region. As a result, sea ice that stays in the Arctic for longer than a year has been declining at a rate of about 13% per decade since satellite records began in the late 1970s.
In fact, there is evidence to indicate that sea ice extent has not been this low for at least the last 1,500 years. Extreme melt events over the Greenland Ice Sheet, that used to occur once in every 150 years, have been seen in 2012 and now 2019. Ice core data shows that the enhanced surface melting on the ice sheet over the past decade is unprecedented over the past three and a half centuries and potentially over the past 7,000 years.
In other words, the record-breaking temperatures seen this summer in the Arctic are not a “one-off”. They are part of a long-term trend that was predicted by climate models decades ago. Today, we’re seeing the results, with permafrost thaw and sea ice and ice sheet melting. The Arctic has sometimes been described as the canary in the coal mine for climate breakdown. Well it’s singing pretty loudly right now and it will get louder and louder in years to come.![]()
——————————-
This blog is written by Cabot Institute member Jonathan Bamber, Professor of Physical Geography, University of Bristol. This article is republished from The Conversation under a Creative Commons license. Read the original article.
 |
| Professor Jonathan Bamber |