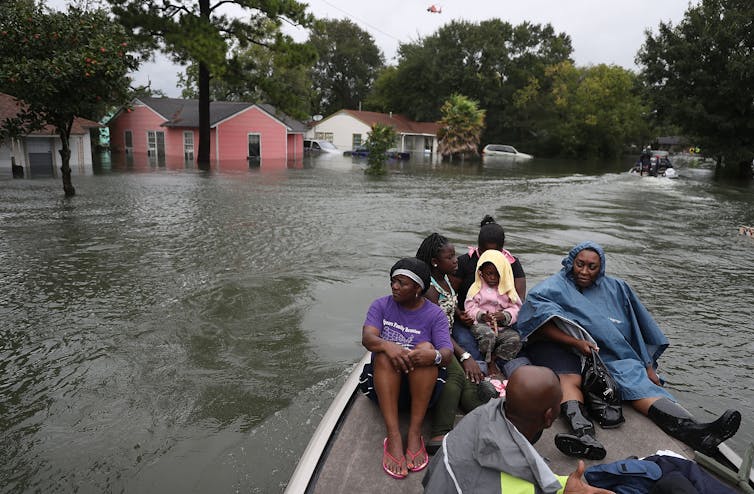
Canada’s flood havoc after summer heatwave shows how climate disasters combine to do extra damage

People living in British Columbia will feel like they have had more than their fair share of climate disasters in 2021. After a record-breaking heatwave in June, the state in western Canada has been inundated by intense rain storms in November. It’s also likely the long-lasting effects of the heatwave made the results of the recent rainfall worse, causing more landslides – which have destroyed highways and railroads – than would otherwise have happened.

In June 2021, temperature records across western North America were shattered. The town of Lytton in British Columbia registered 49.6°C, breaking the previous Canadian national record by 5°C. The unprecedented weather was caused by a high pressure system, a so-called “heat dome”, which sat over the region for several days.

Heat intensified within the dome as the high pressure compressed the air. Dry ground conditions forced temperatures even higher, as there was less water evaporating to cool things down. Although unconfirmed, it’s estimated that the heatwave caused over 400 deaths in British Columbia alone.

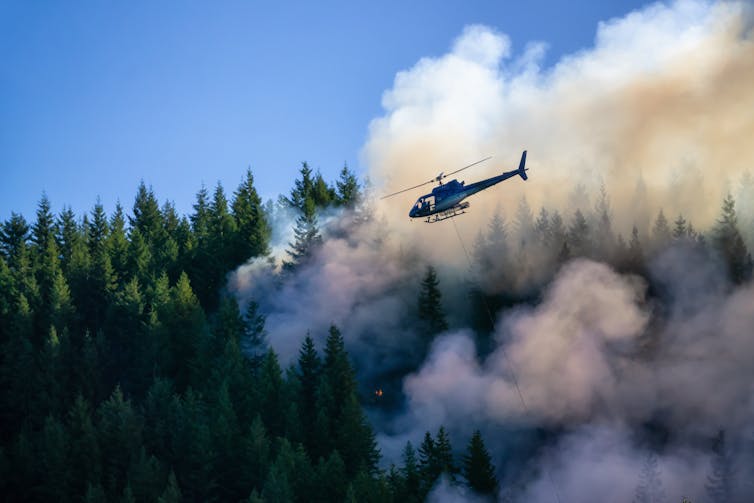
A helicopter flies over a burning pine forest beneath a blue sky.
Wildfires ravaged British Columbia during the hot and dry summer of 2021.
EB Adventure Photography/Shutterstock

The hot and dry weather also sparked wildfires. Just days after recording the hottest national temperature ever, the town of Lytton burned to the ground. The summer’s fires and drought left the ground charred and barren, incapable of absorbing water. These conditions make landslides more likely, as damaged tree roots can no longer hold soil in place. It also ensures water flows over the soil quicker, as it cannot soak into the baked ground.

The huge rain storm which lasted from Saturday November 13 to Monday 15 was caused by an atmospheric river – a long, narrow, band of moisture in the atmosphere stretching hundreds of miles. When this band travels over land it can generate extreme rainfall, and it did: in 48 hours, over 250mm of rain fell in the town of Hope, 100km east of Vancouver.

This much rainfall on its own would probably cause extensive flooding. But combined with the parched soil, the results have been catastrophic. Landslides have destroyed many of the region’s transport links, leaving Vancouver cut off by rail and road. But the bad news doesn’t end there; sediment washed away by these floods could make future floods this winter even worse.

British Columbia is in the grip of what scientists call a compound climate disaster. The effects of one extreme weather event, like a heatwave, amplify the effects of the next one, like a rain storm. Instead of seeing floods and wildfires as discrete events, compound disasters force us to comprehend the cascading crises which are likely to multiply as the planet warms.

How to understand compound climate disasters

The port of Vancouver is the busiest in Canada, moving US$550 million worth of cargo every day. Because rail links are damaged, ships laden with commodities sit offshore. Canada’s mining and farming industries are having to divert exports through the US. Depending on how quickly the rail links recover, significant economic impacts are possible.

Both the June heatwave and the November rainstorm are unprecedented, record-breaking events, but is their occurrence in the same year just bad luck? A rapid attribution study found that the heatwave was virtually impossible without climate change. The atmospheric river which brought the deluge is also likely to become more common and intense in a warming climate.

In British Columbia, future flooding is almost guaranteed to be more frequent and severe. This is life at 1.2°C above the pre-industrial temperature average, yet most politicians don’t seem too worried about taking the necessary action to prevent warming beyond 1.5°C – the limit which countries agreed in 2015 is a threshold beyond which catastrophic climate change becomes more likely.

Western Canada’s year of weather extremes did not come from nowhere. Past trends and future projections tell us to expect hotter summers and wetter winters in this part of the world, and record-shattering climate extremes are on the rise.

Worldwide, compound climate disasters are becoming more common as climate change accelerates. Risk assessments typically measure the impacts of one event at a time, like the damage caused by intense rain storms, without considering how the earlier drought influenced it. This leads to scientists and insurers underestimating the overall damage. With so many combinations of climate extremes – flooding following wildfires, hurricanes passing as cold spells arrive – we must prepare for every possibility.The Conversation

————————-

This blog is written by Cabot Institute for the Environment member Dr Vikki Thompson, Senior Research Associate in Geographical Sciences, University of Bristol.

This article is republished from The Conversation under a Creative Commons license. Read the original article.

Vikki Thompson

#CabotNext10 Spotlight on Water


Dr Katerina Michaelides

In conversation with Dr Katerina Michaelides, co-theme lead at the Cabot Institute

Why did you choose to become a theme leader at Cabot Institute?

I was particularly attracted to this role because I am strongly committed to increasing the visibility of the great water-related work going on in the University, and because I feel strongly about developing the water research community within Bristol and further afield. Over the years since its creation, Cabot Institute has been instrumental in developing my connections with others within the University, in fostering new collaborations and in encouraging new and creative avenues of research. In that same spirit, I relished the opportunity to perform a similar role within the Cabot Water theme and give back to the community by helping to foster collaborations, contacts, and new avenues of research. I believe in the Cabot mission and ethos and felt that I can help strengthen the Water theme in this more formal role.

In your opinion, what is one of the biggest global challenges associated with your theme? (Feel free to name others if there is more than one)

One of the biggest impacts of climate change is on the water cycle. In fact, climate change can be thought of as synonymous with changes in the water cycle with far reaching implications for lives and livelihoods. Think catastrophic storms, droughts, floods, declining water quality. Water is such a fundamental part of life that many in the global north take for granted. So if I was to say one biggest challenge, I would say: addressing global water scarcity and food insecurity challenges under climate change and anthropogenic pressures. There are of course, many other challenges….

Across the portfolio of projects in your theme, what type of institutions are you working with? (For example, governments, NGO’s)

Our theme members work with a huge range of non-academic institutions – from insurance companies, charities, climate services providers, NGOs, local businesses among others.

What disciplines are currently represented within your theme?

We have a broad set of disciplines within the Water theme. These range from water and sanitation, climate impacts on water balance, flood risk and hazard modelling, flooding and infrastructure resilience, freshwater biogeochemistry (water quality), hydrometeorology, dryland hydrology, tropical hydrology, hydrological modelling, forecasting floods and droughts, water, and humanities. And much more!

In your opinion, why is it important to highlight interdisciplinary research both in general and here at Bristol?

Global challenges related to water and climate impacts are inherently multi- and interdisciplinary in their nature. It starts from understanding how climate is changing, to how these changes impact the water balance on the ground hydrology) and may lead to destructive floods or devastating droughts through their effect on agriculture and drinking water. Ultimately, because water intersects society on so many different levels (from natural disasters, to agriculture, to water resources, to droughts) research needs to be interdisciplinary and consider both environmental and social aspects of the problem.

Are there any projects which are currently underway in your theme which are interdisciplinary that you believe should be highlighted in this campaign?

There are lots of interdisciplinary projects across the Water theme. Personally, our research focusses on water scarcity, as highlighted by these two projects below:

Drought Resilience in East African dryland Regions (DRIER) – This is a collaboration between hydrologists, climatologists, social scientists, livelihoods experts, climate adaptation experts. Awarded a Royal Society Grant of £500K for 2020-2023, with Bristol leading and colleagues from Cardiff, UEA, University of Nairobi, and Addis Ababa University. DRIER has been selected as case study for the Royal Society Challenge-Led grant scheme and by BEIS for the GCRF.

Mobile App Development for Drought Adaptation in Drylands (MADDAD) – This interdisciplinary project between hydrologists and computer scientists, funded by a GCRF Translational Award (2019-2021) is developing a mobile phone app to deliver water status forecasts to remote communities in Kenyan drylands. Under climate change droughts are set to become more intense and frequent and there is a pressing need for relevant, timely, and practical information about water resources, particularly with a view to climate change adaptation. However, rural agro-pastoral populations are sparse and distant from decision-making centres making it hugely challenging to disseminate useable information in a timely manner. The provision of a mobile phone app has the potential to transform decision-making and drought adaptation for a large number of people in remote, rural dryland regions of East Africa that currently do not have access to useable and relevant information about the short- and long-term changes in water scarcity in their location.

Down2Earth – Translation of climate information into multilevel decision support for social adaptation, policy development, and resilience to water scarcity in the Horn of Africa Drylands. Awarded an EU H2020 Grant of €6.7M for 2020-2024, with Cardiff University as the lead Institution and ~€1M to University of Bristol. In total, 15 Institutions across UK, EU, East Africa, are involved, including many non-academic actors. This project is completely multi-disciplinary in nature.

For more information, visit Water.

Fracking and poorer surface water quality link established

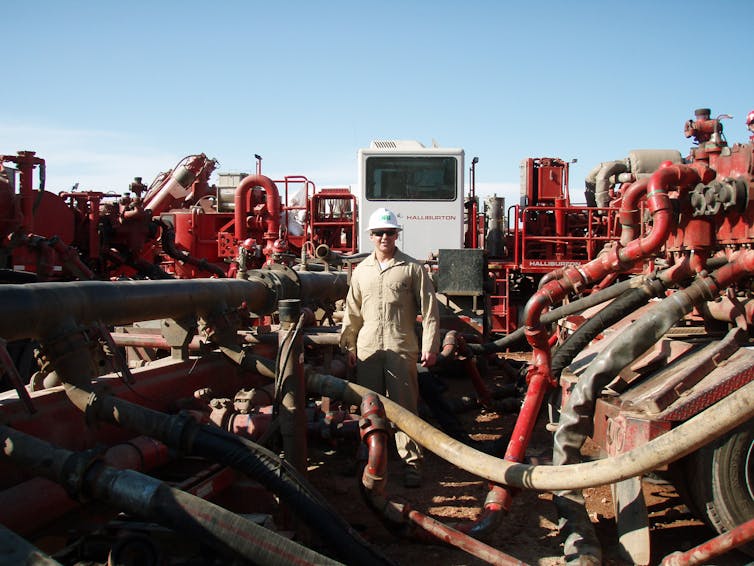
During fracking, water is mixed with fluids and injected into the ground.
Wikimedia Commons

Fracking – hailed by some as the greatest recent advance in energy production, criticised by others for the threat it poses to local life – continues to divide opinion.

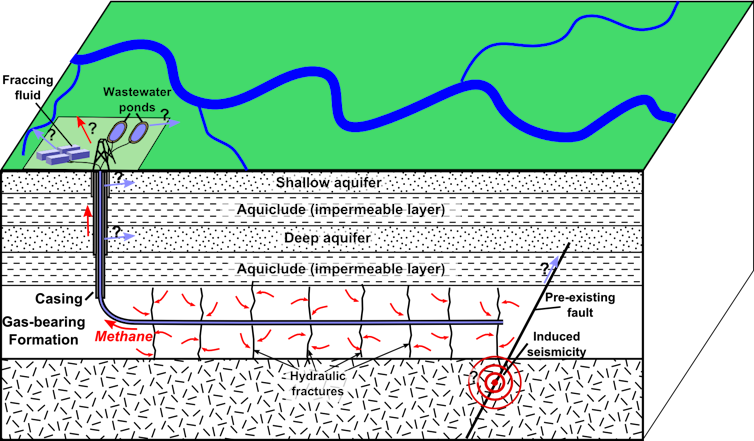
The term fracking refers to the high-pressure injection of water mixed with fluid chemical additives – including friction reducers, gels and acids – and “propping agents” such as sand to create fractures in deep rock formations such as shale, allowing oil or gas to flow out.

Tens of thousands of hydraulic fracturing wells have been drilled across the US, generating huge benefits for its energy industry and economy: yet the practice remains globally controversial. It is not permitted in numerous other countries, such as France, Germany, Ireland and, since 2019, the UK.

While some see fracking as the most important change in the energy sector since the introduction of nuclear energy more than 50 years ago, others raise health and environmental concerns: in particular, the threat fracking could pose to our water.

A fracking diagram
Fracking works by injecting fluid into cracks in the earth to extract oil or gas.
Wikimedia

Starting in 2010, many US states began to regulate fracking, obliging operators to disclose the substances used in their fluid mix. As economists, we were curious to see whether mandatory disclosures of what’s in fracturing fluids made the practice cleaner, or reduced potential water contamination.

To do that, we needed to compare the environmental impact from fracking before and after the new disclosure rules. We assembled a database that put together existing measurements of surface water quality with the location of fracking wells, and analysed changes in surface water quality around new wells over an 11-year period.

We noticed some strong associations, but also discovered that these associations had not been previously documented. Deciding to study the link between new hydraulic fracturing wells and surface water quality, we were able to provide evidence for a relationship between the two.

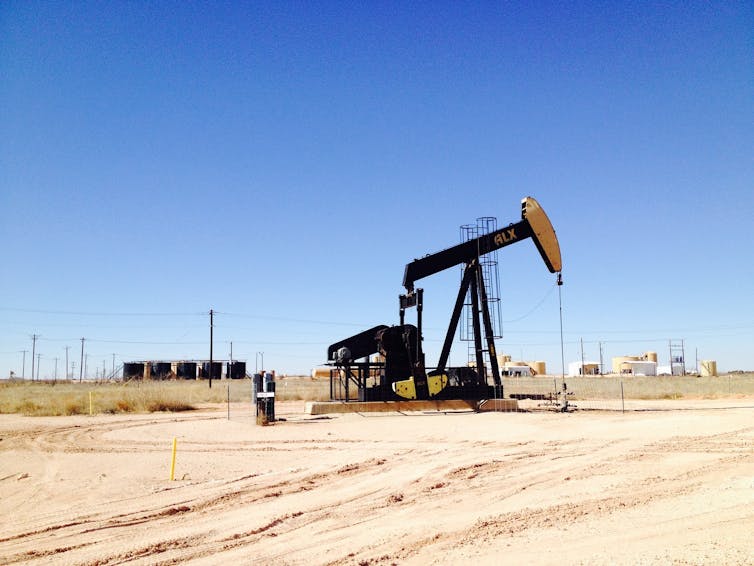
Equipment used for fracking
A fracking platform designed to extract oil.
Jwigley/Pixabay, CC BY

The link

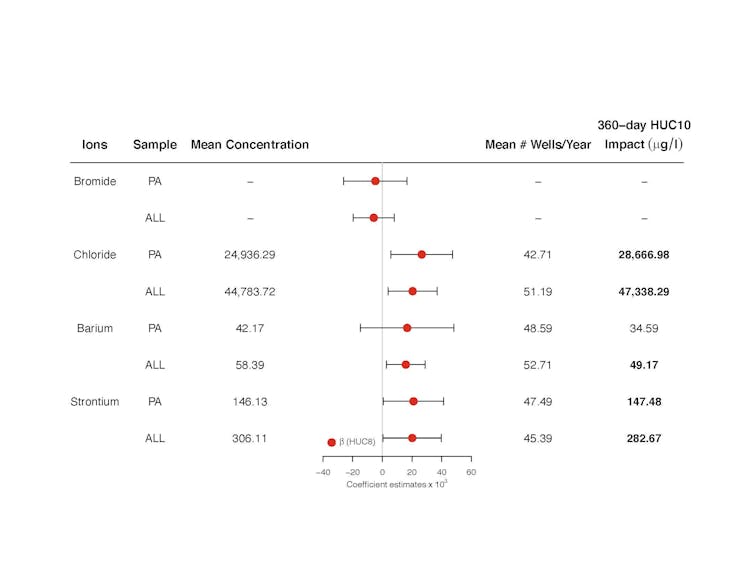
Our study, published in Science, uses a statistical approach to identify changes in the concentration of certain salts associated with new wells. We discovered a very small but consistent increase in barium, chloride and strontium – for bromide, our results were more mixed and not as robust.

Salt concentrations were most increased at monitoring stations that were located within 15 km and downstream from a well, and in measurements taken within a year of fracking activity.

A figure showing the association between salt concentrations and new fracking wells
This figure plots the associations between salt concentrations and a new fracking well located within 15km and likely upstream of the water monitor.

The increases in salt we discovered were small and within the bounds of what the US Environmental Protection Agency considers safe for drinking water. However, since our water measurements were mostly taken from rivers, not all of the public surface water monitors we used are close to wells, or are in locations where they can detect the effects of fracking: for example, they may be located upstream of new wells. That means the salt concentrations in water flowing downstream from new wells could be even higher.

Our study was also limited by the public data available. We were not able to investigate potentially more toxic substances found in the fracturing fluids or in the produced water, such as radium or arsenic. Public databases do not widely include measurements of these other substances, making it hard for researchers to carry out the statistical analysis needed to detect anomalous concentrations related to new wells.

That said, the salts we analysed are not exactly innocuous. High concentrations of barium in drinking water may lead to increases in blood pressure, while chloride can potentially threaten aquatic life. Elevated strontium levels can even have adverse impacts on human bone development, especially in the young.

Next steps

It is undeniable that fracking has played a big role in replacing the fossil fuel coal as a source of energy. Some studies show that, relative to periods of massive coal-burning, the overall quality of surface water has improved. Fracking has also brought an economic boost to underdeveloped areas. Still, the question remains as to whether it is safe for local communities.

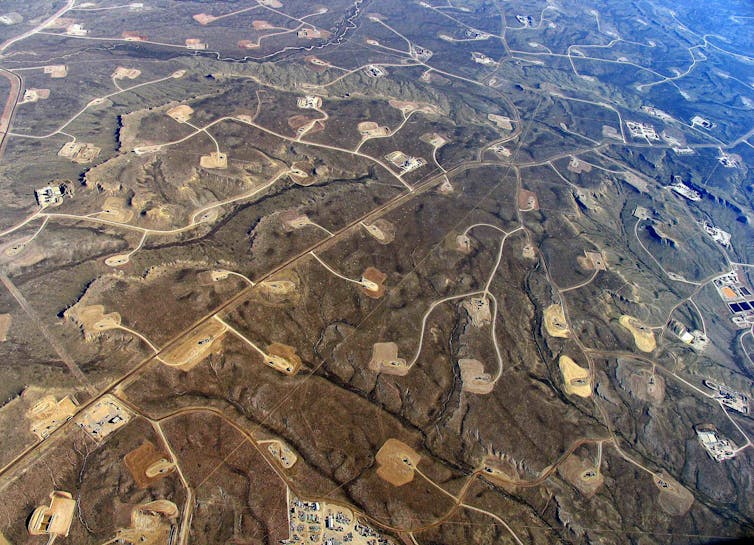
A heavy fracking area, with wells connected by roads
Where fracking is heavy, roads and pipelines make a web across the landscape.
Simon Fraser University/Flickr

While our study is an important step towards understanding the environmental impact of fracking, more data are needed to truly answer these safety concerns. The good news is, with new disclosure rules, we have a better awareness of exactly which chemicals are being used.

The next step is for policymakers to make sure that government agencies systematically track these chemicals in fracking fluids and produced waters, place monitoring stations in locations where they can better track surface water impacts, and increase the frequency of water quality measurement around the time new wells are drilled.

A more targeted approach could go a long way in enabling research and helping to protect the public health of communities for whom fracking could yet be a blessing or a curse.

—————————The Conversation

This blog is written by Giovanna Michelon, Professor of Accounting, University of Bristol; Christian Leuz, Professor of International Economics, Finance and Accounting, University of Chicago, and Pietro Bonetti, Assistant Professor of Accounting and Control, IESE Business School (Universidad de Navarra)

This article is republished from The Conversation under a Creative Commons license. Read the original article.

World Water Day 2021: What does water mean to the Cabot community?


It’s World Water Day (22 March) and we have joined the global public campaign on the theme for 2021 of valuing water. The campaign is designed to generate a worldwide conversation about how different people in different contexts value water for all its uses.
So we asked researchers, students and staff at the Cabot Institute for the Environment, what does water mean to you? Whether it is something learnt through research, personal experiences or simply what you think when you think of water, we asked our community for stories, thoughts, and feelings about water!
All responses including ours and many others across the world will be compiled by UN-Water to create a comprehensive understanding of how water is valued and to help safeguard this resource in a way that will benefit us all.
Cabot Institute for the Environment researchers and students are doing lots of wonderful and important work to deliver the evidence base and solutions to protect water (find out more). Here is what some of them shared with us for World Water Day #Water2me.

What does water mean to you?

“Water is the most special substance on Earth. Everyone has a relationship with it. It is ubiquitous yet still enigmatic. As a hydrologist I have been working for years to better understand where it goes after it rains. As a person who grew up in semi-arid Cyprus, I know that water scarcity can shape a culture as much as it shapes the landscape. As a person who has been living in the UK, I know that too much water can also shape a culture. Too little or too much – water is both a life giver and a life taker. It is everywhere, nowhere, hidden, precious, ever changing, elusive, wondrous, yet taken for granted.   Dr Katerina Michaelides, Co-lead of Cabot Institute for the Environment water theme 


“Liquid water can take any shape of its recipient. As water vapor, it becomes invisible and travels into the air… but it is still there. As ice and it can sometimes provide a hard surface. Water reminds me of adaptation and opportunities. We face a global challenge in ensuring water to all living beings on Earth, but the nature of water tells me that we must adapt to any changes coming in future years and turn challenges into opportunities to develop more sustainable and earth-friendly measures to tackle our societal needs.” – Dr Rafael Rosolem, Co-lead of Cabot Institute for the Environment water theme 


“Water is the essence of life and its tiny moving molecules connect almost everything on Earth – bodies of water in rivers, glaciers, oceans, atmospheres are connected to our bodies as humans. What happens in one body trickles down and impacts others, so we have to be careful with how we manage this vast cycle of water, and of life.” – Professor Jemma Wadham, Director of Cabot Institute for the Environment 


“When you grow up in a country, where 2/3 is a desert with 1 hour of water supply per 48 hours (mainly at 2am!), water is more precious than oil and sometimes gold.” – Dr Hind Saidani-Scott, Cabot Institute for the Environment researcher 
“Simply put, water means health, safety, and life 💧 Without clean water, access to this becomes limited, whereas with it – we can thrive 🌍” – Olivia Reddy, University of Bristol PhD candidate and member of Cabot Institute for the Environment ‘Cabot Communicators’ group.


As a kid to me water meant fun, it sparked feelings of joy and excitement for swimming in the ocean and having a good time. While water remained a magical thing to me, as I grew older, I began to consider its role as a global resource, its precarity, need for protection and how lucky I was to have access to it. Now as I undertake my research at Cabot, I am learning more about the spirituality and sacrality of water amongst indigenous cultures, not only as a “resource” but at as point for worship, ceremony, and community and something to learn from. Today I understand water as part of us as well as our world” – Lois Barton, post-graduate researcher, Global Environmental Challenges, Cabot Institute for the Environment       


“The first thing I would have said when asked to think about water two years ago is a refreshing glassful from the tap. But watching the film Cowspiracy and following this up with my own research into animal agriculture has made me look at water differently. Now, I think of water in terms of cows. 2,500 gallons of water are needed to produce one pound of beef. Animal agriculture is responsible for up to 33% of freshwater usage globally! For me, a new understanding of water and water-use was a key factor in prompting the decision to change to a plant-based diet and advocate that others do the same for the good of the planet and the people who do not have water on tap like I do every day. – Lucy Morris, post-graduate researcher, Global Environmental Challenges, Cabot Institute for the Environment

Hidden Water: Valuing water we cannot see 

Cabot Institute for the Environment is also hosting a public event for World Water Day (17:15 GMT, 22 March 2021) which is bringing together two leading researchers to discuss the value of ‘hidden water’ resources: groundwater and glaciers. 
 
Dr Debra Perrone, University of California, will discuss her research which revealed millions of groundwater wells and strategies to protect them. Professor Jemma Wadham, Cabot Institute for the Environment, will discuss the impacts of glacier retreat in the Peruvian Andes and solutions to adapt to these changes. Chaired by Cabot Institute for the Environment water experts, Dr Katerina Michaelides and Dr Rafael Rosolem. More information here

Join the discussion

What does water mean to you? Tag @cabotinstitute and #WorldWater #Water2me on Twitter to let us know.

——————————


This blog is written by Adele Hulin, Cabot Institute Coordinator at the University of Bristol, and Lois Barton, Cabot Institute for the Environment MScR student and temporary communications assistant at the Institute.
Adele Hulin
Adele Hulin

Hydrological modelling and pizza making: why doesn’t mine look like the one in the picture?

Is this a question that you have asked yourself after following a recipe, for instance, to make pizza?

You have used the same ingredients and followed all the steps and still the result doesn’t look like the one in the picture…

Don’t worry: you are not alone! This is a common issue, and not only in cooking, but also in hydrological sciences, and in particular in hydrological modelling.

Most hydrological modelling studies are difficult to reproduce, even if one has access to the code and the data (Hutton et al., 2016). But why is this?

In this blog post, we will try to answer this question by using an analogy with pizza making.

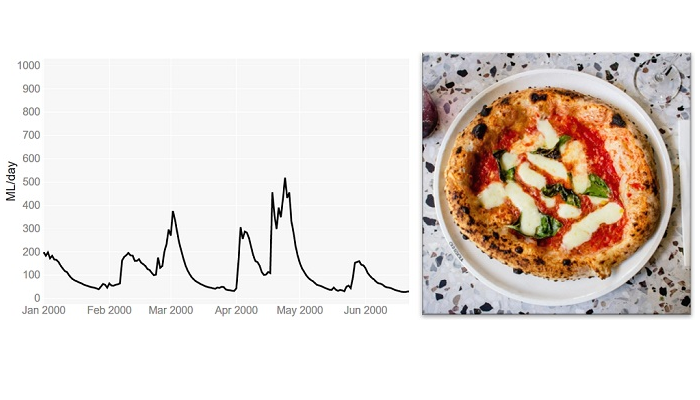
Let’s imagine that we have a recipe together with all the ingredients to make pizza. Our aim is to make a pizza that looks like the one in the picture of the recipe.

This is a bit like someone wanting to reproduce the results reported in a scientific paper about a hydrological “rainfall-runoff” model. There, one would need to download the historical data (rainfall, temperature and river flows) and the model code used by the authors of the study.

However, in the same way as the recipe and the ingredients are just the start of the pizza making process, having the input data and the model code is only the start of the modelling process.

To get the pizza shown in the picture of the recipe, we first need to work the ingredients, i.e. knead the dough, proof and bake. And to get the simulated river flows shown in the study, we need to ‘work’ the data and the model code, i.e. do the model calibration, evaluation and final simulation.

Using the pizza making analogy, these are the correspondences between pizza making and hydrological modelling:

Pizza making                         Hydrological modelling

kitchen and cooking tools computer and software

ingredients                         historical data and computer code for model simulation

recipe                                 modelling process as described in a scientific paper or in a computer                                                         script / workflow

Step 1: Putting the ingredients together

Dough kneading

So, let’s start making the pizza. According to the recipe, we need to mix well the ingredients to get a dough and then we need to knead it. Kneading basically consists of pushing and stretching the dough many times and it can be done either manually or automatically (using a stand mixer).

The purpose of kneading is to develop the gluten proteins that create the structure and strength in the dough, and that allow for the trapping of gases and the rising of the dough.The recipe recommends using a stand mixer for the kneading, however if we don’t have one, we can do it manually.

The recipe says to knead until the dough is elastic and looks silky and soft. We then knead the dough until it looks like the one in the photo shown in the recipe.

Model calibration

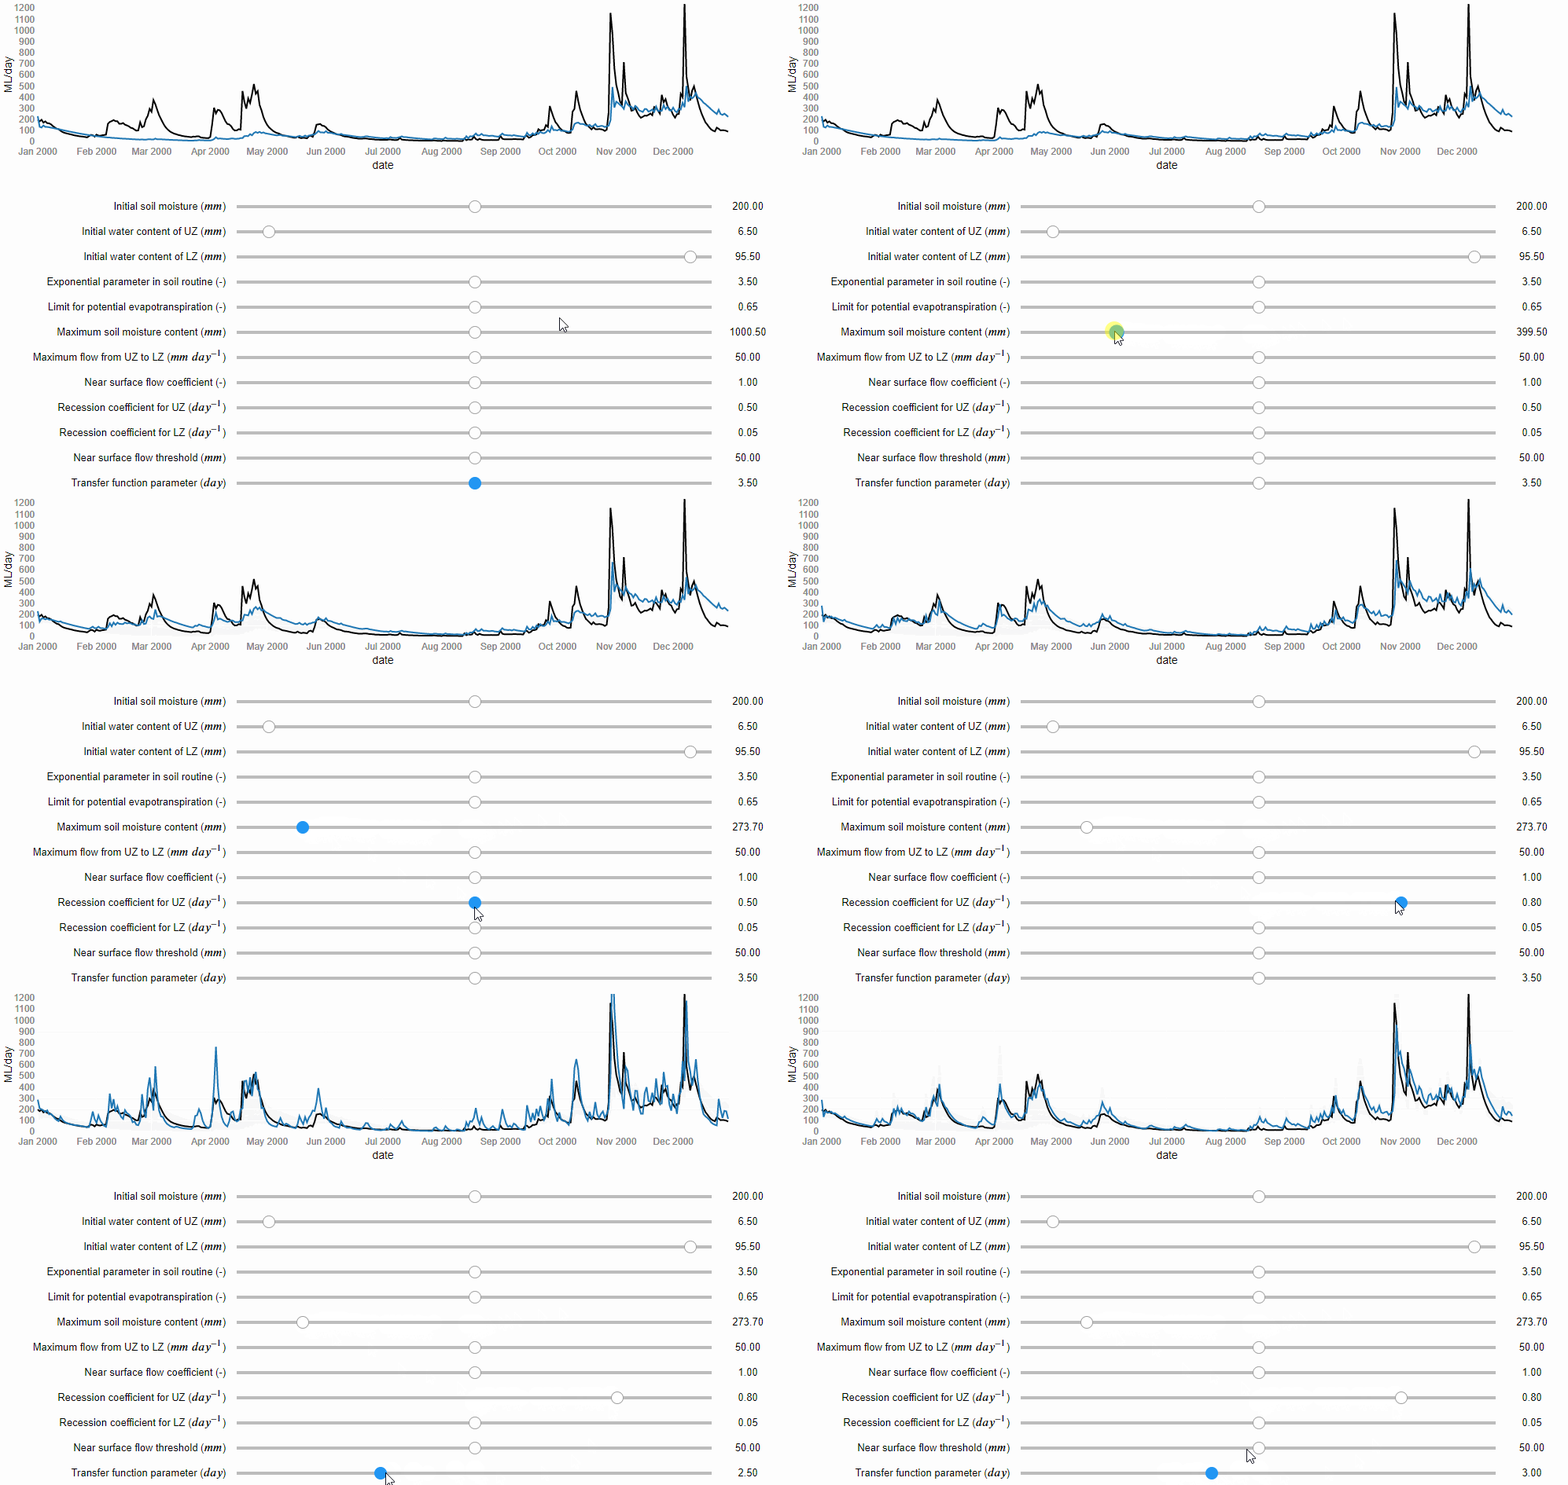
Now, let’s start the modelling process. If the paper does not report the values of the model parameters, we can determine them through model calibration. Model calibration is a mathematical process that aims to tailor a general hydrological model to a particular basin. It involves running the model many times under different combinations of the parameter values, until one is found that matches well the flow records available for that basin. Similarly to kneading, model calibration can be manual, i.e. the modeller changes manually the values of the model parameters trying to find a combination that captures the patterns in the observed flows (Figure 1), or it can be automatic, i.e. a computer algorithm is used to search for the best combination of parameter values more quickly and comprehensively.

Figure 1 Manual model calibration. The river flows predicted by the model are represented by the blue line and the observed river flows by the black line (source: iRONS toolbox)

According to the study, the authors used an algorithm implemented in an open source software for the calibration. We can download and use the same software. However, if any error occurs and we cannot install it, we could decide to calibrate the model manually. According to the study, the Nash-Sutcliffe efficiency (NSE) function was used as numerical criteria to evaluate the calibration obtaining a value of 0.82 out of 1. We then do the manual calibration until we obtain NSE = 0.82.

(source: iRONS toolbox)

Step 2: Checking our work

Dough proofing

In pizza making, this step is called proofing or fermentation. In this stage, we place the dough somewhere warm, for example close to a heater, and let it rise. According to the recipe, the proofing will end after 3 hours or when the dough has doubled its volume.

The volume is important because it gives us an idea of how strong the dough is and how active the yeast is, and hence if the dough is ready for baking. We let our dough rise for 3 hours and we check. We find out that actually it has almost tripled in size… “even better!” we think.

Model evaluation

In hydrological modelling, this stage consists of running the model using the parameter values obtained by the calibration but now under a different set of temperature and rainfall records. If the differences between estimated and observed flows are still low, then our calibrated model is able to predict river flows under meteorological conditions different from the one to which it was calibrated. This makes us more confident that it will work well also under future meteorological conditions. According to the study, the evaluation gave a NSE = 0.78. We then run our calibrated model fed by the evaluation data and we get a NSE = 0.80… “even better!” we think.

Step 3: Delivering the product!

Pizza baking

Finally, we are ready to shape the dough, add the toppings and bake our pizza. According to the recipe, we should shape the dough into a round and thin pie. This takes some time as our dough keeps breaking when stretched, but we finally manage to make it into a kind of rounded shape. We then add the toppings and bake our pizza.

Ten minutes later we take the pizza out of the oven and… it looks completely different from the one in the picture of the recipe! … but at least it looks like a pizza…

(Source: flickr.com)

River flow simulation

And finally, after calibrating and evaluating our model, we are ready to use it to simulate recreate the same river flow predictions as shown in the results of the paper. In that study, they forced the model with seasonal forecasts of rainfall and temperature that are available from the website of the European Centre for Medium-range Weather Forecasts (ECMWF).

Downloading the forecasts takes some time because we need to write two scripts, one to download the data and one to pre-process them to be suitable for our basin (so called “bias correction”). After a few hours we are ready to run the simulation and… it looks completely different from the hydrograph shown in the study! … but at least it looks like a hydrograph…

Why we never get the exact same result?

Here are some possible explanations for our inability to exactly reproduce pizzas or modelling results:

  • We may have not kneaded the dough enough or kneaded it too much; or we may have thought that the dough was ready when it wasn’t. Similarly, in modelling, we may have stopped the calibration process too early or too late (so called “over-fitting” of the data).
  • The recipe does not provide sufficient information on how to test the dough; for example, it does not say how wet or elastic the dough should be after kneading. Similarly, in modelling, a paper may not provide sufficient information about model testing as, for instance, the model performance for different variables and different metrics.
  • We don’t have the same cooking tools as those used by the recipe’s authors; for example, we don’t have the same brand of the stand mixer or the oven. Similarly, in modelling we may use a different hardware or operating system, which means calculations may differ due to different machine precision or slightly different versions of the same software tools/dependencies.
  • Small changes in the pizza making process, such as ingredients quantities, temperature and humidity, can lead to significant changes in the final result, particularly because some processes, such as kneading, are very sensitive to small changes in conditions. Similarly, small changes in the modelling process, such as in the model setup or pre-processing of the data, can lead to rather different results.

In conclusion…

Setting up a hydrological model involves the use of different software packages, which often exist in different versions, and requires many adjustments and choices to tailor the model to a specific place. So how do we achieve reproducibility in practice? Sharing code and data is essential, but often is not enough. Sufficient information should also be provided to understand what the model code does, and whether it does it correctly when used by others. This may sound like a big task, but the good news is that we have increasingly powerful tools to efficiently develop rich and interactive documentation. And some of these tools, such as R Markdown or Jupyter Notebooks, and the online platforms that support them such as Binder, enable us not only to share data and code but also the full computational environment in which results are produced – so that others have access not only to our recipes but can directly cook in our kitchen.

—————————

This blog has been reposted with kind permission from the authors, Cabot Institute for the Environment members Dr Andres Peñuela, Dr Valentina Noacco and Dr Francesca Pianosi. View the original post on the EGU blog site.

Andres Peñuela is a Research Associate in the Water and Environmental Engineering research group at the University of Bristol. His main research interest is the development and application of models and tools to improve our understanding on the hydrological and human-impacted processes affecting water resources and water systems and to support sustainable management and knowledge transfer


Valentina Noacco is a Senior Research Associate in the Water and Environmental Engineering research group at the University of Bristol. Her main research interest is the development of tools and workflows to transfer sensitivity analysis methods and knowledge to industrial practitioners. This knowledge transfer aims at improving the consideration of uncertainty in mathematical models used in industry


Francesca Pianosi is a Senior Lecturer in Water and Environmental Engineering at the University of Bristol. Her expertise is in the application of mathematical modelling to hydrology and water systems. Her current research mainly focuses on two areas: modelling and multi-objective optimisation of water resource systems, and uncertainty and sensitivity analysis of mathematical models.


World Water Day: Water scarcity challenges under climate change in East African drylands

Climate change presents great challenges for dryland regions, especially in communities where socioeconomic livelihoods are tied to the consistency of seasonal rainfall. In the dryland regions of East Africa, drought is a major threat to rainfed agriculture and to drinking water supplies, and regional climate is projected to increase drought frequency and severity.

Since 2000 alone East Africa has been struck by 10 droughts, which generated three severe famines affecting millions of people in the region. Although there is often consensus about the growing regional threat posed by drought, there is a major disconnect between the climate science (meteorological drought) and assessments of usable water resources (hydrological drought) that support livelihoods.

Affected communities need straightforward answers to a practical set of questions: How will regional climate change affect soil moisture required to grow crops or the water table in wells that provide precious drinking water in a parched landscape? How will the water stores change season by season and over coming decades? Furthermore, what adaptation strategies are available to address this challenge?

Through a series of funded projects, we have been working at better understanding how climate and climate change translates into useable water in the ground in East African dryland regions, and how people use and access relevant information to make livelihood decisions towards adaptation. We have developed an interdisciplinary team comprised of dryland hydrologists, climatologists, hydrometeorologists, computer scientists, pastoralist experts, and social scientists (both in the UK and Kenya, Somalia and Ethiopia) to develop a holistic perspective on both the physical and social aspects of drought. We are developing new regional modelling tools that convert past and future rainfall trends into soil moisture and groundwater. These models will underpin a new mobile phone app that aims to deliver forecasts of crop yields and soil moisture to remote agro-pastoralists. Simultaneously we are working with drought-affected communities in Kenya and Ethiopia to better understand barriers and opportunities for improving resilience to climate change, information use, and feasible adaptation strategies.

We hope that through these research endeavours we can contribute to improved climate adaptation efforts in these dryland regions and to long-term societal resilience to climate change.

Read more about Katerina’s work.

———————————-
This blog is written by Dr Katerina Michaelides, Head of Dryland Research Group at the School of Geographical Sciences and Cabot Institute for the Environment, University of Bristol.

Katerina Michaelides

World Water Day: Climate change and flash floods in Small Island Developing States

Pluvial flash flooding (otherwise known as flash flooding caused by rain) is a major hazard globally, but a particularly acute problem for Small Island Developing States (SIDS). Many SIDS experience extreme rainfall events associated with tropical cyclones (often referred to as hurricanes) which trigger excess surface water runoff and lead to pluvial flash flooding.

Following record-breaking hurricanes in the Caribbean such as Hurricane Maria in 2017 and Hurricane Dorian in 2019, the severe risk facing SIDS has been reaffirmed and labelled by many as a sign of the ‘new normal’ due to rising global temperatures under climate change. Nonetheless, in the Disaster Risk Reduction community there is a limited understanding of both current tropical-cyclone induced flood hazard and how this might change under different climate change scenarios, which inhibits attempts to build adaptive capacity and resilience to these events.

As part of the first year of my PhD research, I am applying rainfall data that has been produced by Emily Vosper and Dr Dann Mitchell in the University of Bristol BRIDGE group using a tropical cyclone rainfall model. This model uses climate model data to simulate a large number of tropical cyclone events in the Caribbean, which are used to understand how the statistics of tropical cyclone-induced rainfall might change under the 1.5C and 2C Paris Agreement scenarios. This rainfall data will be input into the hydrodynamic model LISFLOOD-FP to simulate pluvial flash flooding associated with hurricanes in Puerto Rico.

Investigating changes in flood hazard associated with different rainfall scenarios will help us to understand how flash flooding, associated with hurricanes, emerges under current conditions and how this might change under future climate change in Puerto Rico. Paired with data identifying exposure and vulnerability, my research hopes to provide some insight into how flood risk related to hurricanes could be estimated, and how resilience could be improved under future climate change.

————————————-
This blog is written by Cabot Institute member Leanne Archer, School of Geographical Sciences,  University of Bristol.
Leanne Archer

Flooding in the UK: Understanding the past and preparing for the future

On the 16th of October 2019, Ivan Haigh ­Associate Professor in Coastal Oceanography at the University of Southampton – gave a presentation on the “characteristics and drivers of compound flooding events around the UK coast” at the BRIDGE research seminar in the School of Geographical Sciences. He began by outlining the seriousness of flood risk in the UK – it is the second highest civil emergency risk factor as defined by the Cabinet Office – before moving on to the first section of the talk on his work with the Environment Agency on its Thames Estuary 2100 plan (TE2100)[1].

Thames Estuary 2100 plan: 5-year review

The construction of a Thames barrier was proposed after severe flooding in London in 1953, and it eventually became operational 30 years later in 1983. Annually, the Thames barrier removes around £2bn of flood damage risk from London and is crucial to the future prosperity of the city in a changing environment.

The Thames Barrier in its closed formation. Image source: Thames Estuary 2100 Plan (2012)

Flood defences in the Thames estuary were assessed in the TE2100 plan, which takes an innovative “adaptive pathways management approach” to the future of these flood defences over the coming century. This approach means that a range of flood defence options are devised and the choice of which ones to implement is based upon the current environmental data and the latest models of future scenarios, in particular predictions of future sea level rise.

For this method to be effective, accurate observations of recent sea level changes must be made in order to determine which management pathway to implement and to see if these measurements fit with the predictions of future sea level rise used in the plan. This work is carried out in reviews of the plan at five-year intervals, and it was this work that Ivan and his colleagues were involved with.

There is significant monthly and annual variability in the local tide gauge records that measure changes in sea level, and this can make it difficult to assess whether there is any long-term trend in the record. Using statistical analysis of the tide gauge data, the team was able to filter 91% of the variability that was due to short term changes in atmospheric pressure and winds to reveal a trend of approximately 1.5 mm per year of sea level rise, in line with the predictions of the model that is incorporated into the TE2100 plan.

Compound flood events around the UK Coast

In the second half of his presentation, Ivan went on to discuss a recent paper he was involved with studying compound flood events around the UK (Hendry et al. 2019)[2]. A compound flood occurs when a storm surge, caused by low atmospheric pressure allowing the sea surface to rise locally, combines with river flooding caused by a large rainfall event. These can be the most damaging natural disasters in the UK, and from historical data sets stretching back 50 years at 33 tide gauges and 326 river stations, the team were able to determine the frequency of compound floods across the UK.

Along the west coast, there were between 3 and 6 compound flooding events per decade, whereas on the east coast, there were between 0 and 1 per decade. This difference between east and west is driven by the different weather patterns that lead to these events. On the west coast it is the same type of low-pressure system that causes coastal storm surges and high rainfall. However, on the east coast different weather patterns are responsible for high rainfall and storm surges, meaning it is very unlikely they could occur at the same time.

Number of compound flood events per decade at each of the 326 river stations in the study. Triangle symbols implies rover mouth on West coast, circles East coast and squares South coast. Image Source: Hendry et al. 2019 [2]

There is also significant variability along the west coast of the UK as well, and the team investigated whether the characteristics of the river catchments could impact the possibility of these compound flooding events occurring. They found that smaller river catchments, and steeper terrain within the catchments, increased the probability of these compound flooding events occurring as water from rainfall was delivered to the coast more quickly. From the improved understanding of the weather patterns behind compound flooding events that this work provides, the quality and timeliness of flood warnings could be improved.

From the question and answer session we heard that current flood risk assessments do not always include the potential for compound flood events, meaning flood risk could be underestimated along the west coast of the UK. We also heard that Ivan will be working with researchers in the hydrology group here at the University of Bristol to further the analysis of the impact of river catchment characteristics on the likelihood of compound flooding events, and then extending this analysis to Europe, North America and Asia.

References

[1] Environment Agency (2012), “Thames Estuary 2100 Plan”.
[2] Alistair Hendry, Ivan D. Haigh, Robert J. Nicholls, Hugo Winter, Robert Neal, Thomas Wahl, Amélie Joly-Laugel, and Stephen E. Darby, (2019). “Assessing the characteristics and drivers of compound flooding events around the UK coast”, Hydrology and Earth System Science, 23, 3117-3139.

——————————————-

This blog was written by Cabot Institute member Tom Mitcham. He is a PhD student in the School of Geographical Sciences at the University of Bristol and is studying the ice dynamics of Antarctic ice shelves and their tributary glaciers.

Tom Mitcham

Read Tom’s other blog:
1. Just the tip of the iceberg: Climate research at the Bristol Glaciology Centre

Peru’s ancient water systems can help protect communities from shortages caused by climate change


Mount Hount Huascarán, Cordillera Blanca, taken from Hauashao village. Credit: Susan Conlon


Water is essential for human life, but in many parts of the world water supplies are under threat from more extreme, less predictable weather conditions due to climate change. Nowhere is this clearer than in the Peruvian Andes, where rising temperatures and receding glaciers forewarn of imminent water scarcity for the communities that live there.

Peru holds more than 70% of the world’s tropical glaciers. Along the 180 kilometre expanse of the Cordillera Blanca (“white mountains”), more than 250,000 people depend on glaciers for a year-round supply of water. Meltwater from the glaciers supplies rivers, offering a vital supplement to rainwater so that locals can continue irrigating food crops throughout the dry season, from May to October.
But Peruvian glaciers have shrunk by 25% since 1987, and the water supply to rivers during the dry season is gradually decreasing. While national and regional governments and NGOs are responding to the threat of water scarcity with modern engineering solutions, there are growing concerns among the communities affected that such efforts are misplaced.

Modern day misfires

Take, for example, the village of Huashao. Nestled between the highest peaks of the Cordillera Blanca, Huashao is a typical farming village of the region. Glacier meltwater feeds the Yurac Uran Atma canal, which supplies irrigation water to families in Huashao. In 2011, a municipal government project transformed this canal from a rustic irrigation ditch to a modern PVC pipeline, with lock-gates to regulate the flow of water and ensure equal distribution throughout the village.
The village of Huashao. ConDevCenter/Flickr.CC BY-NC-ND
Governments and NGOs commonly promote modern measures to capture and conserve water for irrigation – for example, by lining irrigation canals with concrete, to prevent leakages. While it’s important to conserve water to safeguard food supplies, these kinds of measures have been criticised for their lack of flexibility and sensitivity to local needs.
While the pipeline in Huashao provided security and reduced the amount of time people had to devote to distributing water where it was needed, Conlon’s ongoing ethnographic research in the village found that local women were concerned about its effect on the local puquios (springs) – a valued source of irrigation and drinking water.
Noticing less water in puquios, they blamed the canal lining for stopping water from filtering into the local geology. Local communities see this process as an integral part of water distribution, but authorities often refer to it as “leakage”.
What’s more, the local people responsible for maintaining and operating the new canal found that not everything worked as planned. They were particularly worried when a problem caused water to overflow the canal walls, and blamed the design of the lock–gates.
Here, the government’s preference for modern engineering meant that it missed an opportunity to engage with traditional technologies and local knowledge. This is hardly surprising – ancient know-how has been routinely dismissed as inferior by state authorities and well-meaning (but badly briefed) NGOs. Yet traditional technologies, like the puquios, have been providing flexible ways to manage water in Huashao for hundreds of years.
In Huashao, the local people are coming to realise the limitations of modern engineering. But across the Andes, many other communities are still seduced by the promise of quick fixes offered by concrete, steel and PVC pipelines. Unfortunately, initial, costly investments of aid and expertise are rarely followed up, and since communities often lack the necessary knowledge and funds to maintain these systems, they eventually break down.

Ancient married with modern

Slowly, a push back is starting. There has been renewed interest in what society can learn from traditional irrigation systems. A recent international workshop held in Trujillo, Peru, brought together social scientists, geographers and climate scientists to discuss how to tackle issues around water use and scarcity.
It seems likely that the best solutions will be found by combining old and new knowledge, rather than dismissing one in favour of the other. For instance, parallel to the Cordillera Blanca is the Cordillera Negra (“black mountains”), which faces the Pacific Ocean. Without the benefit of glaciers, the ancient inhabitants of this area learned to harness rain water to see them through the dry season.
These pre-Colombian cultures instigated millennia-long engineering projects, resulting in large dams and reservoirs placed along the slopes of the mountains. These structures controlled water and soil erosion, feeding underground water deposits and providing water for crops and livestock.
An ancient dam in the Cordillera Negra. Kevin Lane.Author provided
Disuse over the last few centuries means that few are still functioning, but those that are, are a tribute to the ancient expertise. By contrast, modern concrete micro-dams have a functional life of 40 to 50 years, often curtailed by seismic activity to between 15 and 25 years.
Fortunately, plans are afoot to revisit these old technologies. Solutions rooted in respect for community and local knowledge, and allied to flexible modern engineering – such as better water retainment technology – are exploring ways in which we can shore-up the effectiveness of these ancient dams.
Throwing money and resources into engineering projects does not always guarantee success when trying to combat the effects of climate change and protect vulnerable communities. But the marriage of ancient and modern technologies offers promising solutions to the threat of water scarcity in Peru, and places like it all across the world.
———
This blog is by Cabot Institute member Dr Susan Conlon, Research Associate at the University of Bristol, and Kevin Lane, Senior Researcher in Archeology at Universidad de Buenos Airies. The article is republished from The Conversation under the Creative Commons licence. Read the original article
Dr Susan Conlon

UK Climate Projections 2018: From science to policy making

On a sunny day earlier this week, I attended the UK Climate Projections 2018: From science to policy making, meeting in Westminster on behalf of the Cabot Institute. Co-hosted by the All-Party Parliamentary Climate Change Group and the UK Met Office, the main purpose of this event was to forge discussions between scientists involved in producing the latest UK Climate Projections (UKCP18) and users from various sectors about the role of UKCP18 in increasing the UK’s preparedness of future climate change.

Many people in my constituency come and ask about climate change every day.

The event began with an opening remark by Rebecca Pow, the MP for Taunton Deane in Somerset. Somerset has seen some devastating floods over the years, and a new land drainage bill was passed a week prior to manage flood risk in the area. Constantly faced with questions from her constituents about climate change, Rebecca is particularly interested in regional climate change, both at present and in the future, and any opportunities that may arise from it.

Everyone would like a model of their back garden.

Prof Sir Brian Hoskins, the Founding Director and Chair of the Grantham Institute for Climate Change and the Environment, and Professor in Meteorology at the University of Reading, gave an overview on climate projection. He listed three main sources of uncertainty in 21st century climate projection: internal variability, model uncertainty, and human activity uncertainty. Climate scientists deal with these uncertainties by using large ensembles of simulations, a range of climate models, and a range of climate scenarios. However, there is always tension between model resolution, complexity and the need for many model runs in global climate projections due to constraints in computer resources. Regional climate models can be embedded in global domains to provide local weather and climate information, but they cannot correct large scale errors. The peer-reviewed UKCP18 provide both the statistics of global climate by combining data from different climate models and runs, and regional daily data for the UK and Europe.

A greater chance of warmer, wetter winters and hotter, drier summers.

This was one of the headline results from UKCP18 shown by Prof Jason Lowe, Head of Climate Services for Government at the Met Office Hadley Centre. UKCP18 is an update from its predecessor, UKCP09, but with constraints from new observations and data from more climate models from around the world. The horizontal resolution of regional climate projections for the UK and Europe has increased from 25 km in UKCP09 to 12 km in UKCP18, with an even higher resolution (2.2 km) dataset coming out in summer 2019. UKCP18 results show that all areas of the UK are projected to experience warming, with greater warming in the summer than the winter. Summer rainfall is expected to decrease in the UK, whereas winter precipitation is expected to increase. However, when it rains in summer it may rain harder. Sea-level rise will continue under all greenhouse gas emission scenarios at all locations around the UK, impacting extreme water levels in the future.

Heat and health inter-connections are complex.

Prof Sarah Lindley, Professor of Geography at the University of Manchester, shared how UKCP18 could be used to study the health effects of climate change and urban heat in the UK. Many of us would remember how hot it was last summer; by 2050, hot summers of that type may happen every other year, even under a low greenhouse gas emission scenario. The most extreme heat-related hazards are in cities due to the Urban Heat Island effect (UHI), i.e. urban areas are often warmer than surrounding rural areas. For instance, Manchester’s UHI intensity (difference between urban and rural temperatures) has increased significantly since the late 1990s. By the end of this century, the city of Manchester is projected to be 2.4ºC warmer than its surrounding rural area in a UKCP09 medium emission scenario. With an aging population, UK’s vulnerability to heat may increase in the future. Both exposure and vulnerability to heat contribute to heat disadvantage. High-resolution UKCP18 data, together with social vulnerability maps of the UK, provide new opportunities to heat disadvantage and adaptation research.

European birds will need to shift about 550 km north-east under 3ºC warming.

The next speaker was Dr Olly Watts, Senior Climate Change Policy Officer for the RSPB, the largest nature conservation charity in the UK. Climate adaptation is an important aspect of nature conservation work, as it should be in everyone’s work. The Climatic Atlas of European Breeding Birds finds that not only will European birds shift 550 km under a likely 3ºC increase in global average temperature, but also a quarter of the bird species will be at high risk. Currently 5000 bird species are changing species distribution, and they face an uncertain future. The UKCP18 data of 2-4ºC warmer worlds could be used to derive qualitative strategies to build wildlife resilience against climate change. Adaptation strategies including informing nature reserve management will be in place across the RSPB conservation programme. The RSPB will also use UKCP18 data to raise public awareness of climate change.

Water demand can increase by 30% on a hot day.

Dr Geoff Darch, Water Resources Strategy Manager at Anglian Water, began his talk by highlighting the inherent climate vulnerabilities in water management in the East of England. It is a “water stressed” region that has low lying and extensive coastline, sensitive habitats, and vulnerable soils. On a hot day, water demand can go up by 30%. Climate change alone is expected to have a total impact of 55 Ml/day on water supplies in the region by 2045. A growing risk of severe drought means an additional impact of 26 Ml/day is expected, not to mention the impacts of population growth. The water industry is proactively adapting to these challenges by setting up plans to reduce leakage and install smart meters for customers. UKCP09 has been used extensively for climate change risk assessment across the water sector; the latest UKCP18 could be used in hydrological modelling, demand modelling, storm impact modelling, flood risk assessment, and sensitivity testing to assess the robustness of water resources management solutions under a range of climate scenarios.

————————————-
This blog was written by Cabot Institute member Dr Eunice Lo, from the School of Geographical Sciences at the University of Bristol. Her research focusses on climate change, extreme weather and human health.

Dr Eunice Lo