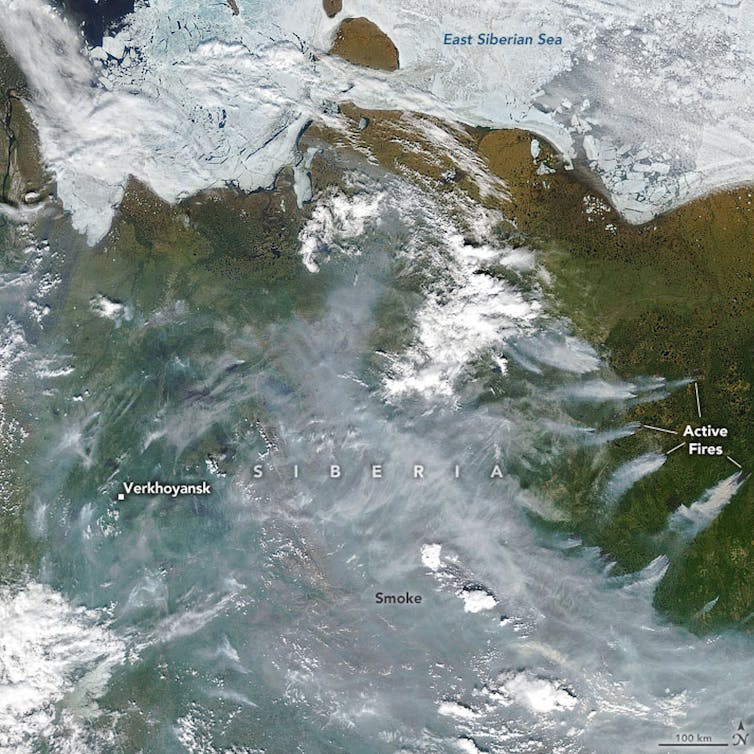
Siberia heatwave: why the Arctic is warming so much faster than the rest of the world

Smoke from wildfires cloaks the skies over Siberia, June 23 2020.
EPA-EFE/NASA

On the eve of the summer solstice, something very worrying happened in the Arctic Circle. For the first time in recorded history, temperatures reached 38°C (101°F) in a remote Siberian town – 18°C warmer than the maximum daily average for June in this part of the world, and the all-time temperature record for the region.

New records are being set every year, and not just for maximum temperatures, but for melting ice and wildfires too. That’s because air temperatures across the Arctic have been increasing at a rate that is about twice the global average.

All that heat has consequences. Siberia’s recent heatwave, and high summer temperatures in previous years, have been accelerating the melting of Arctic permafrost. This is the permanently frozen ground which has a thin surface layer that melts and refreezes each year. As temperatures rise, the surface layer gets deeper and structures embedded in it start to fail as the ground beneath them expands and contracts. This is what is partly to blame for the catastrophic oil spill that occurred in Siberia in June 2020, when a fuel reservoir collapsed and released more than 21,000 tonnes of fuel – the largest ever spill in the Arctic.

So what is wrong with the Arctic, and why does climate change here seem so much more severe compared to the rest of the world?

The warming models predicted

Scientists have developed models of the global climate system, called general circulation models, or GCMs for short, that reproduce the major patterns seen in weather observations. This helps us track and predict the behaviour of climate phenomena such as the Indian monsoon, El Niño, Southern Oscillations and ocean circulation such as the gulf stream.

GCMs have been used to project changes to the climate in a world with more atmospheric CO₂ since the 1990s. A common feature of these models is an effect called polar amplification. This is where warming is intensified in the polar regions and especially in the Arctic. The amplification can be between two and two and a half, meaning that for every degree of global warming, the Arctic will see double or more. This is a robust feature of our climate models, but why does it happen?

Fresh snow is the brightest natural surface on the planet. It has an albedo of about 0.85, which means that 85% of solar radiation falling on it is reflected back out to space. The ocean is the opposite – it’s the darkest natural surface on the planet and reflects just 10% of radiation (it has an albedo of 0.1). In winter, the Arctic Ocean, which covers the North Pole, is covered in sea ice and that sea ice has an insulating layer of snow on it. It’s like a huge, bright thermal blanket protecting the dark ocean underneath. As temperatures rise in spring, sea ice melts, exposing the dark ocean underneath, which absorbs even more solar radiation, increasing warming of the region, which melts even more ice. This is a positive feedback loop which is often referred to as the ice-albedo feedback mechanism.

Melting Arctic sea ice is increasing warming in the region.
Jonathan Bamber, Author provided

This ice-albedo (really snow-albedo) feedback is particular potent in the Arctic because the Arctic Ocean is almost landlocked by Eurasia and North America, and it’s less easy (compared to the Antarctic) for ocean currents to move the sea ice around and out of the region. As a result, sea ice that stays in the Arctic for longer than a year has been declining at a rate of about 13% per decade since satellite records began in the late 1970s.

In fact, there is evidence to indicate that sea ice extent has not been this low for at least the last 1,500 years. Extreme melt events over the Greenland Ice Sheet, that used to occur once in every 150 years, have been seen in 2012 and now 2019. Ice core data shows that the enhanced surface melting on the ice sheet over the past decade is unprecedented over the past three and a half centuries and potentially over the past 7,000 years.

In other words, the record-breaking temperatures seen this summer in the Arctic are not a “one-off”. They are part of a long-term trend that was predicted by climate models decades ago. Today, we’re seeing the results, with permafrost thaw and sea ice and ice sheet melting. The Arctic has sometimes been described as the canary in the coal mine for climate breakdown. Well it’s singing pretty loudly right now and it will get louder and louder in years to come.The Conversation

——————————-
This blog is written by Cabot Institute member Jonathan Bamber, Professor of Physical Geography, University of BristolThis article is republished from The Conversation under a Creative Commons license. Read the original article.

Professor Jonathan Bamber

Predicting the hazards of weather and climate; the partnering of Bristol and the Met Office

Image credit Federico Respini on Unsplash

When people think of the University of Bristol University, or indeed any university, they sometimes think of academics sitting in their ivy towers, researching into obscurities that are three stages removed from reality, and never applicable to the world they live in. Conversely, the perception of the Met Office is often one of purely applied science, forecasting the weather; hours, days, and weeks ahead of time. The reality is far from this, and today, on the rather apt Earth Day 2020, I am delighted to announce a clear example of the multidisciplinary nature of both institutes with our newly formed academic partnership.

This new and exciting partnership brings together the Met Office’s gold standard weather forecasts and climate projections, with Bristol’s world leading impact and hazard models. Our partnership goal is to expand on the advice we already give decision makers around the globe, allowing them to make evidence-based decisions on weather-related impacts, across a range of timescales.

By combining the weather and climate data from the Met Office with our hazard and impact models at Bristol, we could, for instance, model the flooding impact from a storm forecasted a week ahead, or estimate the potential health burden from heat waves in a decade’s time. This kind of advanced knowledge is crucial for decision makers in many sectors. For instance, if we were able to forecast which villages might be flooded from an incoming storm, we could prioritise emergency relief and flood defenses in that area days ahead of time. Or, if we projected that hospital admissions would increase by 10% due to more major heatwaves in London in the 2030s, then decision makers could include the need for more resilient housing and infrastructure in their planning. Infrastructure often lasts decades, so these sorts of decisions can have a long memory, and we want our decision makers to be proactive, rather than reactive in these cases.

While the examples I give are UK focussed, both the University of Bristol and the Met Office are internationally facing and work with stakeholders all over the world. Only last year, while holding a workshop in the Caribbean on island resilience to tropical cyclones; seeing the importance of our work the prime minister of Jamaica invited us to his residence for a celebration. While I don’t see this happening with Boris Johnson anytime soon, it goes to show the different behaviours and levels of engagement policy makers have in different countries. It’s all very well being able to do science around the world, but if you don’t get the culture, they won’t get your science. It is this local knowledge and connection that is essential for an international facing partnership to work, and that is where both Bristol and the Met Office can pool their experience.

To ensure we get the most out of this partnership we will launch a number of new joint Bristol-Met Office academic positions, ranging from doctoral studentships all the way to full professorships. These positions will work with our Research Advisory Group (RAP), made up of academics across the university, and be associated with both institutes. The new positions will sit in this cross-disciplinary space between theory and application; taking a combined approach to addressing some of the most pressing environmental issues of our time.

As the newly appointed Met Office Joint Chair I will be leading this partnership at Bristol over the coming years, and I welcome discussions and ideas from academics across the university; some of the best collaborations I’ve had have come from a random knock on the door, so don’t be shy in sharing your thoughts.

———————————
This blog is written by Dr Dann Mitchell – Met Office Joint Chair and co-lead of the Cabot Institute for the Environment’s Natural Hazards and Disaster Risk research.
You can follow him on Twitter @ClimateDann.

Dann Mitchell

Climate-driven extreme weather is threatening old bridges with collapse

The recent collapse of a bridge in Grinton, North Yorkshire, raises lots of questions about how prepared we are for these sorts of risks. The bridge, which was due to be on the route of the cycling world championships in September, collapsed after a month’s worth of rain fell in just four hours, causing flash flooding.

Grinton is the latest in a series of such collapses. In 2015, first Storm Eva and then Storm Frank caused flooding which collapsed the 18th century Tadcaster bridge, also in North Yorkshire, and badly damaged the medieval-era Eamont bridge in nearby Cumbria. Floods in 2009 collapsed or severely damaged 29 bridges in Cumbria alone.

With climate change making this sort of intense rainfall more common in future, people are right to wonder whether we’ll see many more such bridge collapses. And if so – which bridges are most at risk?

In 2014 the Tour de France passed over the now-destroyed bridge near Grinton. Tim Goode/PA

We know that bridges can collapse for various reasons. Some are simply old and already crumbling. Others fall down because of defective materials or environmental processes such as flooding, corrosion or earthquakes. Bridges have even collapsed after ships crash into them.

Europe’s first major roads and bridges were built by the Romans. This infrastructure developed hugely during the industrial revolution, then much of it was rebuilt and transformed after World War II. But since then, various factors have increased the pressure on bridges and other critical structures.
For instance, when many bridges were first built, traffic mostly consisted of pedestrians, animals and carts – an insignificant load for heavy-weight bridges. Yet over the decades private cars and trucks have got bigger, heavier and faster, while the sheer number of vehicles has massively increased.

Different bridges run different risks

Engineers in many countries think that numerous bridges could have reached the end of their expected life spans (between 50-100 years). However, we do not know which bridges are most at risk. This is because there is no national database or method for identifying structures at risk. Since different types of bridges are sensitive to different failure mechanisms, having awareness of the bridge stock is the first step for an effective risk management of the assets.


Newcastle’s various bridges all have different risks. Shaun Dodds / shutterstock

In Newcastle, for example, seven bridges over the river Tyne connect the city to the town of Gateshead. These bridges vary in function (pedestrian, road and railway), material (from steel to concrete) and age (17 to 150 years old). The risk and type of failure for each bridge is therefore very different.

Intense rain will become more common

Flooding is recognised as a major threat in the UK’s National Risk Register of Civil Emergencies. And though the Met Office’s latest set of climate projections shows an increase in average rainfall in winter and a decrease in average rainfall in summer, rainfall is naturally very variable. Flooding is caused by particularly heavy rain so it is important to look at how the extremes are changing, not just the averages.

Warmer air can hold more moisture and so it is likely that we will see increases in heavy rainfall, like the rain that caused the flash floods at Grinton. High resolution climate models and observational studies also show an intensification of extreme rainfall. This all means that bridge collapse from flooding is more likely in the future.

To reduce future disasters, we need an overview of our infrastructure, including assessments of change of use, ageing and climate change. A national bridge database would enable scientists and engineers to identify and compare risks to bridges across the country, on the basis of threats from climate change.


This blog is written by Cabot Institute member Dr Maria Pregnolato, Lecturer in Civil Engineering, University of Bristol and Elizabeth Lewis, Lecturer in Computational Hydrology, Newcastle University.  This article is republished from The Conversation under a Creative Commons license. Read the original article.

UK Climate Projections 2018: From science to policy making

On a sunny day earlier this week, I attended the UK Climate Projections 2018: From science to policy making, meeting in Westminster on behalf of the Cabot Institute. Co-hosted by the All-Party Parliamentary Climate Change Group and the UK Met Office, the main purpose of this event was to forge discussions between scientists involved in producing the latest UK Climate Projections (UKCP18) and users from various sectors about the role of UKCP18 in increasing the UK’s preparedness of future climate change.

Many people in my constituency come and ask about climate change every day.

The event began with an opening remark by Rebecca Pow, the MP for Taunton Deane in Somerset. Somerset has seen some devastating floods over the years, and a new land drainage bill was passed a week prior to manage flood risk in the area. Constantly faced with questions from her constituents about climate change, Rebecca is particularly interested in regional climate change, both at present and in the future, and any opportunities that may arise from it.

Everyone would like a model of their back garden.

Prof Sir Brian Hoskins, the Founding Director and Chair of the Grantham Institute for Climate Change and the Environment, and Professor in Meteorology at the University of Reading, gave an overview on climate projection. He listed three main sources of uncertainty in 21st century climate projection: internal variability, model uncertainty, and human activity uncertainty. Climate scientists deal with these uncertainties by using large ensembles of simulations, a range of climate models, and a range of climate scenarios. However, there is always tension between model resolution, complexity and the need for many model runs in global climate projections due to constraints in computer resources. Regional climate models can be embedded in global domains to provide local weather and climate information, but they cannot correct large scale errors. The peer-reviewed UKCP18 provide both the statistics of global climate by combining data from different climate models and runs, and regional daily data for the UK and Europe.

A greater chance of warmer, wetter winters and hotter, drier summers.

This was one of the headline results from UKCP18 shown by Prof Jason Lowe, Head of Climate Services for Government at the Met Office Hadley Centre. UKCP18 is an update from its predecessor, UKCP09, but with constraints from new observations and data from more climate models from around the world. The horizontal resolution of regional climate projections for the UK and Europe has increased from 25 km in UKCP09 to 12 km in UKCP18, with an even higher resolution (2.2 km) dataset coming out in summer 2019. UKCP18 results show that all areas of the UK are projected to experience warming, with greater warming in the summer than the winter. Summer rainfall is expected to decrease in the UK, whereas winter precipitation is expected to increase. However, when it rains in summer it may rain harder. Sea-level rise will continue under all greenhouse gas emission scenarios at all locations around the UK, impacting extreme water levels in the future.

Heat and health inter-connections are complex.

Prof Sarah Lindley, Professor of Geography at the University of Manchester, shared how UKCP18 could be used to study the health effects of climate change and urban heat in the UK. Many of us would remember how hot it was last summer; by 2050, hot summers of that type may happen every other year, even under a low greenhouse gas emission scenario. The most extreme heat-related hazards are in cities due to the Urban Heat Island effect (UHI), i.e. urban areas are often warmer than surrounding rural areas. For instance, Manchester’s UHI intensity (difference between urban and rural temperatures) has increased significantly since the late 1990s. By the end of this century, the city of Manchester is projected to be 2.4ºC warmer than its surrounding rural area in a UKCP09 medium emission scenario. With an aging population, UK’s vulnerability to heat may increase in the future. Both exposure and vulnerability to heat contribute to heat disadvantage. High-resolution UKCP18 data, together with social vulnerability maps of the UK, provide new opportunities to heat disadvantage and adaptation research.

European birds will need to shift about 550 km north-east under 3ºC warming.

The next speaker was Dr Olly Watts, Senior Climate Change Policy Officer for the RSPB, the largest nature conservation charity in the UK. Climate adaptation is an important aspect of nature conservation work, as it should be in everyone’s work. The Climatic Atlas of European Breeding Birds finds that not only will European birds shift 550 km under a likely 3ºC increase in global average temperature, but also a quarter of the bird species will be at high risk. Currently 5000 bird species are changing species distribution, and they face an uncertain future. The UKCP18 data of 2-4ºC warmer worlds could be used to derive qualitative strategies to build wildlife resilience against climate change. Adaptation strategies including informing nature reserve management will be in place across the RSPB conservation programme. The RSPB will also use UKCP18 data to raise public awareness of climate change.

Water demand can increase by 30% on a hot day.

Dr Geoff Darch, Water Resources Strategy Manager at Anglian Water, began his talk by highlighting the inherent climate vulnerabilities in water management in the East of England. It is a “water stressed” region that has low lying and extensive coastline, sensitive habitats, and vulnerable soils. On a hot day, water demand can go up by 30%. Climate change alone is expected to have a total impact of 55 Ml/day on water supplies in the region by 2045. A growing risk of severe drought means an additional impact of 26 Ml/day is expected, not to mention the impacts of population growth. The water industry is proactively adapting to these challenges by setting up plans to reduce leakage and install smart meters for customers. UKCP09 has been used extensively for climate change risk assessment across the water sector; the latest UKCP18 could be used in hydrological modelling, demand modelling, storm impact modelling, flood risk assessment, and sensitivity testing to assess the robustness of water resources management solutions under a range of climate scenarios.

————————————-
This blog was written by Cabot Institute member Dr Eunice Lo, from the School of Geographical Sciences at the University of Bristol. Her research focusses on climate change, extreme weather and human health.

Dr Eunice Lo


Coconuts and climate change

Before pursuing an MSc in Climate Change Science and Policy at the University of Bristol, I completed my undergraduate studies in Environmental Science at the University of Colombo, Sri Lanka. During my final year I carried out a research project that explored the impact of extreme weather events on coconut productivity across the three climatic zones of Sri Lanka. A few months ago, I managed to get a paper published and I thought it would be a good idea to share my findings on this platform.

Climate change and crop productivity

There has been a growing concern about the impact of extreme weather events on crop production across the globe, Sri Lanka being no exception. Coconut is becoming a rare commodity in the country, due to several reasons including the changing climate. The price hike in coconuts over the last few years is a good indication of how climate change is affecting coconut productivity across the country. Most coconut trees are no longer bearing fruits and those that do, have nuts which are relatively very small in size.

Coconut production in Sri Lanka

Sri Lanka is among the top 5 largest producers of coconut, alongside Indonesia, Philippines, India and Brazil (FAOSTAT, 2014). Coconut is one of the major plantation crops in Sri Lanka and is second only to rice in providing nutrition (Samita & Lanka, 2000). Coconut cultivation represents 1/5th of the agricultural land of the country and significantly contributes to Sri Lanka’s Gross Domestic Product, export earnings and employment (Fernando et al., 2007).

Mature coconuts develop approximately eleven months after inflorescence opening (Figure 1). Of this, the first three months after inflorescence opening is said to be the most critical period as the young nuts are susceptible to climatic variation (Ranasinghe et al., 2015).

Figure 1: Development stages of a coconut bunch (Source: Coconut Research Institute, Sri Lanka)

The coconut yield is influenced by climatic variables such as rainfall, temperature and relative humidity in addition to other external factors such as pest attacks, diseases, crop management, land suitability and nutrient availability (Peiris et al., 2008). Optimum weather conditions for the growth of coconut include a well distributed annual rainfall of about 1500 mm, a mean air temperature of 27°C and relative humidity of about 80-90% (Peiris et al., 1995).

Impact of extreme weather on coconut productivity

Our study analysed the impact of extreme weather events considering daily temperature and rainfall over a 21-year period (between 1995 and 2015) at selected coconut estates in the wet, dry and intermediate zones of Sri Lanka. The study revealed drought conditions during the first four months after inflorescence opening, had a negative impact on the coconut harvest in the dry and intermediate zones (as revealed by the statistical analyses and the model relationships developed in this study). Possible reasons for this include reduced pollen production due to the exposure of male flowers to elevated temperature (Burke, Velten, & Oliver, 2004) and flower and fruit abortions caused by high temperatures and absence of rainfall over an extended period of time (Nainanayake et al., 2008).

Drought conditions not only disrupt the physiological functions of the coconut palm, but also
contribute to incidences of pest attacks. At present, the Coconut Black Beetle and the Coconut Red
Weevil pose the greatest threat to coconut plantations in Sri Lanka. Drought conditions are very
conducive for Coconut Black Beetles to pupate deep in the soil (Nirula, 1955).

Implications of the findings

This study reinforces the importance of raising awareness on the implications of climate change on crop productivity. During my visits to the coconut plantations, the superintendents of the estates as well as the labourers appeared to be aware of the warming trend of the climate. They had adopted soil moisture conservation methods such as mulching, burying coconut husks and growing cover crops to prevent extreme evapotranspiration. These are short term solutions. If we are to think about sustaining the coconut cultivation in the long-term, it is important to focus our efforts on developing drought tolerant hybrids. Global climate is projected to change continuously due to various natural and anthropogenic reasons. Policy makers and market decision makers can utilize the knowledge on how coconuts respond to drought conditions to formulate better policies and prices. This information can enable us to be better prepared and minimize loss and damage caused by a drought resulting from climate change.

References

Burke, J. J., Velten, J., & Oliver, M. J. (2004). In vitro analysis of cotton pollen germination. Agronomy Journal, 96(2), 359–368.

FAOSTAT. (2014). Retrieved January 7, 2017, from http://www.fao.org/faostat/en/#data/QC/visualize

Fernando, M. T. N., Zubair, L., Peiris, T. S. G., Ranasinghe, C. S., & Ratnasiri, J. (2007). Economic Value of Climate Variability Impacts on Coconut Production in Sri Lanka.

Nainanayake, A., Ranasinghe, C. S., & Tennakoon, N. A. (2008). Effects of drip irrigation on canopy and soil temperature, leaf gas exchange, flowering and nut setting of mature coconut (Cocos nucifera L.). Journal of the National Science Foundation of Sri Lanka, 36(1), 33–40.

Nirula, K. K. (1955). Investigations on the pests of coconut palm. Part II Oryctes rhinoceros L. Indian Coconut Journal, 8(4), 30–79.

Peiris, T. S. G., Hansen, J. W., & Zubair, L. (2008). Use of seasonal climate information to predict coconut
production in Sri Lanka. International Journal of Climatology, 28, 103–110. http://doi.org/10.1002/joc

Peiris, T. S. G., Thattil, R. O., & Mahindapala, R. (1995). An analysis of the effect of climate and weather on coconut (Cocos nucifera). Journal of Experimental Agriculture, 31, 451–460.

Ranasinghe, C. S., Silva, L. R. S., & Premasiri, R. D. N. (2015). Major determinants of fruit set and yield fluctuation in coconut (Cocos nucifera L .). Journal of National Science Foundation of Sri Lanka, 43(3), 253–264.

Samita, S., & Lanka, S. (2000). Arrival Dates of Southwest Monsoon Rains – A Modeling Approach. Tropical Agricultural Research, 12, 265–275.

Acknowledgements: This post is based on a paper published with the support and guidance from my supervisors/ co-authors Dr Erandi Lokupitiya (University of Colombo, Sri Lanka), Dr Pramuditha Waidyarathne (Coconut Research Institute, Sri Lanka) and Dr Ravi Lokupitiya (University of Sri Jayewardenepura, Sri Lanka). 

———————————-
This blog is written by Cabot Institute member Charuni Pathmeswaran.
Charuni Pathmeswaran

Play stops rain: could ‘cloud seeding’ deliver perfect Wimbledon weather?

Image credit: Carine06, Wikimedia Commons

Wimbledon, 2026. Bright blue skies and a wonderful late afternoon sun lights up the lush green grass of centre court. Out strides the British number one and four-time winner, Andy Henman, to the cheers of the excitable, partisan crowd.

Somewhere nearby, at the headquarters of WeatherMod Inc, a group of technicians are busily checking data, confident that their efforts have worked. They have been in contact with two pilots who have just completed their spray sorties and are returning to land at Heathrow’s new third runway. Thanks to the delivery of 4kg of, in its pure form, a yellowish powder known as Silver Iodide (AgI) into clouds upwind of London, it is now raining over the Salisbury Plain, 100 miles away, and the rain predicted for later in SW19 is now 92% less likely.

This scenario probably sounds a little far-fetched, and not least the bit about the repeatedly successful home-grown tennis player. However, weather modification occurs more often than most people are aware. For example, as I wrote that first paragraph I genuinely didn’t realise that a Weather Modification Incorporated actually already exists in Fargo, North Dakota. They, and other companies like them have sprung up over the past few years promising to manage water for crops, clear fog and even protect wedding days from ill-timed hail.

But two questions need further investigation to consider the likelihood of the above scenario at Wimbledon: can we do it (that is, does it work) and should we do it? Neither, it turns out, are particularly easy to answer.

Changing the weather

In order to make rain several processes need to occur. First, small particles known as cloud condensation nuclei (CCN) are required onto which water can condense. Then these droplets need to grow to a size where they precipitate out of the cloud, finally falling where and when required.

In our hypothetical scenario we would therefore need to be able to either control or at least predict accurately the concentration of CCN, the rate at which droplets form, and the evaporation rates within the clouds. We’d also also need to have some handle on the rate and direction in which rain would fall.

Silver iodine dumped into a cloud attracts water, which turns into rain.
Smcnab386 / wiki, CC BY-SA

In reality, cloud seeding with AgI – the current default option – only really tackles the first of these processes, forming the condensation nuclei. Even if clouds are seeded, it is still a matter of debate as to whether they actually create much additional rain. While companies claim success, some scientists are more wary. Although other seeding agents (and methodologies) exist, it is worth noting that, in the case of AgI, the nature of the clouds into which the particles are injected will govern the outcome.

Seeding works best in clouds which have a pre-existing mixture of water droplets and ice, as this type of nucleation requires ice-crystals to form. Following the production of CCN we’d then need to be able to predict, through computer modelling, how small droplets will form into rain and eventually fall.

One of the major drawbacks of cloud seeding is a lack of proof that it works: given weather forecasting remains imperfect, how would you know what would have happened without intervention? The second part of the question is arguably even harder to approach. What are the ethics of removing water from one part of the world, even on a small scale, and moving it somewhere else? Is this “messing with nature” or “playing God”? Water is, after all, the most precious commodity on Earth.

Let’s assume for now that it is possible to alter local weather patterns and to prevent or cause rain. This could be used for both good and evil, and the potential for abuse is worth considering. While manipulating the weather as a weapon is now explicitly outlawed by the UN’s ENMOD treaty, there have been efforts to alter the outcome of conflict using cloud seeding.

‘Operation Popeye’: the US used cloud-seeding to extend the monsoon season during the Vietnam war, causing delays on the waterlogged Ho Chi Minh Trail.
manhhai, CC BY

Deliberate and accidental effects from commercial activity also seem possible. That dreamy, rain-free wedding ordered up by an anxious billionaire could easily ruin a school sports day in a nearby town.

The question of attribution is possibly the most challenging. Without any alternative outcomes to analyse, how can you really know what are the impacts from your actions. Some even say, quite incorrectly, that cloud seeding experiments caused floods, such as those that killed 35 people in the English village of Lynmouth in 1952. Expert opinion leans strongly against that idea being correct. Nonetheless, conspiracy theories persist. If, in our hypothetical Wimbledon scenario, bits of Wiltshire flooded, who would foot the bill?

It’s certainly possible in theory to prevent rain in one place by using cloud seeding to induce it in another, upwind. But there are huge challenges and the jury is still out about whether such efforts really work.

There are some very good causes, such as inducing rainfall in Sub-Saharan Africa during drought, where I would sanction intervention. For something as frivolous as a sporting event I feel differently. Just last weekend I played cricket for four hours in unrelenting drizzle (thanks Skip). While not a massively enjoyable experience it was at least familiar, and is part of the essence of both cricket and tennis. There’s some comfort in that.

—————————————————-
The Conversation

This blog is by Matthew Watson, Reader in Natural Hazards at the University of Bristol.
This article was originally published on The Conversation. Read the original article.

Matthew Watson

Sharing routine statistics must continue post-Brexit when tackling health and climate change

Post-Brexit vote, we are posting some blogs from our Cabot Institute members outlining their thoughts on Brexit and potential implications for environmental research, environmental law and the environment.  
————————————————

It has been argued that one of the EU’s major contributions has been its legislation regarding environmental protection. Some of these bear directly on human health (for example, concerning air pollution levels). Looking forwards, moves to adapt and mitigate the effects of climate change may be greatly facilitated by sharing data on emerging trends across Europe.

An excellent example is provided by analysis carried out on “excess winter deaths” across Europe. Every country in the world displays seasonal patterns of mortality whereby more deaths occur in winter than at other times of year. However the extent of this excess varies between countries even within Europe. Intuitively one might have expected the excess to be greater in countries where winter temperatures are more extreme, yet this is not so. Healy (2003) used data from 14 European countries to demonstrate that in 1988-97, the relative Excess Winter Deaths Index (EWDI) was greatest for Portugal, where the mean winter temperature was highest. Conversely Finland with the lowest mean winter temperature showed the lowest EWDI. Data on mortality were available from the United Nations Statistics Databank and the World Bank, as well as some macro-economic indicators, but Healy also availed himself of the European Community Household Panel survey on socioeconomic indicators and housing conditions. This revealed that high EWDI was associated with lower expenditure on public health per head of population, as well as income poverty, inequality, deprivation, and fuel poverty. Furthermore, several indicators of residential thermal standards appeared to carry influence, whereby countries where houses had better insulation experienced lower EWDI.

A similar study was reported in 2014 by Fowler et al, partly as an update of Healy’s work, this time on 31 countries across Europe for the years 2002-11. The same geographic pattern still seemed to be present, with southern European countries faring worse in terms of winter deaths. However a few countries such as Greece, Spain and Ireland demonstrated a reduction in their EWDI. It is possible that Healy’s study had highlighted the need for improvement in those countries. All 27 countries who by that time were members of the European Union were included in analysis, and use was made of the Eurostat database.

In view of the projected increases in global temperature in coming decades, it might be hoped that the problem of excess deaths in winter will gradually disappear from Europe. Yet the greater susceptibility of warmer European countries to winter deaths compared with colder countries suggests such an assumption may be mistaken. It will be important for carefully collected routine data to be analysed, to investigate any changes in the patterns previously seen in Europe.

My colleagues and I were led to consider whether relatively low temperatures were more threatening to older people than absolute temperature level, and whether this might hold for individuals, as well as at a national level as highlighted by Healy’s and Fowler et al’s studies. We carried out analyses of two European cohort studies, of around 10,000 people aged 60 or over, followed over 10 years. Using daily temperature data for the localities of where these participants lived, we investigated weather patterns experienced by those who suffered major heart attacks and strokes. There was some evidence that cold spells (cold in relation to the month of the year) increased people’s risk over a 3-4 day period. We hope to replicate this finding in other datasets.

Reflecting on the data used by Healy and Fowler et al, it is noticeable that most (though not all) came from EU countries. Some of the data in Healy’s study was held by the United Nations or World Bank. Yet the Eurostat database was a major contributor to these enlightening analyses. Eurostat was established as long ago as 1953, initially to meet the requirements of the Coal and Steel Community. Over the years its task has broadened, and when accessed on 29 June 2016 displayed detailed comparative data on many domains including aspects of health.

It would be deeply disappointing as well as surprising if the UK were in future to withhold such valuable information, or conversely if such pan-European data were to become unavailable to UK-based researchers. This would seem unlikely, as Eurostat seems to draw upon data from EFTA nations as well as the EU, and advertises its data as freely available. It behoves the UK research community to continue to use these valuable data in a collaborative way with EU-based partners, and also to encourage continuing provision of UK data so that our EU-colleagues (both academics and policymakers) may benefit from this common enterprise.

——————————————-
This blog is by Professor Richard Morris, from the University of Bristol’s School of Social and Community Medicine.  Richard’s research focuses around statistics applied to epidemiology, primary care and public health research.

A shower of change with gusts of discontent

“This is 2LO calling, the London station of the British Broadcasting Company calling. This is 2LO calling”

Such was the first broadcast ever issued by the BBC on 14th November 1922 from the organisation’s 2LO Office in London. The message was received by any radio within a 30 mile radius and was the inaugeration of the British Broadcasting Corporation.  Integrated in the announcement was a weather bulletin prepared by the Met Office which marked the beginning of a partnership which has supplied the British public’s appetite for weather-related conversation for 93 years.

Despite the longevity of this relationship, it was not immune to the BBC’s ever-tightening pockets and last month it was announced the Met Office is to become the latest casualty of the corporation’s modernisation. The BBC blames the split on the Met Office’s uncompetitive price, while rumours suggest that the problem runs deeper with a difference of opinion over the way the forecast should be communicated to the public. Those who are hoping the Met Office will be in the running for the re-tendering process are likely to be disappointed. The early rejection of the Met Office’s offer implies that more was at stake than just the money and any hope of a renewal is a low probability.

Whatever the outcome, the BBC weather forecast, which spans local news to the world service, is estimated to reach a quarter of a billion people weekly and the changes are certain to have an impact on how the world watches the weather. The Met Office is ranked as the world’s most accurate forecasting body, so is the BBC sacrificing it’s credibility on the alter of austerity? Or could there be a sunny outlook?

There are plenty of alternatives to the Met Office, with Dutch and New Zealand firms rumoured to be in the running for the £35.2 million contract. This, it seems, is adding insult to injury for some disgruntled members of the British public with cries of discontent along the lines of ‘Heaven forbid a foreign firm should predict the British weather; how could they possibly understand it’s temperamental disposition?’ (the fact that the majority of the UK’s weather is governed by global climate systems seems to be irrelevant in this). Even if the BBC resolves to look closer to home, there is a reasonable list of UK alternatives; The Weather Channel, Net Weather and The Weather Outlook to name a few although whether they have the capability to handling the BBCs expansive demands is a different matter altogether.

As the storm clouds gather over BBC HQ, the new provider will be announced next year after the tendering process. In short, it is uncertain who will be giving Britons their daily weather-fix although there is no doubt the BBC will be battening down the hatches to endure yet another tornado of discontent from license payers when the replacement made. Personally, I’ve never felt the weather pays much attention to the forecast regardless of the provider: In fact, the element of surprise is what makes being caught in the rain in my flip flops and snowed on in my swimsuit part of the paradoxical joy of inhabiting this country. Long may it continue I say.

——————————————————————–

This blog is written by Cabot Institute member Keri McNamara, a PhD student in the School of Earth Sciences at the University of Bristol.

Weathermen of Westeros: Does the climate in Game of Thrones make sense?

The climate has been a persistent theme of Game of Thrones ever since Ned Stark (remember him?) told us “winter is coming” back at the start of season one. The Warden of the North was referring, of course, to the anticipated shift in Westerosi weather from a long summer to a brutal winter that can last for many years.

An unusual or changing climate is a big deal. George R R Martin’s world bears many similarities to Medieval Europe, where changes to the climate influenced social and economic developments through impacts on water resources, crop development and the potential for famine.

We’re interested in whether Westeros’s climate science adds up, given what we’ve learned about how these things work here on Earth.

It’s not easy to understand the mechanisms driving the climate system given we can’t climb into the Game of Thrones universe and take measurements ourselves. It’s hard enough to get an accurate picture of what’s driving the world’s climate even with many thousands of thermometers, buoys and satellite readings all plugging data into modern supercomputers – a few old maesters communicating by raven are bound to struggle.

The fundamental difference between our world and that of Westeros is of course the presence of seasons. Here on Earth, seasons are caused by the planet orbiting around the sun, which constantly bombards us with sunlight. However the amount of sunlight received is not the same throughout the year.


You won’t see this in Westeros. Rhcastilhos

If you imagine the Earth with a long pole through its centre (with the top and bottom of the pole essentially the North and South Pole) and then tilt that by 23.5 degrees, the amount of sunlight received in the Northern and Southern Hemispheres will change throughout the year as the Earth orbits the Sun.

Clearly the unnamed planet on which Game of Thrones is set is missing this axis tilt – or some other crucial part of Earth’s climate system.

How longer seasons might work

The simplest explanation could be linked to spatial fluctuations in solar radiation (sunlight) received at the surface. A reduction in incoming solar radiation would mean more snow and ice likely remaining on the ground during the summer in Westeros’s far north. Compared to the more absorbent soil or rock, snow reflects more of the Sun’s energy back out to space where in effect it cannot warm the Earth‘s surface. So more snow leads to a cooler planet, which means more snow cover on previously snow-free regions, and so on. This process is known as the snow albedo feedback.

The collapse of large ice sheets north of the Wall could also rapidly destabilise ocean circulation, reducing northward heat transport and leading to the encroachment of snow and ice southwards towards King’s Landing.


What if all this ice suddenly melted? HBO

To descend into glacial conditions would require a large decrease in solar radiation received at certain locations on the Earth’s surface and likewise an increase would be needed to return to warmer conditions.

This is roughly what happened during the switches between “glacial” and “interglacial” (milder) conditions throughout the past million years on Earth. This is controlled primarily by different orbital configurations known as “Milankovitch cycles”, which affect the seasonality and location of sunlight received on Earth.

However, these cycles are on the order of 23,000 to 100,000 years, whereas Game of Thrones seemingly has much shorter cycles of a decade or less.

When winter came back

Around 12,900 years ago there was a much more abrupt climate shift, known as the Younger Dryas, when a spell of near-glacial conditions interrupted a period of gradual rewarming after the last ice age peaked 21,000 years ago. The sudden thawing at the end of this cold spell happened in a matter of decades – a blink of an eye in geological terms – and led to the warm, interglacial conditions we still have today.


A particularly long and brutal winter? Younger Dryas
cooling is visible in Greenland ice core records.
 NOAA

Various different theories have tried to explain why this spike occurred, including the sudden injection of freshwater into the North Atlantic from the outburst of North American glacial lakes, in response to the deglaciation, which destabilised ocean circulation by freshening the water and reducing ocean heat transport to the North Atlantic Ocean, cooling the regional climate.
Less likely explanations include shifts in the jet stream, volcanic eruptions blocking out the sun, or even an asteroid impact.

The shift from the Medieval Warm Period to the Little Ice Age that began around 1300 AD represents a more recent, and more subtle, example of a “quick” climate change. Although the overall temperature change wasn’t too severe – a Northern Hemisphere decrease of around 1˚C compared with today – it was enough to cause much harsher winters in Northern Europe.
None of these events indicate the abrupt transitions from long summers to long winters as described in Game of Thrones – and they still all happen on a much longer timescale than a Westeros winter. However they do demonstrate how extreme climate shifts are possible even on geologically short timescales.

Regardless of the causes of the long and erratic seasons, winter in Westeros won’t be much fun. It may even make the struggle for the Iron Throne between the various factions seem irrelevant.
Indeed the House of Stark’s motto: “winter is coming” may have a lesson for us here on Earth. Anthropogenic climate change is one of the biggest challenges facing humankind today and if left unmitigated the potential environmental impact on society may be far greater than any global recession. Stop worrying about the Iron Throne, everyone, winter is coming.
————————————–
The Conversation
This blog has been written by Cabot Institute members Alex Farnsworth, a Postdoctoral Research Assistant in Climatology at University of Bristol and Emma Stone, a Research Associate in Climate History at University of Bristol.

This article was originally published on The Conversation. Read the original article.

Climate change in the media

This winter, devastating floods and extreme weather have battered the UK.  Similarly, we have been battered by an endless barrage of news, opinion and political grandstanding.  Encouragingly, a narrative is beginning to emerge that now is the time for disaster management not a complete dissection of our short- and long-term flood defense system (an opinion we have advocated ourselves). That is encouraging.

It is vital that the issue of climate change be a central part of that discussion. Climate change is one of the most profound challenges facing humanity – a challenge recognised by scientists, politicians, lawyers, businesses and even the military. However, it is a challenge associated with uncertain and complex consequences, with the most pernicious concerns not necessarily being climate change itself but how it exacerbates other issues, such as flooding but also food security, access to resources, the spread of disease and fostering conflict.  It cannot sit in isolation from the rest of the news, and it demands nuanced exploration by the media that facilitates the responsible formation of opinion and policy.

UK aid supplies are loaded onto HMS
Daring by UK military personnel in the
Philippines after Typhoon Haiyan.
Credit: Simon Davis/DFID/Flickr

Experts (including but certainly not limited to academics), the public and the media form a triangle around policy makers, ultimately influencing the decisions that our governments make.  Most government decision makers genuinely want to enact policies that will be beneficial, but they must make those decisions in a sometimes confusing storm of information and misinformation, opinions and ideology, and short-term political imperatives.  Therefore, experts, the public and the media should work together – although the members of the Cabot Institute provide advice directly to government, we must also help foster the political climate that allows the best, evidence-based decisions to be made.

Given the complexity of climate change issues, I have been pleased to see some parts of the media adopting a more sophisticated discussion of the topic. For example, fewer journalists have asked whether climate change ‘caused’ Typhoon Haiyan or the UK’s severe winter storms and more have asked how climate change might affect such events in the future and how that might impact food prices. More are discussing how the extreme winter will exacerbate the refugee crisis in Syria. These are subtle but important expansions of the media conversation that reveal an increasing understanding of probability and the multiplication of risk.

Credit: Jackl

However, media sins persist, many of them specific to climate change but arising more generally from the external factors that have transformed the entire industry over the past two decades: a need for ratings, a need to entertain, and (most damaging in the case of environmental issues) a rapid news cycle that is better at responding to current events than in depth analysis and long-term considerations.  This has been particularly illustrated by both the media and political reaction to the floods of this past winter.

Most frustrating is the persistence by some parts of the media in creating a debate on the scientific evidence for climate change – a debate that does not exist but presumably enhances the entertainment value of the discussion.  I’m not opposed to debate.  In fact, I am eager for more rigorous, fact-based debate on this and other issues.  This is where the academic community and media could come together and bring real value to our community. But it is deeply frustrating to become entrained in non-debates regarding the underlying physics of global warming and the greenhouse effect, when there are important discussions about how much warming will occur, what the consequences will be and the cost-benefit of different policy decisions.  To its credit, media coverage is increasingly moving in that direction and ongoing coverage much better reflects the balance of scientific opinion.

However, in the aftermath of big climate news events, such as the release of the Intergovernmental Panel on Climate Change (IPCC) report or a spate of unusually cold weather, this non-debate is resurrected.  At these times, it is frustrating that the media rarely acts as a moderator of baseless and factually incorrect claims – on both sides of the topic.  Lobbyists and pundits are allowed to repeatedly state that the IPCC report is ‘mumbo jumbo’  or that the science of climate change is a ‘conspiracy’.  It is not entirely the climate deniers who abuse evidence; some advocates for climate change action, with whom I am sympathetic, describe a ‘climate apocalypse’ or ‘climate breakdown’, fearsome concepts that upon scrutiny mean nothing scientifically.  Unfortunately, the policy of some organisations (I’m looking at you, USA Today) mandates that any editorial comment on climate change requires equal space for the opposite opinion; it is analogous to an editorial on the space programme being counterbalanced by an opinion from the Flat Earth Society. Some media agencies are adapting; Paul Thornton, the LA Times letters editor, refuses to run letters in the newspaper from some climate sceptics in order ‘to keep errors of fact off the letters page.’  There are important discussions to be had, but these will be forgotten if we become mired in debates over putative hoaxes, conspiracies or divine judgement of our hedonistic lifestyle.

One way forward is to bring more creativity to the conversation by bringing in new expert voices.  As with many other policy debates, the climate change discussion has become ossified into rather turgid and unhelpful patterns: scientists vs sceptics, environmentalists vs business.  These are poor representations of the actual issue.  Insurance companies are deeply concerned about climate change.  Our military believes that climate change could exacerbate future conflicts.  Religious leaders believe that preventing climate change that disproportionately harms the poorest of the planet is an ethical issue.  I would urge the media to ignore the uninformed but highly opinionated partisans who put themselves out there, and instead seek out the quiet but knowledgable voices of those who truly understand the challenges facing us and have firsthand understanding of the economic and social consequences.  Similarly, I would urge the academic community to focus not only on our expertise – expertise that while deep is often narrow –and explore collective expertise with some of our partners.  We should be doing our part to invigorate the conversation by bringing together different cohorts of knowledge.

The most pernicious challenge, however, and one exemplified by the media coverage of the devastating floods that we have experienced this winter, is the fickle nature of the news cycle.  Climate change is covered in a sporadic and ad hoc manner – in the aftermath of a severe storm or the release of a new finding.  Climate change should not be headline news once a year but rather a continuous part of the news cycle, reflecting its widespread impact on our environment and lives. Encouragingly, this is the trend; a quick survey of the BBC website reveals that articles reflecting on climate change are published every few days.  What is missing is a more long-term perspective – how will climate change make typhoons worse in twenty years, how could it exacerbate unrest in parts of the world already stressed by ethnic or religious tensions, will it cause greater instability in global food markets? This is the information the public needs in order to make informed personal and political decisions.

Tamsin Edwards

This change in dialogue also requires a change within the academic community.  We tend to think about engagement in the same way that we think about our other academic outputs – discrete publications containing discrete results and leading to discrete press releases.  With a few notable exceptions, such as our own Tamsin Edwards, we are less skilled in commenting on the wider issues.  This partly occurs in IPCC reports, but that alone is insufficient because it is infrequent and a synthesis of the literature, such that it is less engaged with current events or specific ongoing policy decisions.

In short, academics need to recognise our roles as well-informed experts and enter the public dialogue.  There is an ongoing and legitimate debate whether climate change scientists should comment on specific policy, but it is glaringly evident that we should be injecting climate change into the conversation where it is relevant, on topics as far-ranging as flooding, land use and planning, sustainable energy, global insecurity and agricultural strategies.  We do not have all of the answers.  Sometimes our most important contribution is raising unasked questions.  We do not have to work alone; we can build coalitions of knowledge.   But no matter how we do it, we must work with the media – all parts of the media – to share what we have learned.

This blog is by Prof Rich Pancost, Director of the Cabot Institute.

Prof Rich Pancost