#CabotNext10 Spotlight on Water


Dr Katerina Michaelides

In conversation with Dr Katerina Michaelides, co-theme lead at the Cabot Institute

Why did you choose to become a theme leader at Cabot Institute?

I was particularly attracted to this role because I am strongly committed to increasing the visibility of the great water-related work going on in the University, and because I feel strongly about developing the water research community within Bristol and further afield. Over the years since its creation, Cabot Institute has been instrumental in developing my connections with others within the University, in fostering new collaborations and in encouraging new and creative avenues of research. In that same spirit, I relished the opportunity to perform a similar role within the Cabot Water theme and give back to the community by helping to foster collaborations, contacts, and new avenues of research. I believe in the Cabot mission and ethos and felt that I can help strengthen the Water theme in this more formal role.

In your opinion, what is one of the biggest global challenges associated with your theme? (Feel free to name others if there is more than one)

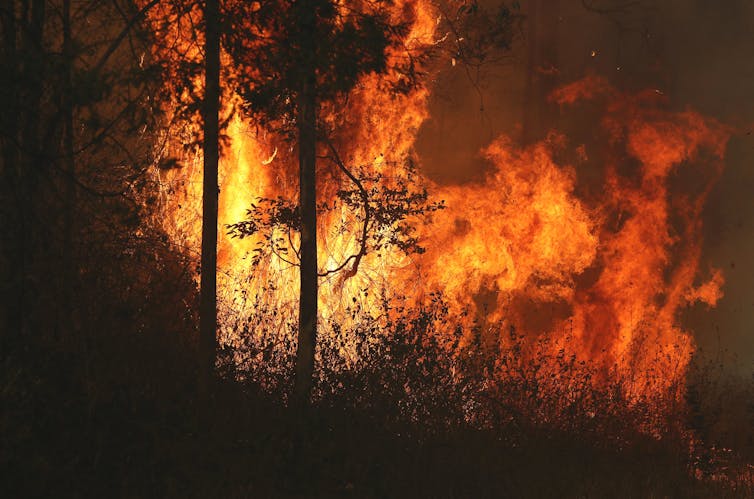
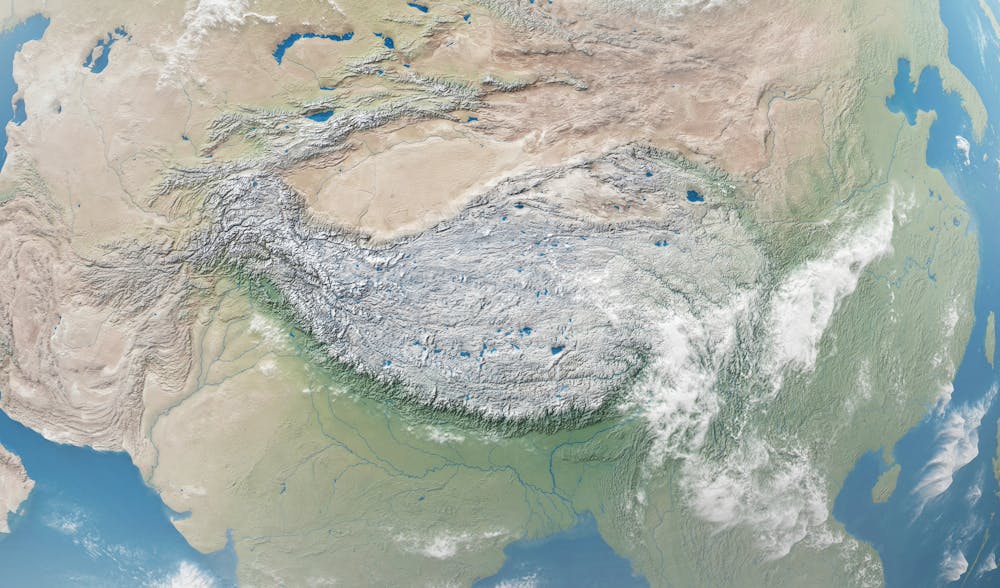
One of the biggest impacts of climate change is on the water cycle. In fact, climate change can be thought of as synonymous with changes in the water cycle with far reaching implications for lives and livelihoods. Think catastrophic storms, droughts, floods, declining water quality. Water is such a fundamental part of life that many in the global north take for granted. So if I was to say one biggest challenge, I would say: addressing global water scarcity and food insecurity challenges under climate change and anthropogenic pressures. There are of course, many other challenges….

Across the portfolio of projects in your theme, what type of institutions are you working with? (For example, governments, NGO’s)

Our theme members work with a huge range of non-academic institutions – from insurance companies, charities, climate services providers, NGOs, local businesses among others.

What disciplines are currently represented within your theme?

We have a broad set of disciplines within the Water theme. These range from water and sanitation, climate impacts on water balance, flood risk and hazard modelling, flooding and infrastructure resilience, freshwater biogeochemistry (water quality), hydrometeorology, dryland hydrology, tropical hydrology, hydrological modelling, forecasting floods and droughts, water, and humanities. And much more!

In your opinion, why is it important to highlight interdisciplinary research both in general and here at Bristol?

Global challenges related to water and climate impacts are inherently multi- and interdisciplinary in their nature. It starts from understanding how climate is changing, to how these changes impact the water balance on the ground hydrology) and may lead to destructive floods or devastating droughts through their effect on agriculture and drinking water. Ultimately, because water intersects society on so many different levels (from natural disasters, to agriculture, to water resources, to droughts) research needs to be interdisciplinary and consider both environmental and social aspects of the problem.

Are there any projects which are currently underway in your theme which are interdisciplinary that you believe should be highlighted in this campaign?

There are lots of interdisciplinary projects across the Water theme. Personally, our research focusses on water scarcity, as highlighted by these two projects below:

Drought Resilience in East African dryland Regions (DRIER) – This is a collaboration between hydrologists, climatologists, social scientists, livelihoods experts, climate adaptation experts. Awarded a Royal Society Grant of £500K for 2020-2023, with Bristol leading and colleagues from Cardiff, UEA, University of Nairobi, and Addis Ababa University. DRIER has been selected as case study for the Royal Society Challenge-Led grant scheme and by BEIS for the GCRF.

Mobile App Development for Drought Adaptation in Drylands (MADDAD) – This interdisciplinary project between hydrologists and computer scientists, funded by a GCRF Translational Award (2019-2021) is developing a mobile phone app to deliver water status forecasts to remote communities in Kenyan drylands. Under climate change droughts are set to become more intense and frequent and there is a pressing need for relevant, timely, and practical information about water resources, particularly with a view to climate change adaptation. However, rural agro-pastoral populations are sparse and distant from decision-making centres making it hugely challenging to disseminate useable information in a timely manner. The provision of a mobile phone app has the potential to transform decision-making and drought adaptation for a large number of people in remote, rural dryland regions of East Africa that currently do not have access to useable and relevant information about the short- and long-term changes in water scarcity in their location.

Down2Earth – Translation of climate information into multilevel decision support for social adaptation, policy development, and resilience to water scarcity in the Horn of Africa Drylands. Awarded an EU H2020 Grant of €6.7M for 2020-2024, with Cardiff University as the lead Institution and ~€1M to University of Bristol. In total, 15 Institutions across UK, EU, East Africa, are involved, including many non-academic actors. This project is completely multi-disciplinary in nature.

For more information, visit Water.

The case for case studies: a natural hazards perspective

As I wander the streets of Easton, as I have done over the last 18 months, the landscape becomes more and more familiar. Same streets, same skies. Things seem flat and still.

Living in this mundane landscape, I find it hard to believe that we live on a turbulent, roiling planet. But the Earth is not flat or still! Natural events happen daily, and extreme climatic events continue to escalate – although all we see in England is a rainy July. Some people are more vulnerable to the Earth’s vicissitudes than others. Since 2021 began, volcanoes in the Democratic Republic of Congo, Italy, Guatemala, and Iceland have erupted, and hurricanes have already gathered pace in the Atlantic. Many of these events have caused disaster for people living in these areas, losing homes, livelihoods, and lives.

Disasters erode and destroy, they leave scars and memories. We are fascinated by them: we seek to understand and to explain. How can we best do that? The case study is one way. Because of its in-depth nature, a case study is well-suited to describe disasters caused by natural hazards (earthquakes, volcanoes, landslides, floods, droughts), allowing us to tell a rich and nuanced story of events. However, we have to be prudent. There are many more natural hazards than we have scope to investigate. A good subject for a case study offers the possibility of new insights that other, limited methods have missed. Many, many times an earthquake or flood does not cause disaster. In choosing a good subject for a case study, we are looking for that event which is particularly interesting to us, and which we hope can tell us new things.

I am currently working on three case studies of disasters in Guatemala. Why and how did the disasters happen?

Coming from an Earth Sciences background, I’m not sure where to begin. There are no obvious blueprints. Why is there so little guidance on how to do a case study in our field? I think there are two reasons. Earth Sciences has always generously included other physical and social sciences (physics, chemistry, mathematics, geography), while a disaster caused by natural hazards involves both physical and social factors. So while this supports disaster’s suitability to the case study method, both science and subject use multiple philosophies and methods. It’s harder to make a cookbook with mixed methods. Secondly, Earth Sciences looks at the mutual interaction between people and nature, who operate on different timescales. Tracing a disaster through a case study requires uniting these timescales in a single narrative. That union is a difficult task and often context-specific, so not generalizable to a single blueprint. (Strangely, in an interdisciplinary case study of a disaster it’s the physical scientists who seem to study events over shorter timescales, for example on the physical triggers of a volcanic eruption. A few years ago in my undergraduate I remember tracing the story of Earth’s evolution across billions of years; now we’re operating over days and hours!)

There have been many criticisms levelled at case study research: that you can’t generalize from a single case, that theoretical knowledge is more valuable than practical knowledge, that case studies tend to confirm the researcher’s biases [1]. I have also read that case studies are excellent for qualitative research (e.g., on groups or individuals), but less so for quantitative research (e.g. on events or phenomena) [2]. I think these points are rubbish.

“You can’t generalize from a single case”, goes the argument against case studies. But generalization is not the point of a case study. We want to go deeper, to know more intimately, to sense in full colour. “Particularization, not generalization” is the point [1], and  intimate knowledge is worthwhile in itself. However, I also think the argument is false. Because it is such a rich medium, the case study affords us a wealth of observations and thus interpretations that allow us to modify our existing beliefs. As an example, a case study of the Caribbean island of Montserrat during an eruptive crisis showed Montserratians entering the no-go zone, risking their lives from the volcano to care for their crops and cattle [3]. This strongly changed the existing reasoning that people would prioritize their life over their livelihood during a volcanic eruption. How could you deny that this finding is not applicable beyond the specific case study? True, it isn’t certain to happen elsewhere, but the finding reminds us to research with caution and to challenge our assumptions. A case study might not give us a totally new understanding of an event, but it might refine our understanding – and that’s how most science progresses, both social and natural. This ‘refinement’ is also a balm for people like me who might be approaching a new case study with trepidation, concerned we might be going over old ground. Sure we might, but here we might forge a new path, there dig up fresh insights.

On the grounds of theoretical versus practical knowledge – we learn by doing! We are practical animals!

Context-dependent knowledge and experience are at the very heart of expert activity.

(Flyvbjerg, 2006) 

Does a case study confirm what we already expect to find? I think the possibility of refining our existing understanding can encourage researchers to keep our eyes open to distortions and bias. I think this final criticism comes from a false separation between the physical and social sciences. Qualitative research is held up as a contrast to “objective” quantitative research in the physical sciences, focussed on hypothesis-testing and disinterested truth. But any PhD student will tell you that the scientific process doesn’t quite work that way. Hypotheses are revised, created, and abandoned with new data, similar to how grounded theory works. And you can find any number of anecdotes where two scientists with the same data and methods came to two different interpretations. There is always some subjective bias as a researcher because (a) you’re also a human, and (b) because the natural world is inherently uncertain. (I wonder if this is an appeal for those who study pure maths – it’s the only discipline I can think of that is really objective and value-free).  Maybe qualitative/quantitative has some difference in the degree of researcher subjectivity. This would be a fascinating subject to explicitly include in those interdisciplinary case studies that involve both types of researcher – how does each consider their inherent bias towards the subject?

After flattening those objections above, I really want to make three points as to why case studies are so great.

First, they have a narrative element that we find irresistible. As Margaret Atwood said,

You’re never going to kill storytelling because it’s built into the human plan. We come with it.

A case study is not just a story, but it does have a story woven into its structure. Narratives are always partial and partisan; our case studies will be too. That’s not to say they can’t be comprehensive, just that they cannot hope to be omniscient. I love this quotation:

A story has no beginning or end: arbitrarily one chooses that moment of experience from which to look back or from which to look ahead.

Graham Greene, The End Of The Affair 

It certainly applies to case studies, too. We may find the roots of a disaster in political machinations which began decades before, or that the journey of a mudslide was hastened by years of deforestation. Attempting to paint the whole picture is futile, but you have to start somewhere.

Second, a case study provides a beautiful chance to both understand and to explain – the aims of the qualitative and the quantitative researcher, respectively. Each may approach truth and theory differently: the first sees truth as value-laden and theory to be developed in the field; the second, as objective and to be known before work is begun. It’s precisely because it’s difficult to harmonize these worldviews that we should be doing it – and the disaster case study provides an excellent arena.

Finally, the process of building a case study creates a space for dialogue. Ideas grow through conversation and criticism, and the tangle of researchers trying to reconcile their different worldviews, and of researchers reconciling their priorities with other interested people, seems both the gristle and the fat of case study research. In the case of disasters, I think this is the most important point which case study research wins. Research can uncover the most wonderful things but if it is not important to the people who are at risk of disaster, we cannot hope to effect positive change. How can we understand, and then how can we make ourselves understood? For all the confusion and frustration that it holds, we need dialogue [4]. A really beautiful example of this is the dialogue between volcano-watchers and scientists at Tungurahua volcano in Ecuador: creating a shared language allowed for early response to volcanic hazards and a network of friendships [5].

I’ve grappled with what products we should make out of these case studies. What are we making, and who are we making it for? From the above point, a valuable product of a case study can be a new relationship between different groups of people. This is not really tangible, which is hard to deal with for the researchers (how do you publish a friendship?) But a case study can produce a relationship that benefits both parties and outlasts the study itself. I think I’ve experienced this personally, through my work at Fuego volcano. I have found the opportunity to share my research and also to be transformed in my workings with local people. This has lasted longer than my PhD, I am still in touch with some of these people.

I believe in the power of case study to its own end, to create dialogue, and to mutually transform researcher and subject. And, if a new relationship is a valuable product of the case study, it is made stronger still by continued work in that area. To do that, the relationships and the ties that bind need to be supported financially and socially across years and uncertainty, beyond the current grey skies and monotony. When we are out, we will be able to renew that dialogue in person and the fruits of our labour will blossom.

[1] Flyvbjerg, 2006

[2] Stake, 1995

[3] Haynes et al., 2005

[4] Barclay et al., 2015

[5] Armijos et al., 2017

——————————-

This blog is written by Cabot Institute for the Environment member Ailsa Naismith from the School of Earth Sciences at the University of Bristol. Ailsa studies volcanic hazards in Central America.

Ailsa Naismith


Is extreme heat an underestimated risk in Bristol?

Evidence that the Earth is warming at an alarming rate is indisputable, having almost doubled per decade since 1981 (relative to 1880-1981). In many countries, this warming has been accompanied by more frequent and severe heatwaves – prolonged periods of significantly above-average temperatures – especially during summer months.

Heatwaves pose significant threats to human health including discomfort, heatstroke and in extreme cases, death. In the summer of 2003 (one that I am sure many remember for its tropical temperatures), these threats were clear. A European heatwave event killed over 70,000 people across the continent – over 2,000 of these deaths were in England alone. As if these statistics weren’t alarming enough, projections suggest that by 2050, such summers could occur every other year and by 2080, a similar heatwave could kill three times as many people.

Cities face heightened risks

Heat-health risks are not equally distributed. Cities face heightened risks due to the urban heat island (UHI) effect, where urban areas exhibit warmer temperatures than surrounding rural areas. This is primarily due to the concentration of dark, impervious surfaces. In the event of a heatwave, cities are therefore not only threatened by even warmer temperatures, but also by high population densities which creates greater exposure to such extreme heat.

UHIs have been observed and modelled across several of the UK’s largest cities. For example, in Birmingham an UHI intensity (the difference between urban and rural temperatures) of 9°C has been recorded. Some estimates for Manchester and London reach 10°C. However, little research has been conducted into the UK’s smaller cities, including Bristol, despite their rapidly growing populations.

Heat vulnerability

In the UK an ageing population implies that heat vulnerability will increase, especially in light of warming projections. Several other contributors to heat vulnerability are also well-established, including underlying health conditions and income. However, the relative influence of different factors is extremely context specific. What drives heat vulnerability in one city may play an insignificant role in another, making the development of tailored risk mitigation policies particularly difficult without location-specific research.

Climate resilience in Bristol

In 2018, Bristol declared ambitious intentions to be climate resilient by 2030. To achieve this, several specific targets have been put in place, including:

  • The adaptation of infrastructure to cope with extreme heat
  • The avoidance of heat-related deaths

Yet, the same report that outlines these goals also highlights an insufficient understanding of hotspots and heat risk in Bristol. This poses the question – how will Bristol achieve these targets without knowing where to target resources?

Bristol’s urban heat island

Considering the above, over the summer I worked on my MSc dissertation with two broad aims:

  1. Quantify Bristol’s urban heat island
  2. Map heat vulnerability across Bristol wards

Using a cloud-free Landsat image from a heatwave day in June 2018, I produced one of the first high-resolution maps of Bristol’s UHI (see below). The results were alarming, with several hotspots of 7-9°C in the central wards of Lawrence Hill, Easton and Southville. Maximum UHI intensity was almost 12°C, recorded at a warehouse in Avonmouth and Lawrence Weston. Though this magnitude may be amplified by the heatwave event, these findings still suggest Bristol exhibits an UHI similar to that of much larger cities including London, Birmingham and even Paris.

Image credit: Vicky Norton

Heat vulnerability in Bristol

Exploratory statistics revealed two principal determinants of an individual’s vulnerability to extreme heat in Bristol:

  1. Their socioeconomic status
  2. The combined effects of isolation, minority status and housing type.

These determinants were scored for each ward and compiled to create a heat vulnerability index (HVI). Even more concerning than Bristol’s surprising UHI intensity is that wards exhibiting the greatest heat vulnerability coincide with areas of greatest UHI intensity – Lawrence Hill and Easton (see below).

What’s also interesting about these findings is the composition of heat vulnerability in Bristol. Whilst socioeconomic status is a common determinant in many studies, the influential role of minority status and housing type appears particularly specific to Bristol. Unlike general UK projections, old age was also deemed an insignificant contributor to heat vulnerability in Bristol. Instead, the prevalence of a younger population suggests those under five years of age are of greater concern.

Image credit: Vicky Norton

Implications

But what do these findings mean for Bristol’s climate resilience endeavours? Firstly, they suggest Bristol’s UHI may be a much greater concern than previously thought, necessitating more immediate, effective mitigation efforts. Secondly, they reiterate the context specific nature of heat vulnerability and the importance of conducting location specific research. Considering UHI intensity and ward-level heat vulnerability, these findings provide a starting point for guiding adaptive and mitigative resource allocation. If Bristol is to achieve climate resilience by 2030, initial action may be best targeted towards areas most at risk – Lawrence Hill and Easton – and tailored to those most vulnerable.

—————————

This blog is written by Vicky Norton, who has recently completed an MSc in Environmental Policy and Management run by Caboteer Dr Sean Fox.

Vicky Norton


Is Europe heading for a more drought prone future?

Parched landscape of Europe during the 2018 drought. Image credit: NASA, CC0

In 2018, Europe was hit with one of the worst droughts so far in the 21st century in terms of its extent, severity and duration. This had large-scale effects on the vegetation, both agricultural and natural. Harvest yields were substantially reduced, by up to 40% in some regions, and widescale browning of vegetation occurred.

A consortium of international researchers, including members of the Atmospheric Chemistry Research Group (ACRG) at the University of Bristol, asked the question: given the major impacts on vegetation, which plays an essential role in removing carbon dioxide (CO2) from the air, was there an observable change in the amount of carbon uptake across Europe during this event?

There are at least two ways to quantify the impact that the drought had on the terrestrial carbon sink: a bottom-up or top-down approach. Our plans and timelines to mitigate climate change rely on using these methods to predict how much of anthropogenic greenhouse gas emissions can be taken up by the natural biosphere. Currently, the terrestrial carbon sink (i.e. vegetation and soils) takes up approximately a third of manmade emissions. The oceans take up about a similar amount. But this important carbon sink is subject to variation brought about by naturally occurring variation in the climate and manmade climate change.

To investigate the impact of the drought on the European terrestrial carbon sink, modellers can predict how individual processes that contribute to the terrestrial sink would respond to the climate during that period – a bottom-up approach. For example, a study by Bastos et al. (2019) compared the estimates of net ecosystem exchange during the drought period from 11 vegetation models. Net ecosystem exchange quantifies the amount of CO2 that is either taken up or released from the ecosystem and is usually quantified as a flux of CO2 to the atmosphere. This value is negative if the ecosystem is a sink and positive if it is a source of CO2 to the atmosphere. The consensus from previous studies was that an unusually sunny spring led to early vegetation growth, which depleted soil moisture, which intensified the drought during the summer period. Although more CO2 was taken up by the biosphere in spring, in some European regions, like Central Europe, the lack of rain during the summer months meant that the soils, already depleted in water, could not maintain the vegetation, and this led to CO2 losses from the ecosystem.

At the ACRG we use measurements of gases in the atmosphere, like CO2, to improve estimates of emissions and uptake of these gases using a top-down approach called inverse modelling. Measurements are obtained from carefully calibrated instruments that are part of global networks of measurement sites like AGAGE (Advanced Global Atmospheric Gases Experiment) and ICOS (Integrated Carbon Observation System). We also require initial estimates of the fluxes, which we obtain from several sources, including vegetation models and bottom-up inventories, and a model that describes atmospheric transport of the gas (a model that describes how a pocket of air will travel in the atmosphere). Using a statistical approach, we can then improve on those initial estimates to get better agreement between the modelled and observed concentrations at the measurement sites. With this method, we have to account for all sources of a gas, both anthropogenic and natural, as the concentration that is recorded at a measurement site is the sum of all contributions from all sources.

In a recent publication by Thompson et al. (2020), we compared the CO2 flux estimates for regions in Europe over the last ten years using the ACRG modelling method, along with four other approaches. The combined estimate from these five modelling systems indicated that the temperate region of Europe (i.e. Central Europe) was a small source of CO2 during 2018. This means that when carbon losses due to plant and soil respiration are compared with the carbon uptake by photosynthesis, then a small positive amount was emitted to the atmosphere on balance. This is described by a positive net flux of 0.09 ± 0.06 PgC y-1 (mean ± SD) to the atmosphere, compared with the mean of the last 10 years of -0.08 ± 0.17 PgC y-1, which is a net sink of carbon, meaning that over the last 10 years more carbon was taken up by photosynthesis than emitted through ecosystem respiration. Northern Europe was also found to be a small source in 2018. This publication was part of a special issue on the impacts of the 2018 drought on Europe.

So what does this tell us about how carbon uptake might change in the future? A 2018 study by Samaniego et al. considered future projections from climate models under different scenarios ranging from 1°C to 3°C global temperature rise. They concluded that soil moisture droughts were set to become 40% more likely by the end of the 21st century under the current 3°C future compared with 1.5°C set out in the Paris Climate Agreement. Droughts like the previous “Lucifer” event in 2003, where as many as 35,000 people lost their lives due to the effects of the drought, are expected to become twice as likely. Failing to reduce greenhouse gas emissions so that we mitigate the global temperature rise will impact on our ability to grow food and make killer drought events more likely. Our study shows that more frequent droughts will reduce the biosphere’s ability to take up our CO2 emissions due to the impact of a warmer climate on the soil and vegetation of key natural sinks, and lead to fundamental changes in the structure and species composition of these systems into the future. Unfortunately, this will further exacerbate the effects of climate change.

Bibliography

A. Bastos, P. Ciais, P. Friedlingstein, S. Sitch, J. Pongratz, L. Fan, J. P. Wigneron, U. Weber, M. Reichstein, Z. Fu, P. Anthoni, A. Arneth, V. Haverd, A. K. Jain, E. Joetzjer, J. Knauer, S. Lienert, T. Loughran, P. C. McGuire, H. Tian, N. Viovy, S. Zaehle. Direct and seasonal legacy effects of the 2018 heat wave and drought on European ecosystem productivity. Science Advances, 2020; 6 (24): eaba2724 DOI: 10.1126/sciadv.aba2724

M. Reuter, M. Buchwitz, M. Hilker, J. Heymann, H. Bovensmann, J.P. Burrows, S. Houweling, Y.Y. Liu, R. Nassar, F. Chevallier, P. Ciais, J. Marshall, M. Reichstein. How much CO2 is taken up by the European Terrestrial Biosphere? Bulletin of the American Meteorological Society, 2017; 98 (4): 665-671 DOI: 10.1175/BAMS-D-15-00310.1

L. Samaniego, S. Thober, R. Kumar, N. Wanders, O. Rakovec, M. Pan, M. Zink, J. Sheffield, E.F. Wood, A. Marx. Anthropogenic warming exacerbates European soil moisture droughts. Nature Climate Change, 2018; 8, 421-426 DOI: 10.1038/s41558-018-0138-5

R.L. Thompson, G. Broquet, C. Gerbig, T. Kock, M. Lang, G. Monteil, S. Munassar, A. Nickless, M. Scholze, M. Ramonet, U. Karstens, E. van Schaik, Z. Wu, C. Rödenbeck. Changes in net ecosystem exchange over Europe during the 2018 drought based on atmospheric observations. Philosophical Transactions of the Royal Society B, 2020; 375 (1810): 20190512 DOI: 10.1098/rstb.2019.0512

————————————-

This blog is written by Cabot Institute member Dr Alecia Nickless, a research associate in the School of Chemistry at the University of Bristol.

Predicting the hazards of weather and climate; the partnering of Bristol and the Met Office

Image credit Federico Respini on Unsplash

When people think of the University of Bristol University, or indeed any university, they sometimes think of academics sitting in their ivy towers, researching into obscurities that are three stages removed from reality, and never applicable to the world they live in. Conversely, the perception of the Met Office is often one of purely applied science, forecasting the weather; hours, days, and weeks ahead of time. The reality is far from this, and today, on the rather apt Earth Day 2020, I am delighted to announce a clear example of the multidisciplinary nature of both institutes with our newly formed academic partnership.

This new and exciting partnership brings together the Met Office’s gold standard weather forecasts and climate projections, with Bristol’s world leading impact and hazard models. Our partnership goal is to expand on the advice we already give decision makers around the globe, allowing them to make evidence-based decisions on weather-related impacts, across a range of timescales.

By combining the weather and climate data from the Met Office with our hazard and impact models at Bristol, we could, for instance, model the flooding impact from a storm forecasted a week ahead, or estimate the potential health burden from heat waves in a decade’s time. This kind of advanced knowledge is crucial for decision makers in many sectors. For instance, if we were able to forecast which villages might be flooded from an incoming storm, we could prioritise emergency relief and flood defenses in that area days ahead of time. Or, if we projected that hospital admissions would increase by 10% due to more major heatwaves in London in the 2030s, then decision makers could include the need for more resilient housing and infrastructure in their planning. Infrastructure often lasts decades, so these sorts of decisions can have a long memory, and we want our decision makers to be proactive, rather than reactive in these cases.

While the examples I give are UK focussed, both the University of Bristol and the Met Office are internationally facing and work with stakeholders all over the world. Only last year, while holding a workshop in the Caribbean on island resilience to tropical cyclones; seeing the importance of our work the prime minister of Jamaica invited us to his residence for a celebration. While I don’t see this happening with Boris Johnson anytime soon, it goes to show the different behaviours and levels of engagement policy makers have in different countries. It’s all very well being able to do science around the world, but if you don’t get the culture, they won’t get your science. It is this local knowledge and connection that is essential for an international facing partnership to work, and that is where both Bristol and the Met Office can pool their experience.

To ensure we get the most out of this partnership we will launch a number of new joint Bristol-Met Office academic positions, ranging from doctoral studentships all the way to full professorships. These positions will work with our Research Advisory Group (RAP), made up of academics across the university, and be associated with both institutes. The new positions will sit in this cross-disciplinary space between theory and application; taking a combined approach to addressing some of the most pressing environmental issues of our time.

As the newly appointed Met Office Joint Chair I will be leading this partnership at Bristol over the coming years, and I welcome discussions and ideas from academics across the university; some of the best collaborations I’ve had have come from a random knock on the door, so don’t be shy in sharing your thoughts.

———————————
This blog is written by Dr Dann Mitchell – Met Office Joint Chair and co-lead of the Cabot Institute for the Environment’s Natural Hazards and Disaster Risk research.
You can follow him on Twitter @ClimateDann.

Dann Mitchell

World Water Day: Climate change and flash floods in Small Island Developing States

Pluvial flash flooding (otherwise known as flash flooding caused by rain) is a major hazard globally, but a particularly acute problem for Small Island Developing States (SIDS). Many SIDS experience extreme rainfall events associated with tropical cyclones (often referred to as hurricanes) which trigger excess surface water runoff and lead to pluvial flash flooding.

Following record-breaking hurricanes in the Caribbean such as Hurricane Maria in 2017 and Hurricane Dorian in 2019, the severe risk facing SIDS has been reaffirmed and labelled by many as a sign of the ‘new normal’ due to rising global temperatures under climate change. Nonetheless, in the Disaster Risk Reduction community there is a limited understanding of both current tropical-cyclone induced flood hazard and how this might change under different climate change scenarios, which inhibits attempts to build adaptive capacity and resilience to these events.

As part of the first year of my PhD research, I am applying rainfall data that has been produced by Emily Vosper and Dr Dann Mitchell in the University of Bristol BRIDGE group using a tropical cyclone rainfall model. This model uses climate model data to simulate a large number of tropical cyclone events in the Caribbean, which are used to understand how the statistics of tropical cyclone-induced rainfall might change under the 1.5C and 2C Paris Agreement scenarios. This rainfall data will be input into the hydrodynamic model LISFLOOD-FP to simulate pluvial flash flooding associated with hurricanes in Puerto Rico.

Investigating changes in flood hazard associated with different rainfall scenarios will help us to understand how flash flooding, associated with hurricanes, emerges under current conditions and how this might change under future climate change in Puerto Rico. Paired with data identifying exposure and vulnerability, my research hopes to provide some insight into how flood risk related to hurricanes could be estimated, and how resilience could be improved under future climate change.

————————————-
This blog is written by Cabot Institute member Leanne Archer, School of Geographical Sciences,  University of Bristol.
Leanne Archer

Climate change displacement: a step closer to human rights protection

On 20th January this year the United Nations Human Rights Committee released a landmark decision on people seeking international protection due to the effects of climate change. The decision did not include specific guidance as to where the tipping point lies, but it nevertheless remains highly relevant to future similar potential cases around the world.

The case and the plot twist

The case deals with the individual communication made by Ioane Teitiota, a national from the South Pacific country of Kiribati, under the Optional Protocol to the International Covenant on Civil and Political Rights (ICCPR). Based on this Protocol, he claimed that New Zealand had violated his right to life by rejecting his request for refugee status and returning him and his family home in 2015.

Flooded sea wall by a village on Tarawa, Kiribati (UN)

Teitiota argued in his case that the effects of climate change, such as sea-level rise, had forced him to migrate from Tarawa (the principle island in Kiribati) to New Zealand. He claimed that freshwater on Tarawa had become scarce due to salinization and that eroded inhabitable lands had resulted in not only a housing crisis but also land disputes. These, combined with social-political instability, created a dangerous environment for him and his family.

New Zealand’s judicial system did not find evidence that Teitiota had been involved in a land dispute or that he faced a real chance of being harmed in this context – that he was unable to grow food, find accommodation or access to potable water; that he faced life-threatening environmental conditions; and that his situation was materially different from other residents of Kiribati.

The Human Rights Committee supported the decision adopted by New Zealand and rejected almost all arguments brought by Teitiota. However, it specifically acknowledged that “without robust national and international efforts, the effects of climate change in receiving states may expose individuals to a violation of their rights under Article 6 or 7 of the Covenant, thereby triggering the non-refoulement obligations of sending states […] given that the risk of an entire country becoming submerged under the water is such an extreme risk, the conditions of life in such country may become incompatible with the right to life with dignity before the risk is realized.” (Parag. 9.11)

This paragraph has caught international attention. To be clear, the Committee is not expressly banning the return home of someone requesting international protection due to the impacts of climate change. But it indicates that states, individually and/or collectively, could be prohibited from sending people back to life-threatening conditions if they don’t cooperate to tackle the adverse effects of climate change in those countries. If the conditions in those countries are not thoroughly analyzed before discarding risk, they could breach the powerful international obligation of non-refoulement.

Landmark decision or a passing storm?

Despite delivering an important message, the Human Rights Committee ruling does not provide explicit guidance for its implementation. Nevertheless, assumptions can be extracted from the document that shed light on its relevance and growing significance.

To begin with, it is the first-ever ruling adopted by a UN Committee regarding the claim of a person seeking refuge due to climate change. It also reinforces the idea that environmental degradation, climate change and unsustainable development can compromise effective enjoyment of the right to life, as stated previously in the General Comment No. 36 and the case of Portillo Cáceres et al. v. Paraguay.

Furthermore, despite not being legally binding, the decision is based on international legal obligations assumed by the 172 States Parties to the ICCPR, and almost 106 States Parties to the Optional Protocol. The latter allows individual claims against the ICCPR such as Teitiota’s.

Contrary to media reports, such as those by CNN and The Guardian, the Human Rights Committee did not address Teitiota as a climate refugee. Instead it considered him a person under the protection of the ICCPR whose life could be at risk of being exposed to cruel, inhuman or degrading treatment due to the impacts of climate change. This means that the Committee´s examination was based on factors and standards intended to consider if there was a threat to Teitiota’s life in Kiribati from the perspective of International Human Rights Law, which is wider and more inclusive than that of International Refugee Law.

Sandbags attempt to prevent village huts flooding on Tarawa, Kiribati (Brad Hinton)

The Committee established that individuals seeking refugee status are not required to prove that they would face imminent harm if returned to their countries, implicitly relaxing the probatory standard required for pursuing international protection under a human rights scope. It argued that individuals could be pushed to cross borders looking for protection from climate change-related harm, caused not only by sudden-onset events but also slow-onset processes (Parag. 9.11).

The Human Rights Committee has continually raised the standard of states’ analyses of protection requests. In this ruling, it recognised that New Zealand’s courts carried out a careful and in-depth examination of both Kiribati’s and Teitiota’s situations before proceeding to deport him. But alongside this it highlighted factors that must be considered in future similar cases: for example, the prevailing conditions in the person’s country of origin; the foreseeable risks; the time left for authorities and the international community to intervene; and the efforts already underway (Parag. 9.13).

In this way, the Committee’s ruling represents a significant step forward. It has established new standards that may lead to the eventual international protection of people impacted by climate change. From now on, states should examine in detail the climatic and environmental conditions of a migrant’s country of origin under the possibility of breaching the non-refoulement obligation. As the former UN Special Rapporteur on human rights and the environment, John Knox, said: “If the crisis continues to worsen, a similar case in a few years may reach a very different result.”

———————————
This blog is written by Ignacio Odriozola, who is studying the MSc in Migration and Mobility Studies at the University of Bristol. He is a lawyer for the Universidad de Buenos Aires and a researcher for the South American Network for Environmental Migrations (RESAMA). This blog has been republished with kind permission from the Migration Mobilities Bristol. View the original blog.

We have the vaccine for climate disinformation – let’s use it

Exposing people to likely disinformation campaigns about bushfire causes will help inoculate them. JASON O’BRIEN/AAP
Australia’s recent bushfire crisis will be remembered for many things – not least, the tragic loss of life, property and landscape. But one other factor made it remarkable: the deluge of disinformation spread by climate deniers.
As climate change worsens – and with it, the bushfire risk – it’s well worth considering how to protect the public against disinformation campaigns in future fire seasons.
So how do we persuade people not to be fooled? One promising answer lies in a branch of psychology called “inoculation theory”. The logic is analogous to the way a medical vaccine works: you can prevent a virus spreading by giving lots of people a small dose.
In the case of bushfire disinformation, this means exposing, ahead of time, the myths most likely to be perpetrated by sceptics.

Bushfire bunkum

Disinformation can take many forms, including cherry-picking or distorting data, questioning of the scientific consensus by presenting fake experts, and outright fabrication.
On the issue of bushfires in Australia, there is little scientific doubt that human-caused climate change is increasing their magnitude and frequency. But spurious claims on social media and elsewhere of late sought to muddy the waters:
  • bots and trolls disseminated false arson claims which downplayed the impact of climate change on the bushfires
  • NewsCorp reported more than 180 arsonists had been arrested “in the past few months”. The figure was a gross exaggeration and distorted the real numbers
  • The misleading arson claim went viral after Donald Trump Jr, the president’s son, tweeted it. A UK government minister, Heather Wheeler, also repeated the false claim in the House of Commons
  • NSW Nationals leader John Barilaro, among others, wrongly suggested a lack of hazard reduction burning – the fault of the Greens – had caused the fires
  • Conservative commentators claimed the 2019-20 bushfires were no worse than those of the past.

Where will it go next?

Climate science clearly indicates Australia faces more dangerous fire weather conditions in the future. Despite this, organised climate denial will inevitably continue.

Research has repeatedly shown that if the public knows, ahead of time, what disinformation they are likely to encounter and why it is wrong, they are less likely to accept it as true.

This inoculation involves two elements: an explicit warning of an impending
attempt to misinform, and a refutation of the anticipated disinformation.

For example, research has shown that if people were told how the tobacco industry used fake experts to mislead the public about the health risks of smoking, they were less likely to be misled by similar strategies used to deny climate change.

It is therefore important to anticipate the next stage of disinformation about the causes of bushfire disasters. One likely strategy will be to confuse the public by exploiting the role of natural climate variability.

This tactic has been used before. When natural variability slowed global warming in the early 2000s, some falsely claimed that global warming “had stopped”.

Of course, the warming never stopped – an unexceptional natural fluctuation merely slowed the process, which subsequently resumed.

Natural climate variability may bring the occasional mild fire season in future. So let’s arm ourselves with the facts to combat the inevitable attempts to mislead.

Here are the facts

The link between human-caused climate change and extreme weather conditions is well established. But natural variability, such as El Niño and La Niña events in the Pacific Ocean may at times overshadow global warming for a few years.

The below video illustrates this. We used historical data from Adelaide to project the expected incidence of extreme heatwaves for the rest of the century, assuming a continued warming trend of 0.3℃ per decade.

The top panel shows the distribution of all 365 daily maximum temperatures for a year, with the annual average represented by the vertical red line. As the years tick over, this distribution is moving up slowly; the red line increasingly diverges from the average temperature observed before the climate started changing (the vertical black line).

The bottom panel shows the expected incidence of extreme heatwaves for each year until 2100. Each vertical line represents an intense heatwave (five consecutive days in excess of 35℃ or three days in excess of 40℃). Each heatwave amplifies the fire danger in that year.

The analysis in the video clarifies several important aspects of climate change:

  1. the number and frequency of extreme heatwaves will increase as the climate continues to warm
  2. for the next few decades at least, years with heatwaves may be followed by one or more years without one
  3. the respite will only be brief because the inexorable global warming trend makes extreme fire conditions more and more inevitable.

Looking ahead

When it comes to monster bushfire seasons, the link to climate change is undeniable. This season’s inferno is a sign of worse to come – even if it doesn’t happen every year.

Educating the public on climate science, and the tactics used by disinformers, increases the chance that “alternative facts” do not gain traction.

Hopefully, this will banish disinformation to the background of public debate, paving the way for meaningful policy solutions.

———————————————
This blog is written by Cabot Institute member Professor Stephan Lewandowsky, Chair of Cognitive Psychology, University of Bristol and John Hunter, University Associate, Institute for Marine and Antarctic Studies, University of TasmaniaThis article is republished from The Conversation under a Creative Commons license. Read the original article.

The East Asian monsoon is many millions of years older than we thought

Sub-tropical rainforest in China. Image credit: UMBRELLA project

The East Asian monsoon covers much of the largest continent on Earth leading to rain in the summer in Japan, the Koreas and lots of China. Ultimately, more than 1.5 billion people depend on the water it provides for agriculture, industry and hydroelectric power.

Understanding the monsoon is essential. That is why colleagues and I recently reconstructed its behaviour throughout its 145m-year history, in order to better understand how it acts in response to changes in geography or the wider climate in the very long term, and what that might mean for the future.

Our study, published in the journal Science Advances indicates that the East Asian monsoon is much older and more varied than previously thought. Until quite recently the general consensus was that the monsoon came into being around 23m years ago, some time after the Tibetan Plateau was formed.

However, we show that it has been ever present for at least the past 145m years (except during the Late Cretaceous: the era of T. Rex), regardless of whether there was a Tibetan Plateau or how much CO₂ was in the atmosphere.

What is a monsoon?

At its most simple level a monsoon is a highly seasonal distribution in precipitation leading to a distinct “wet” and “dry” seasons – the word even derives from the Arabic “mausim”, translated as “season”.

The East Asian monsoon is a “sea breeze monsoon”, the most common type. They form because land and sea heat up at different rates, so high pressure forms over the sea and low pressure over land which results in wind blowing onshore in the summer.


It’s the world’s largest, highest plateau.
Rashevskyi Viacheslav / shutterstock

Although The Tibetan Plateau is not strictly needed to form the East Asian monsoon it can serve to enhance it. At 5km or more above sea level, the plateau simply sits much higher in the atmosphere and thus the air above it is heated much more than the same air would be at a lower elevation (consider the ground temperature in Tibet compared to the freezing air 5km above your head). As that Tibetan air is warmer than the surrounding cold air it rises and acts as a heat “pump”, sucking more air in to replace it and enhancing the monsoon circulation.

Changes over the (millions of) years

We found the intensity of the monsoon has varied significantly over the past 145m years. At first, it was around 30% weaker than today. Then, during the Late Cretaceous 100-66m years ago, a huge inland sea covered much of North America and weakened the Pacific trade winds. This caused East Asia to become very arid due to the monsoon disappearing.

However, rainfall patterns changed substantially after the Indian tectonic plate collided into the Asian continent around 50m years ago, forming the Himalayas and the Tibetan Plateau. As the land rose up, so did the strength of the monsoon. Our results suggest that 5-10m years ago there were “super-monsoons” with rainfall 30% stronger than today.

But how can we be sure that such changes were caused by geography, and not elevated carbon dioxide concentrations? To test this, we again modelled the climate for all different time periods (roughly every 4m years) and increased or reduced the amount of CO₂ in the atmosphere to see what effect this had on the monsoon. In general, irrespective of time period chosen, the monsoon showed little sensitivity (-1% to +13%) to changes in CO₂ compared to the impact of changes in regional geography.

Climate models are working

The monsoon in East Asia is mainly a result of its favourable geographic position and regional topography – though our work shows that CO₂ concentrations do have an impact, they are secondary to tectonics.

The past can help us better understand how the monsoon will behave as the climate changes – but its not a perfect analogue. Although rainfall increased almost every time CO₂ doubled in the past, each of these periods was unique and dependent on the specific geography at the time.

The reassuring thing is that climate models are showing agreement with geological data through the past. That means we have greater confidence that climate models are able to accurately predict how the monsoon will respond over the next century as humans continue to emit more CO₂ into the atmosphere.The Conversation

—————————–
This blog was written by Cabot Institute member Dr Alex Farnsworth, Postdoctoral Research Associate in meteorology at the University of Bristol. This article is republished from The Conversation under a Creative Commons license. Read the original article.

Alex Farnsworth

Flooding in the UK: Understanding the past and preparing for the future

On the 16th of October 2019, Ivan Haigh ­Associate Professor in Coastal Oceanography at the University of Southampton – gave a presentation on the “characteristics and drivers of compound flooding events around the UK coast” at the BRIDGE research seminar in the School of Geographical Sciences. He began by outlining the seriousness of flood risk in the UK – it is the second highest civil emergency risk factor as defined by the Cabinet Office – before moving on to the first section of the talk on his work with the Environment Agency on its Thames Estuary 2100 plan (TE2100)[1].

Thames Estuary 2100 plan: 5-year review

The construction of a Thames barrier was proposed after severe flooding in London in 1953, and it eventually became operational 30 years later in 1983. Annually, the Thames barrier removes around £2bn of flood damage risk from London and is crucial to the future prosperity of the city in a changing environment.

The Thames Barrier in its closed formation. Image source: Thames Estuary 2100 Plan (2012)

Flood defences in the Thames estuary were assessed in the TE2100 plan, which takes an innovative “adaptive pathways management approach” to the future of these flood defences over the coming century. This approach means that a range of flood defence options are devised and the choice of which ones to implement is based upon the current environmental data and the latest models of future scenarios, in particular predictions of future sea level rise.

For this method to be effective, accurate observations of recent sea level changes must be made in order to determine which management pathway to implement and to see if these measurements fit with the predictions of future sea level rise used in the plan. This work is carried out in reviews of the plan at five-year intervals, and it was this work that Ivan and his colleagues were involved with.

There is significant monthly and annual variability in the local tide gauge records that measure changes in sea level, and this can make it difficult to assess whether there is any long-term trend in the record. Using statistical analysis of the tide gauge data, the team was able to filter 91% of the variability that was due to short term changes in atmospheric pressure and winds to reveal a trend of approximately 1.5 mm per year of sea level rise, in line with the predictions of the model that is incorporated into the TE2100 plan.

Compound flood events around the UK Coast

In the second half of his presentation, Ivan went on to discuss a recent paper he was involved with studying compound flood events around the UK (Hendry et al. 2019)[2]. A compound flood occurs when a storm surge, caused by low atmospheric pressure allowing the sea surface to rise locally, combines with river flooding caused by a large rainfall event. These can be the most damaging natural disasters in the UK, and from historical data sets stretching back 50 years at 33 tide gauges and 326 river stations, the team were able to determine the frequency of compound floods across the UK.

Along the west coast, there were between 3 and 6 compound flooding events per decade, whereas on the east coast, there were between 0 and 1 per decade. This difference between east and west is driven by the different weather patterns that lead to these events. On the west coast it is the same type of low-pressure system that causes coastal storm surges and high rainfall. However, on the east coast different weather patterns are responsible for high rainfall and storm surges, meaning it is very unlikely they could occur at the same time.

Number of compound flood events per decade at each of the 326 river stations in the study. Triangle symbols implies rover mouth on West coast, circles East coast and squares South coast. Image Source: Hendry et al. 2019 [2]

There is also significant variability along the west coast of the UK as well, and the team investigated whether the characteristics of the river catchments could impact the possibility of these compound flooding events occurring. They found that smaller river catchments, and steeper terrain within the catchments, increased the probability of these compound flooding events occurring as water from rainfall was delivered to the coast more quickly. From the improved understanding of the weather patterns behind compound flooding events that this work provides, the quality and timeliness of flood warnings could be improved.

From the question and answer session we heard that current flood risk assessments do not always include the potential for compound flood events, meaning flood risk could be underestimated along the west coast of the UK. We also heard that Ivan will be working with researchers in the hydrology group here at the University of Bristol to further the analysis of the impact of river catchment characteristics on the likelihood of compound flooding events, and then extending this analysis to Europe, North America and Asia.

References

[1] Environment Agency (2012), “Thames Estuary 2100 Plan”.
[2] Alistair Hendry, Ivan D. Haigh, Robert J. Nicholls, Hugo Winter, Robert Neal, Thomas Wahl, Amélie Joly-Laugel, and Stephen E. Darby, (2019). “Assessing the characteristics and drivers of compound flooding events around the UK coast”, Hydrology and Earth System Science, 23, 3117-3139.

——————————————-

This blog was written by Cabot Institute member Tom Mitcham. He is a PhD student in the School of Geographical Sciences at the University of Bristol and is studying the ice dynamics of Antarctic ice shelves and their tributary glaciers.

Tom Mitcham

Read Tom’s other blog:
1. Just the tip of the iceberg: Climate research at the Bristol Glaciology Centre